Open-File Report 2015-1033
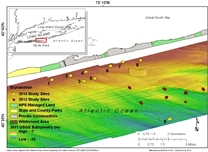
Field ProgramThis page describes the deployment locations,and equipment mounted at each site. Bathymetric survey data collected and processed by the Woods Hole Coastal and Marine Science Center in 2011 (Schwab and others, 2013) were used to locate the tripod positions. For the oceanographic experiment, 9 buoys and 11 tripods were deployed off Fire Island from the research vessel (RV) Connecticut during two trips from February 3 to 7, 2014. All of the gear was recovered aboard the RV Connecticut from May 3 to 8, 2014. Deployment and recovery dates, depths, instrument types, instrument locations as heights above the bottom in centimeters or meters (CMAB and MAB), observations at each site, sampling intervals, and sampling schemes are summarized for each site in the Instrument Log (PDF format). Flobees and Minipods, Sites 2 and 3 Flobees
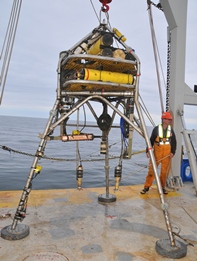
The instruments at sites 2 and 3 were designed to provide measurements near the seafloor. Flow tripods 3.5 m high (Flobee; fig. 2) were deployed at sites 2 and 3 to provide comprehensive measurements at various heights above the seabed (see Instrument Log). The site 2 Flobee was deployed at 40.6248° N., -73.1965° W., on the sea floor at a water depth of 10.9 m. Instrumentation included a conductivity/temperature/depth sensor (CTD), two acoustic Doppler velocimeters (ADVs) to measure current speed and direction at a single point, and a down-looking pulse-coherent acoustic Doppler current profiler (PCADP) to measure current velocities within one meter of the bottom. Sediment resuspension was measured by two 25-centimeter (cm) transmissometers, two optical backscatter sensors (OBSs), three Environmental Characterization Optics (ECO) turbidity sensors, and an acoustic backscatter sensor (ABS). Pressure was measured by two Paroscientific Digiquartz (Paros) pressure sensors. This Flobee tipped over on February 13th, 2014, about a week after deployment. This created substantial tilt of the sensor measurements on the tripod. Velocity and other data that were jeopardized have been removed from the dataset. Some data, such as pressure and temperature, were retained but may show an offset at that event. One of the ADVs on this tripod failed to collect data because of an instrument malfunction. The site 3 Flobee was deployed at 40.6195° N., -73.1844° W., on the sea floor at a water depth of 15.1 m. Instrumentation included a CTD, two ADVs to measure current speed and direction at a single point, and a down-looking high-resolution pulse-coherent Aquadopp current profiler (AquadoppHR) to measure current velocities within one meter of the bottom. Sediment resuspension was measured by two 25-cm transmissometers, two OBSs, three ECO turbidity sensors, and an ABS. Pressure was measured by three Paros pressure sensors. Minipods
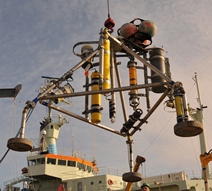
Measurements that would interfere with sensors on the Flobee were made from a smaller adjacent tripod (minipod, fig. 3). Both minipods obtained sonar images (overhead views) and sonar profiles (actual elevation measurements) of the seabed surface. Profiles of current speed and direction over the entire water column and wave data were measured with two upward-looking acoustic Doppler current profilers (ADCPs). The site 2 minipod was deployed at 40.6244° N., -73.1961° W., on the sea floor at a water depth of 11.5 m. In addition to the instrumentation listed above, the minipod at site 1 also included a still camera for taking photographs every 2 hours to document the seabed. The two upward-looking profilers on this platform were a Teledyne RD Instruments (TRDI) ADCP and a Nortek acoustic wave and current profiler (AWAC). The site 3 minipod was deployed at 40.6192° N., -73.1840° W., on the sea floor at a water depth of 16 m. In addition to the instrumentation listed above the minipod at site 2 included a laser in situ suspended scattering and transmissometry (LISST) sensor to provide estimates of the sediment particle size. The two upward-looking profilers on this platform were a TRDI ADCP and a TRDI Sentinel V ADCP. Micropods and Nanopod, Sites 1, 6, 7, 8, and 9;
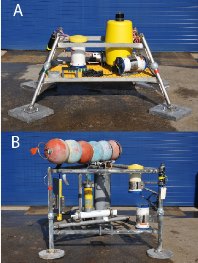
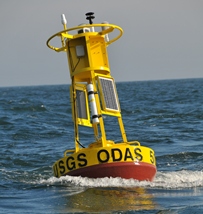
A nanopod was deployed at site 6 (fig. 4A). Micropods (fig. 4B) were deployed at sites 1, 7, 8, and 9. Each micropod was equipped with instrumentation to measure waves, currents, salinity, temperature, and pressure. Site 1 was deployed at 40.6207° N., -73.2131° W., on the sea floor at a water depth of 11.5 m. Instrumentation at this site included a TRDI ADCP, a Sea-Bird Electronics (SBE) Seagauge, and a SBE Seacat. Site 6 was deployed at 40.6332° N., -73.1595° W., on the sea floor at a water depth of 11.8 m. Instrumentation at this site included a TRDI ADCP and a SBE Seacat. Site 7 was deployed at 40.6369° N., -73.1484° W., on the sea floor at a water depth of 11.5 m. Instrumentation at this site included a TRDI ADCP, a SBE Seagauge, and a SBE Seacat. Site 8 was deployed at 40.6384° N., -73.1321° W., on the sea floor at a water depth of 11.5 m. Instrumentation at this site included a TRDI ADCP, a SBE Seagauge, and a SBE Microcat. Site 9 was deployed at 40.5851° N., -73.1050° W., on the sea floor at a water depth of 24.9 m. Instrumentation at this site included a TRDI ADCP and a SBE Microcat. Surface and Meteorological Buoys Surface buoys were deployed at sites 1 through 8 primarily to mark the position of the bottom equipment. Surface salinity was measured at each buoy by SBE Microcat recorders. In addition to an SBE Microcat, a meteorological station was mounted on buoys A, B and E (fig. 5). The meteorological station recorded 15-minute raw data and hourly averages of air temperature, barometric pressure, relative humidity, wind speed, wind gust, wind direction, and short wave radiation. In addition, hourly averages also included voltage for main and backup power sources. Global positioning data were collected every 8 hours and included date, time, latitude, longitude , Universal Coordinated Time, and status (A = valid, V = warning). Surface Buoy A (site 1) was deployed at 40.6206° N., -73.2139° W., on the surface at a water depth of 11.98 m. This buoy also collected meteorological data. Surface Buoy C (site 2) was deployed at 40.6246° N., -73.1971° W., on the surface at a water depth of 12.2 m. Surface Buoy D (site 3) was deployed at 40.6193° N., -73.1852° W., on the surface at a water depth of 16.34 m. Surface Buoy B (site 4) was deployed at 40.6277° N., -73.1826° W., on the surface at a water depth of 12.3 m. This buoy also collected meteorological data. This unit collected data for 3 days before the batteries became disconnected. Surface Buoy F (site 5) was deployed at 40.6216° N., -73.1745° W., on the surface at a water depth of 14.14 m. Surface Buoy G (site 6) was deployed at 40.6332° N., -73.1603° W., on the surface at a water depth of 12.3 m. Surface Buoy H (site 7) was deployed at 40.6369° N., -73.1489° W., on the surface at a water depth of 11.98 m. Surface Buoy E (site 8) was deployed at 40.6383° N., -73.1326° W., on the surface at a water depth of 11.98 m. This buoy also collected meteorological data. This unit collected data through March 28, 2014, before malfunctioning. Waverider Buoy A Datawell Waverider buoy (site 9, fig. 6) was deployed at 40.5847° N., -73.1063° W., on the surface at a water depth of 25.5 m. Measurements include wave height, peak period, peak direction, and surface temperature. The data are telemetered in near-real time and distributed through the Coastal Data Information Program Web site (http://cdip.ucsd.edu). The buoy's Station ID is 207. The buoy’s National Data Buoy Center station number is 44094 – Fire Island Nearshore, NY. Sediment Sampling A large Van Veen grab sampler was used to take sediment samples at each site after deployment. The sediment-sample data are not included in this report but can be made available upon request. |

![]() U.S. Department of the Interior |
U.S. Geological Survey
U.S. Department of the Interior |
U.S. Geological Survey
URL: http://pubsdata.usgs.gov/pubs/of/2015/1033/ofr2015-1033-methods.html
Page Contact Information: GS Pubs Web Contact
Page Last Modified: Wednesday, 07-Dec-2016 21:40:56 EST