Open-File Report 2017–1098
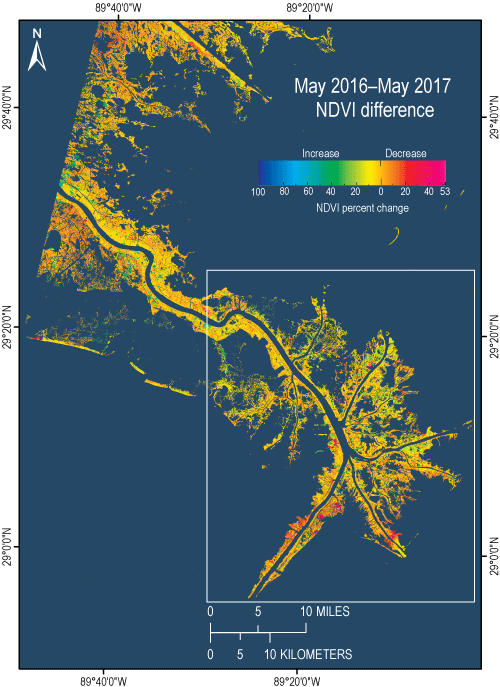
Figure 1. Map showing overview of normalized difference vegetation index (NDVI) change in the lower Mississippi River Delta from May 2016 to May 2017 based on Sentinel-2 MultiSpectral Instrument (MSI) images. Colors indexed in the legend represent the percent increase or decrease of NDVI from the earlier to the later date. Darker orange to red indicates low (0–20 percent), red to pink indicates medium (20–40 percent), and pink indicates high (greater than 40 percent) decrease in the proportion of live biomass composing the vegetation canopy. Conversely, light orange indicates low, yellow to green indicates medium, and green to turquoise indicates high increase in the live biomass proportion. The box outlines the area of interest shown in figure 2. |
First posted July 28, 2017 |

![]() U.S. Department of the Interior |
U.S. Geological Survey
U.S. Department of the Interior |
U.S. Geological Survey
URL: http://pubsdata.usgs.gov/pubs/of/2017/1098/ofr20171098_fig1.html
Page Contact Information: GS Pubs Web Contact
Page Last Modified: Friday, 28-Jul-2017 14:04:31 EDT
