FISC - St. Petersburg
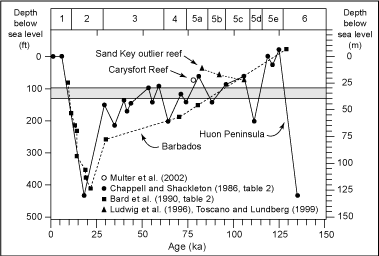
Figure 80. Graph shows paleotemperature curves for marine-isotope Stages 6-1 developed from global proxy oxygen-isotope records and coral-age data (modified from Ludwig et al., 1996). Stage 5 time is divided into substages 5e-5a. The paleotemperature curves equate to periods of high and low sea levels. Note that sea-level maxima (highest positions) since the substage-5e highstand have not been as high as present sea level. Also note that the standard curve for Barbados (Windward Islands) shows general agreement with data from elsewhere though the Barbados curve is less detailed. The Key Largo Limestone reef (middle and upper Keys) belongs to substage 5e. Corals at various sites along the shelf margin and from the Carysfort (Fig. 35, 36A) and Sand Key (Fig. 18) outlier reefs have been dated to substages 5c, 5b, and 5a (Ludwig et al., 1996; Toscano, 1996; Toscano and Lundberg, 1998, 1999; Multer et al., 2002). Shading represents shelf-wide upper-slope terrace depths (30-40 m) below present sea level. The curves indicate that sea level remained below elevation of the Florida shelf between substage 5a and the Holocene. Lack of Florida corals dating to that period confirms platform exposure from ~77.8 ka (Multer et al., 2002) to ~9.6 ka (Mallinson et al., 2003).
|
Can't see the printable PDF version? Get the free Adobe Acrobat® Reader. |
