
| Lake Pontchartrain Basin: Bottom Sediments and Related Environmental Resources |
Summary of Geological and Chemical Data (cont.)
Inorganic Chemistry
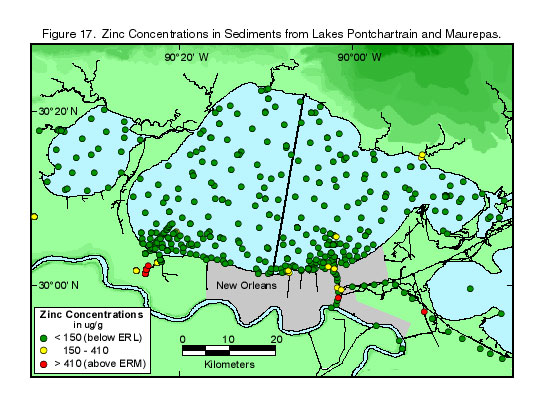 Figure 17. Zinc |
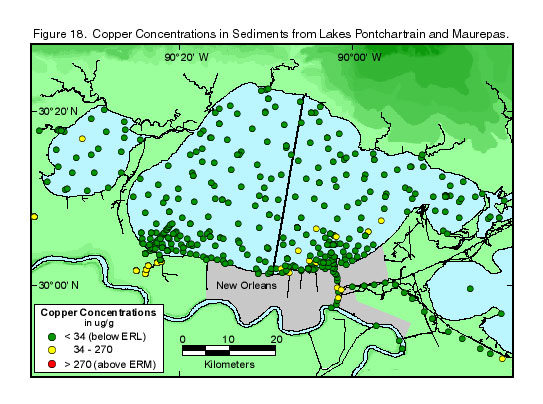 Figure 18. Copper |
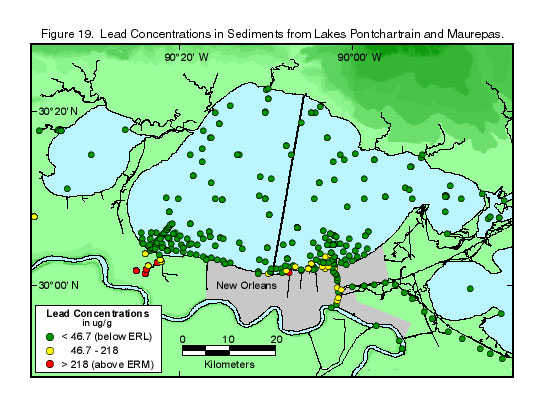 Figure 19. Lead |
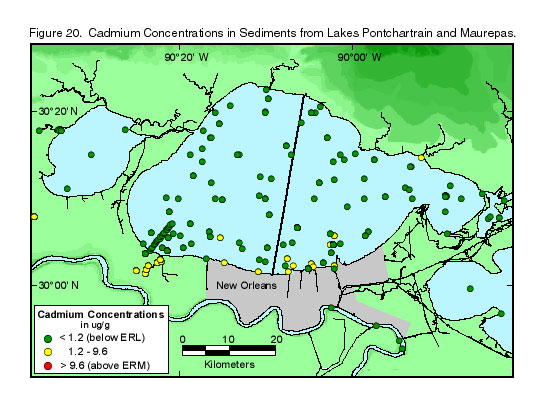 Figure 20. Cadmium |
 Figure 21. Chromium |
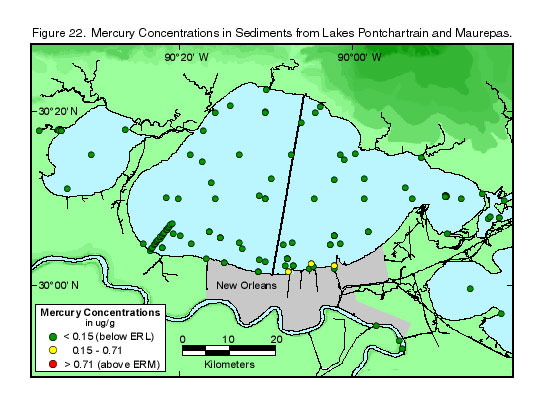 Figure 22. Mercury |
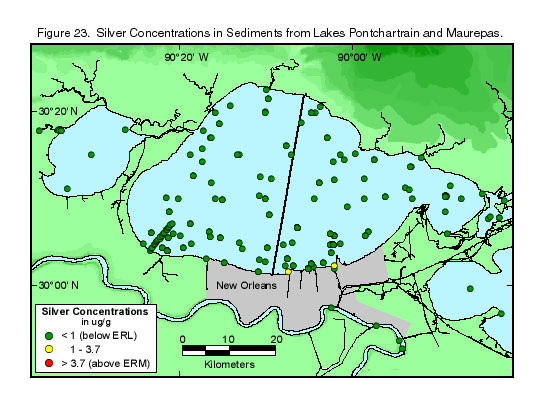 Figure 23. Silver |
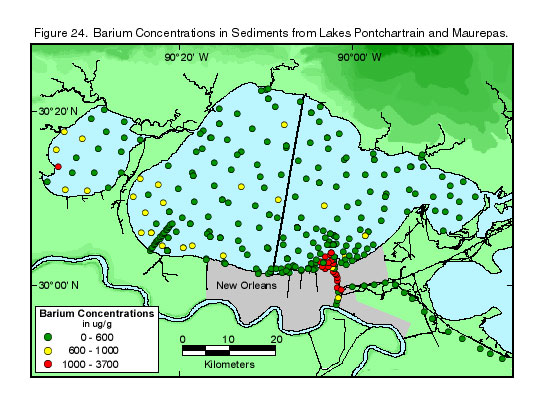 Figure 24. Barium |
Pollutant fractions and toxicity potentials
Metal concentrations in estuarine sediments have two components: a natural component that is usually associated with fine-grained material and clays and an anthropogenic component associated with pollutants. Total concentrations are plotted in figures 17 to 24 for eight elements from among the many inorganic constituents reported in the major chemical table (appendix D). No distinction between analytical methods is made for these figures (see discussion below).
The size of the dots is proportional to their concentration, as shown in the figure legends. Samples whose metal concentrations exceed screening guidelines for potential sediment toxicity to bottom organisms are plotted in yellow and red for "Toxic Effects Low (ERL)" and "Toxic Effects Median (ERM)", respectively (Long and others, 1995). These sediment-quality guidelines (SQGs) were developed for bulk sediments by Long and others (1995) by statistical comparisons of organism toxicity tests to chemical composition.
The legend for the barium figure (fig. 24) is slightly different. The color patterns for this illustration are concentration coded only. No toxicity screening guidelines are indicated as in the case of the other metals. Barium, in forms presumed to be present here, is not regarded as toxic. Quality control for barium is complicated by differing analytical methodologies (see Discussion). Hence, barium relationships shown here should be regarded as schematic.
One may observe that contaminant metals ( lead, copper, zinc, cadmium, silver, and arsenic) are all found in elevated concentrations near the coast and are concentrated near New Orleans shore or within the inland waterways. (See Bonnet Carré Spillway and Coastal Waterways Impacts for further discussion.) It should be noted that no significantly elevated metal concentrations are observed at the opening of the Bonnet Carré Spillway.
Leachate versus total dissolution analysis
The analytical method used for sediment analysis can significantly affect the concentration range for certain constituents. Leachate techniques using nitric acid (HNO3) or hydrochloric acid (HCl) are designed to recover the pollutant-related fraction of sediment metal. A variable, and often significant, part of these metals is locked up in silicate mineral structures that are resistant to normal acid leaching. Hydrofluoric acid or fusion in alkali melts is needed for total sample breakdown. Several sources of data in the database report total dissolution analysis. A mean of these analyses is reported for Lake Pontchartrain sediments in table 9.
More quantitative comparisons between the leachate and total dissolution analyses are given in the Discussion (in particular, see fig. 40). There, it is noted that the differences in analytical recovery are particularly large for chromium and barium. These differences in methods help account for the wide range of concentrations found adjacent to each other in figure 21 (chromium) and figure 24 (barium).
Table 9. Means and standard deviations for metal
concentrations
in Lake Pontchartrain sediments
[These data are a composite from data of Flowers
and Isphording (1990),
Sarkar (1995), and Macauley and Summers (1998),
which are based
on total dissolution metal recovery methods.]
| Element | Mean (ug/g) | SD (ug/g) | N |
| Hg | 0.042 | 0.021 | 114 |
| Ag | 0.146 | 0.085 | 127 |
| Cd | 0.211 | 0.162 | 127 |
| Se | 0.34 | 0.22 | 122 |
| Sb | 0.62 | 0.36 | 127 |
| Sn | 1.53 | 0.76 | 126 |
| As | 7.02 | 3.93 | 127 |
| Co | 9.41 | 2.43 | 121 |
| Cu | 17.5 | 8.99 | 285 |
| Pb | 17.5 | 6.78 | 164 |
| Ni | 18.2 | 7.86 | 248 |
| Cr | 56.3 | 19.8 | 285 |
| Zn | 73.3 | 31.1 | 285 |
| V | 78.3 | 31.3 | 121 |
| Ba | 482.1 | 187.6 | 115 |
| Mn | 526.2 | 398.7 | 127 |
| Fe | 24292 | 10729 | 248 |
| Al | 50511 | 18233 | 127 |
| Forward to Organic
Components |
|
Table of Contents: Sediment Database and Geochemical Assessment |
|