
| Lake Pontchartrain Basin: Bottom Sediments and Related Environmental Resources |
SPECIAL TOPICS AND CURRENT DEVELOPMENTS
- Contaminant metal distribution: Pollutant fraction of Lake Pontchartrain sediments
- Historical accumulation of contaminants in sediments near the New Orleans coast
- Barium anomalies in sediments
- Bonnet Carré spillway opening: A review of particulate matter composition
- Comparison of bulk-sediment analyses with underway sampling data
- Leachate versus total dissolution methods
- Future study needs and opportunities
| back to Table of Contents |
Contaminant metal distribution: Pollutant fraction of Lake Pontchartrain sediments
Concentrations of metals in Lake Pontchartrain surficial sediments are within the range established for pristine sediments except for urban nearshore areas. This does not exclude addition of metals to sediments at levels below toxic influence. Influx of metals to the lake is expected from canals, river discharge, road runoff (causeway), aerosols, and wastes from boat traffic. Subtoxic concentrations of metals in suspended sediments in the Mississippi River have been shown to increase markedly in the 20th century. These concentrations peaked in the 1970’s, as was seen in figure 33 for lead concentrations in a core from the Mississippi Delta (data from Presley and others, 1988). Thus, Mississippi River particulates entering Lake Pontchartrain via the Bonnet Carré Spillway probably carried variable subtoxic metal loads, depending on the time of their entry.
Selected data for late 1970’s Mississippi River suspended solids are shown in table 11, along with Lake Pontchartrain mean surficial sediment values and bulk sediment toxicity ranges. Mississippi River suspended matter in the 1990’s has substantially lower trace metal concentrations than those shown in the table.
Table 11. Mean chemical composition for Lake Pontchartrain bottom sediments and Mississippi River suspended sediment.
| Lake Pontchartrain1 | Miss. River TSS2 | Toxicity criteria levels | |||||
| Constituent | Mean | SD | N | Mean | N | Low3 | Medium4 |
| Ag (µg/g) | 0.146 | 0.085 | 127 | 1 | 3.7 | ||
| Al (%) | 5.05 | 1.82 | 127 | 6.00 | 58 | NA | NA |
| As (µg/g) | 7.02 | 3.93 | 127 | 10.8 | 58 | 8.2 | 70 |
| Ba (µg/g) | 482.1 | 187.6 | 115 | 599 | 58 | NA | NA |
| Cd (µg/g) | 0.211 | 0.162 | 127 | 0.045 | 58 | 1.2 | 9.6 |
| Co (µg/g) | 9.41 | 2.43 | 121 | 12.9 | 58 | NA | NA |
| Cr (µg/g) | 56.3 | 19.8 | 285 | 64.1 | 58 | 81 | 370 |
| Cu (µg/g) | 17.5 | 8.99 | 285 | 22.7 | 58 | 34 | 270 |
| Fe (%) | 2.43 | 1.07 | 248 | 2.92 | 58 | NA | NA |
| Hg (µg/g) | 0.042 | 0.021 | 114 | 0.053 | 58 | 0.15 | 0.71 |
| Mn (µg/g) | 526.2 | 398.7 | 127 | 1249 | 58 | NA | NA |
| Ni (µg/g) | 18.2 | 7.86 | 248 | 39.8 | 58 | 20.9 | 51.6 |
| Pb (µg/g) | 17.5 | 6.78 | 164 | 25.7 | 58 | 46.7 | 218 |
| Sb (µg/g) | 0.62 | 0.36 | 127 | 1.65 | 58 | ||
| Se (µg/g) | 0.34 | 0.22 | 122 | 0.66 | 58 | ||
| Sn (µg/g) | 1.53 | 0.76 | 126 | ||||
| V (µg/g) | 78.3 | 31.3 | 121 | 86.7 | 58 | ||
| Zn (µg/g) | 73.3 | 31.1 | 285 | 106.3 | 58 | 150 | 410 |
Notes
NA = these elements are not toxic
even at high concentrations
1 Mean chemical compositions of Lake Pontchartrain sediments (data from
table 9).
2 Data for Mississippi River total suspended solids (TSS)
from A. Horowitz, USGS (NASQAN Data).
3 Sediment quality guidelines (SQG) for potential toxicity levels
("Low"), Long and others (1995).
4 Sediment quality guidelines (SQG) for potential toxicity levels
("Medium"), Long and others (1995).
We now estimate pollutant contributions to metals in mean sediment concentrations in Lake Pontchartrain by methods similar to those used by Trefry, Metz, and others (1985) and Trefry and others (1986). The above authors used the ratio of Pb to Al in pre-anthropogenic sediments in cores from the Mississippi Delta to establish natural background values of Pb. Aluminum is strongly associated with clay minerals, which are also the principal host of naturally occurring Pb. Lead in excess of that corresponding to naturally occurring Pb:Al ratios is attributed to pollutants.
The chemical relationships for delta sediments should be applicable to a considerable degree to Lake Pontchartrain sediments, partly because their basic mineralogic composition is similar. In fact, as discussed earlier, a substantial but still not quantified fraction of Lake Pontchartrain sediments has probably been supplied by the Mississippi River during flood stages.
In the equations below, we utilize the "natural" ratios for Pb and other metals using data from Presley and others (1980; 1988) to estimate pre-anthropogenic concentrations of the metals in sediments. For metals in µg/g and Al in weight %, pollutant concentrations are :
1) Pollutant Pb = Total Pb – [2.5 x Al%]
2) Pollutant Cd = Total Cd – [0.0117 x Al%]
3) Pollutant Cu = Total Cu – [2.826 x Al%]
4) Pollutant Zn = Total Zn – [13.75 x Al%]
5) Pollutant Ag = Total Ag – [0.0101 x Al%]
6) Pollutant Ba = Total Ba – [49.83 x Al%]
Using these values and the mean data for Lake Pontchartrain sediments, we obtain the results in table 12.
Table 12. Pollutant concentrations for selected contaminant metals in Lake Pontchartrain surficial sediments.
| Element |
Mean Concentration |
Pollutant concentration |
Pollutant % of total |
| Ag (µg/g) | 0.135 | 0.08 | 62 |
| Ba (µg/g) | 470 | 218 | 46 |
| Cd (µg/g) | 0.243 | 0.15 | 72 |
| Cu (µg/g) | 16.1 | 3.23 | 18 |
| Pb (µg/g) | 16.9 | 3.86 | 28 |
| Zn (µg/g) | 71.8 | 4.87 | 5 |
The estimates in this table suggest that the means of total metals for selected elements contain substantial proportions of pollutants, ranging from 72% for cadmium to 5% for zinc. It should be noted that analytical and comparability problems will be greater for elements in very low concentration, like silver and cadmium. Rather surprisingly, although barium is not a toxic metal in the form in which it is probably being contributed (barite from drilling mud), its "pollutant" addition to lake sediments is calculated to be nearly half the total concentration.
| back to top |
Historical accumulation of contaminants in sediments near the New Orleans coast
Cores recovered by M. Marot, U.S. Geological Survey, St. Petersburg (see data in appendix D), and J. Flocks (Manheim and others, 1999) provide background on historical levels of metal dispersion from the New Orleans area. Figure 35 shows data from a vibracore taken in a deep dredged pit several hundred meters north of the Inner Harbor Canal mouth (see fig. 35A for location). The pit was originally dredged in 1932. Sediment layers have accumulated undisturbed since that time. The layers provide a time-linked record of contaminant conditions reflected in the metal concentrations of the sediments. An annual rate of sedimentation of 1.6 cm per year can be estimated from the total thickness of sediments accumulated since the pit was dug.
The lowest two data points in figure 35C reflect Pleistocene (presettlement) sediments. Rapid increases in concentration of lead are noted from the 1960’s through the 1980’s. Similar increases in other metals (zinc, copper, cadmium) also occur. A steep drop in lead concentration in the uppermost 15 cm probably reflects elimination of lead in gasoline and other pollution controls on metals entering the environment since the 1970’s. The concentrations in the cores probably include a time lag due to transport. A remarkable observation is the occurrence of extreme and erratic barium concentrations (not shown in the figure; see next section). The pit samples are unique in capturing and preserving particulate materials since 1932. Sediments not protected in this way would have probably been stirred up repeatedly and dispersed as a result of storms. Finer particles would have been winnowed out and transported toward the deeper areas of Lake Pontchartrain.
| Figure 35A. Bathymetric
detail for location of vibracore VC98-3 in
dredged pit off New Orleans. Lithologic and chemical detail from this
core are shown in Figures 35B and 35C. Data of James Flocks, in
Manheim and others (1999).
|
(Click any image in Figure 35 for full view)
Figure 35B. X-ray CAT scan and photograph of split
vibracore VC 98-3.
|
Figure 35C. Lead concentrations in vibracore VC 98-3.
|
| back to top |
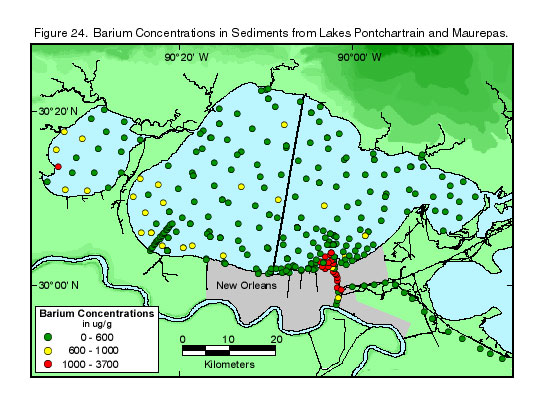
Barium concentrations greater than those expected in naturally occurring sediments have been observed in Lakes Pontchartrain and Maurepas. Barium in the sulfate form is not considered toxic. Indeed, barium sulfate "cocktails" are given to patients before undergoing intestinal X-ray examination ("GI series"). However, barium may be a significant tracer of certain waste streams. The mean concentration of 470 ug/g for Lake Pontchartrain sediments is estimated to include about 50% barium of pollutant origin (table 12). Values near the New Orleans coast can be much higher, reaching more than 4000 µg/g in cores from the dredged pit (see previous section for location of pit; see figure 24 for distribution of concentrations over entire lake).
The most likely source of barium discharge to the environment is barium sulfate used as a weighting agent for drilling mud. Evaluation of
barium distribution is complicated by several factors:
(1) Analyses based on
leaching extraction of sediments normally recover only a fraction of total
barium concentrations and cannot be compared with total dissolution values.
(2) No drillholes are known from the New Orleans coastal area, where the
largest concentrations are observed. (3) The small amounts of
barium-containing medical wastes from hospital or medical centers entering
New Orleans canals would not be expected to have significant impact on
downstream sediments. (4) Although drilling-mud suppliers are located in New Orleans, barges do not
use the New Orleans canals (C. Holmes, USGS, oral commun.,
1999). (5) Studies of the distribution of barium around drilling
platforms (Trefry, Trocine, and Proni, 1985) showed that values in excess of
1000 µg/g in sediments were normally limited to a close distance from drill
sites, and transport of sediment may disperse the very fine barite particles
with time. Noakes (this volume) did not find
large barium anomalies in surface
sediment data and underway sampling analyses around sites of Lake
Pontchartrain drill platforms. (6) Large barium anomalies have been documented in
Mississippi River sediments in the post-World War II period and could have
entered through the Bonnet Carré
Spillway (Presley and others, 1988). (7) Large and relatively uniform
barium anomalies in Lake Maurepas could not be influenced significantly by
barium from the New Orleans area or the Bonnet Carré
Spillway.
The connection to drilling mud additives is supported by several of the above factors, and the fact that enhanced barium is limited to post-World War II strata in vibracores off New Orleans (data of J. Flocks, in Manheim and others, 1999). The details of the origin of barium distributions remain uncertain. Over time, winnowing and transport may have dispersed more concentrated anomalies. L.S. Hanor suggests earlier oil exploration in the Lake Maurepas vicinity may have contributed to the barium concentrations (oral commun., Louisiana State University, Baton Rouge, LA, 1999). Mud barges presumably utilized the Intracoastal Waterway after its construction in the late 1950’s.
| back to top |
Bonnet Carré spillway opening: A review of particulate matter composition
Bottom sediments of Lakes Pontchartrain and Maurepas represent accumulations of particulate matter brought to the estuaries over time. Sediment sources include mineral particles from soils and eroded sediments from rivers, streams, and shores. They also include dust and contaminants from the air, canals, roadways (causeway), and other sources. Particulate matter also comes from biological production in the water column (plankton) and carbonate shells that are secreted by bottom organisms like Rangia clams.
Mississippi River water influx in 1997 and its effect on gross sediment influx
Recent openings of the Bonnet Carré Spillway have shed new light on the nature of particulate distributions in Lakes Pontchartrain and Maurepas. During the 1997 opening from March 17 to April 18, an estimated 153,911 ft3 of water per second flowed into Lake Pontchartrain over 31 days (oral commun., 1999, James Austin, U.S. Army Corps of Engineers, New Orleans District; Dennis Demcheck, USGS, Baton Rouge, LA). The suspended matter concentration of the river water flowing into Lake Pontchartrain was estimated at about 240 mg/L. When this suspended matter concentration is combined with total inflowing water volume over the 31 days, it yields a sediment layer of about 0.4 cm, spread over the entire Lake Pontchartrain bottom.
AVHRR satellite remote sensing data reported by Stumpf in 1998 (figs. 29 and 30) show maximum particulate matter distributions of about 100 mg/L in surface waters during March and early April. These data are considered approximations, since they did not include calibration by ground measurements. The proportion of organic matter in the seston (suspended sediment) could not be determined. The remote sensing data do agree approximately with maximum total suspended matter concentrations reported from surface water sampling stations monitored weekly by the Corps of Engineers and USGS during the flow period (see total suspended solid (TSS) data in table 13). However, data collected by the USGS (Dennis Demcheck, U.S. Geological Survey, Baton Rouge, LA, written commun., 1999) show that suspended matter at depth during the spillway opening considerably exceeded surface concentrations.
Table 13. Biological oxygen demand (BOD) and total
suspended solids (TSS) in surface water samples.
[Samples were retrieved and analyzed by
the Anacon Corporation of Houston, Texas, for the U.S. Army Corps of
Engineers, during and after the Bonnet Carré Spillway opening, March-May
1997. Data analysis from information provided by Rodney Mach, U.S. Army Corps
of Engineers, New Orleans District, written commun., 1999].
| Site No. | Location | Date (1997) | BOD fraction of SS(%) | BOD (SD) | TSS (mg/L) | TSS (SD) |
| High suspended matter |
|
|
|
|
|
|
| 1 | Miss. River inflow | 24-Mar | 1.6 |
|
110 |
|
| 2 | Bonnet Carré discharge | 25-Mar | 2.4 |
|
100 |
|
| 3 | N. of New Orleans | 14-Apr | 0.57 |
|
104 |
|
| 4 | Central Lake | 28-Apr | 1.84 |
|
146 |
|
| 5 | N. Shore, Lake Pontch. | 28-Apr | 1.78 |
|
179 |
|
| 6 | NE Lake Pontchartrain | 28-Apr | 4.1 |
|
68 |
|
| 7 | Lake Borgne | 28-Apr | 2.45 |
|
114 |
|
| Mean, high suspended matter |
|
2.11 | 0.67 | 117 | 36 | |
| High organic |
|
|
|
|
|
|
| 2 | Bonnet Carré discharge | 16-Jun | 38.9 |
|
9 |
|
| 3 | N. of New Orleans | 29-May | 42.8 |
|
7 |
|
| 3 | N. of New Orleans | 6-Jun | 126 |
|
3 |
|
| 4 | Central Lake | 16-Jun | 58 |
|
6 |
|
| 5 | N. Shore, Lake Pontch. | 4-Jun | 45 |
|
12 |
|
| 6 | NE Lake Pontchartrain | 16-Jun | 24 |
|
12 |
|
| 6 | NE Lake Pontchartrain | 14-Jul | 31 |
|
7 |
|
| 6 | NE Lake Pontchartrain | 28-Jul | 63 |
|
3 |
|
| 7 | Lake Borgne | 14-Jul | 12.8 |
|
14 |
|
| 7 | Lake Borgne | 28-Jul | 15 |
|
12 |
|
| 7 | Lake Borgne | 11-Aug | 13.8 |
|
12 |
|
| Mean, high organic matter |
|
43 | 33 | 8.8 | 3.9 | |
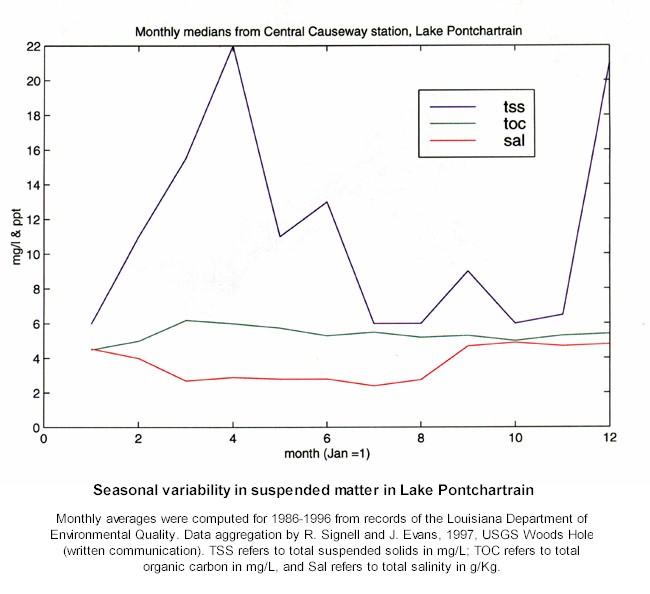
Such exceptional events as the spillway openings contribute far higher turbidities than the normal range observed through Secchi disk or other measurements that have been performed seasonally over long periods of time in Lake Pontchartrain. (Francis and others, 1994). Seasonal water measurements by the Louisiana Department of Environmental Protection (DEP) from 1986 through 1996 (fig. 36, data compiled by J. Evans and R. Signell, USGS, Woods Hole, MA, written commun., 1997) showed a consistent suspended matter "high" in the spring season, and an approximate mean of 11 mg/L.
Figure 36. Seasonal variability in suspended matter in Lake Pontchartrain.
(click for full view)
Estimates of "normal" influx of suspended matter into Lake Pontchartrain are scarce. The only estimate known to us (made by Isphording and others, 1989) is 0.76 million tons per year. The 1973 opening of the spillway was estimated to have contributed 9 times the normal yearly sediment load. The 1997 spillway influx would be 12 times the normal yearly load estimated by Isphording and others (1989). As mentioned previously, the 1997 sediment influx was dwarfed by the volumes of sediment delivered during the massive crevasse of 1874, which was reported to have delivered more than 10 times as much sediment. Thus, Mississippi River suspended matter should provide a large part of total Lake Pontchartrain sediments.
Mississippi River water and its influence on organic production
The 1997 inflowing Mississippi River waters were nutrient-rich compared to Lakes Pontchartrain and Maurepas waters. Mixing with saline water, the river water nutrients contributed to a massive plankton bloom which, upon death of the organisms, settled to the bottom. The decaying organic matter consumed available oxygen and led to temporary destruction of bottom organisms in large areas of Lake Pontchartrain (see Abadie and others, 1998; Baird, 1998; and Dortch and others, 1998, in Basics of the Basin Symposia, Lopez, this volume).
Figure 37 shows selected analyses of water recorded in eight samplings at the Mississippi River inflow entrance to the Bonnet Carré Spillway over a period from March 17 to May 7, 1997. Nitrate, a key nutrient, maintained an approximate 1 mg/L level in the inflowing Mississippi River water. The 1 mg/L nitrate levels are 20 times the range that has been typical for Lake Pontchartrain water analyses routinely performed by the Louisiana Department of Environmental Quality. This level of nitrate is in reasonable agreement with the 1.4 mg/L estimated by Antweiler and others (1995) for water of the lower reaches of the Mississippi during 1982-92. Comparable sharp increases in nitrate concentration were reported by the USGS during a more limited experimental opening of the spillway in 1994 (Demcheck and others, 1996).
Figure 37. Water quality data, Mississippi
River Station.
TKN, total Kjeldahl (organic) nitrogen; Tot P, total
phosphorus; NO3-N, nitrate.
At BCS # 3 site on the Causeway 3.9 mi north of New Orleans, one can see chloride values drop more than one-hundredfold from 2,300 mg/L Cl on March 17, to river-water values of about 20 mg/L by March 31. At the same time nitrate values increase more than twentyfold to 1 mg/L. Chlorides increased sharply after April 20, 1997, but had not regained full pre-existing chlorinity values by mid-June, three months after the closure of the spillway.
The major plankton bloom was reported by observers to have begun in middle to late May 1997. One can note its onset by the steep drop in total phosphate and sharp declines in nitrate after May 20 (fig. 38). The decline in nitrate reached a low point in the samplings on June 17 in Station 3, at the causeway north of New Orleans.
Figure 38. Water quality data, north of New
Orleans.
TKN, total Kjeldahl (organic) nitrogen; Tot P, total
phosphorus; NO3-N, nitrate.
During the whole 6-month observation series, total Kjeldahl (organic) nitrogen remained in the same fluctuation range, whereas total phosphate showed modest declines in concentration. Orthophosphate analyses (soluble inorganic phosphate more readily assailable by plankton) were not included in the USACE data set.
At sites more distant from the spillway, such as off the north shore, mixing proceeded more gradually (fig. 39). A low chlorinity of about 100 mg/L Cl was reached on June 29. Nitrate reached a high just under 1 mg/L on April 10 and declined more slowly to 0.03 on July 28. The fresh water extended into western Lake Borgne, which recorded a low of 98 mg/L Cl (along with 1.08 mg/L nitrate) on April 22, 1997 before increasing to 4,500 mg/L Cl in August 1997.
Figure 39. Water quality data, north shore of Lake
Pontchartrain.
TKN, total Kjeldahl (organic) nitrogen; Tot P, total
phosphorus; NO3-N, nitrate.
Detrital sediments versus organic matter; what is their proportion in Lake Pontchartrain?
The monthly average of water parameters from LDEQ surveys from January 1986 through December 1996 (Fig. 36) demonstrates a large seasonal peak for total suspended matter in spring and a relatively constant total organic carbon value at about 5 mg/L. Comparable increases in suspended matter in the spring are reported for most reaches of the Mississippi River (Meade, 1995). Total organic carbon (TOC) varies relatively little during the year, with 3 to 4 mg/L attributable to dissolved organic matter (Leenher, Noyes, and Grown, 1995; Leenher, Barber, and others, 1995; Demcheck and others, 1996). This leaves about 1.5 mg/L particulate organic carbon in total organic matter. Normal summer values for particulate matter can reach low values (1-3 mg/L) in Lake Pontchartrain. In summary, when total suspended matter exceeds about 6 to 10 mg/L, it is most likely composed largely of inorganic (silt and clay) detritus.
A more specific approach to assessing particulate composition during 1997 is shown in table 13. The table shows biologic oxygen demand (BOD) as a percentage of total suspended solids in USACE water analyses during and after the spillway opening. Biological oxygen demand refers to biologically oxidizable matter, a considerable part of which may be particulate organic matter. Therefore, BOD is likely to be a better measure of organic (especially bloom-related) particulates under the given conditions in Lake Pontchartrain than TOC, which normally is dominated by dissolved carbon. One can see that BOD makes up a mean of only about 2% of the turbid plume that sequentially entered Lake Pontchartrain from March 17 through April 28. The "organic-rich" sediment believed to be associated with the plankton bloom refers to the highest organic matter values for each analysis station. These data average more than 40% BOD as a percentage of total suspended matter and show a progressive appearance from late May through late July with increasing distance from the spillway.
The observations of less turbid areas around the periphery of the lake under most conditions might seem at first to conflict with the studies of Signell and others (this volume). Their model indicated maximum current velocities around the peripheries of the lake, where one therefore might expect the greatest turbidity. Examination of the Secchi disk data of Stern and Atwell (1968) shows that, in fact, lower turbidities are observed around the lake’s peripheries than in the more central part of the lake. The satellite seston anomalies are likewise generally localized in the form of bull's-eyes in the deeper parts of both Lakes Pontchartrain and Maurepas. We conclude that these turbidity distributions are probably due to resuspension of fine detrital bottom sediment in deeper areas, even though currents are modeled to be weaker here. We might explain these distributions in the light of sediment texture in bottom sediments. As shown in figure 12, fine sediments accumulate in the central part of the lake. Sand-size sediment dominates in the northern and eastern reaches, and to a lesser extent, near the Bonnet Carré outlet. Currents probably winnow out the finest fractions from the peripheral areas and transport them to the center.
The algal blooms from June to July 1997 are difficult to discern from the available AVHRR satellite imagery (see Algal blooms in Stumpf, this volume). The explanation is twofold. First, the total particulate organic matter interpreted from the water analyses does not approach the seston estimates from remote sensing surveys. Second, planktonic organic matter may have a relatively low index of refraction and, thus, may not reflect radiation effectively. At times, plankton have been known to even yield a negative index (absorption), as may have been the case with the "pea soup"-like mats in the lake at the height of the bloom (see authors shown in Lopez (this volume), discussing 1997 conditions).
| back to top |
Comparison of bulk-sediment analyses with underway sampling data
A detailed survey of Lake Pontchartrain sediments was undertaken by a team from the Center for Applied Isotope Studies at the University of Georgia. Nearly 800 samples were obtained using an underway sampling technique, followed up by shipboard processing and analysis of wafers of sediment deposited on filter paper by X-ray fluorescence (Noakes, this volume). This analysis offered a synoptic view of the chemical composition of major and trace elements in surficial sediments on a gridded pattern over the lake in remarkably short time.
As pointed out by Noakes, the data set cannot be directly compared with bulk sediment analyses because the analyses are made on a fine fraction of sediment samples that are sucked into a vacuum cleaner- type of recovery hose lowered to the bottom. Sources of variation in this rapid field method, including corrections for the thickness of "wafers" of sediment analyzed on filter paper, and variability in excitation of pressed sediment powder, engender analytical uncertainty greater than that which would be accepted for bulk sediment analyses (that is, quality-controlled data in the currently compiled database).
With due allowance for these factors, the underway data are generally within expected range for middle-concentration trace metals like Cu, Pb, and Zn (given an enhancement factor due to the fine fraction). They confirm the absence of significant concentrations of potentially toxic metals except for the area close to the New Orleans shoreline for the above elements. They also confirm the anomalous concentrations of barium near the New Orleans shoreline found in bulk sediment analyses. The origin of barium concentrations many times the concentration in naturally occuring fine-grained sediments is considered further in the section Barium Anomolies in Sediments.
| back to top |
Leachate versus total dissolution methods
As noted in Inorganic Chemistry, the kind of metal recovery system used for metal analysis has a variable effect on the reported results, though the relative differences decrease in more contaminated sediments. Both leachate and total recovery analyses, consistently performed, have specific advantages and disadvantages.
Leachate results recover less "detrital", or mineral-associated metal, but their recovery will vary with the specific method and type of sediment. The compiled Lake Pontchartrain analyses offer a special opportunity to compare quality-controlled data on common sediment systems that have used alternative analytical methodologies.
Figure 40. Metals in leachate analyses of sediments as a fraction of total metal content.
Figure 40 shows the proportion of metals recovered by well-standardized leachate methods for an adjusted composite of Lake Pontchartrain sediments, as a percentage of mean sediments determined by total dissolution methods. The data show that leachate means ranged from 8 to 87 percent of total dissolution means for trace metals. If leachate data of Demcheck and others (1996) are compared with the total dissolution data from table 9, one can obtain similar fractions for aluminum and iron of 36.5 and 76.3 percent, respectively.
The only metal whose apparent toxicity levels might be affected by questions of methodology is chromium (Cr). Chromium is present in relatively large quantities in clay minerals belonging to the smectite, illite, or chlorite groups. This kind of Cr is highly insoluble and inert. Total dissolution analyses for Lake Pontchartrain yield Cr concentrations that extend into potentially toxic levels -- where those levels reflect "leachable" Cr. The yellow dots ("low-level toxicity") in the more centrally located sediments in Lakes Pontchartrain and Maurepas (figure 21) refer to total Cr analyses. These values most likely reflect tightly bound Cr in detrital sediments rather than pollutant-related metal. This conclusion is supported by the fact that leachate values are low, and elevated Cr values are not particularly noted in the vicinity of the New Orleans coastline (fig. 21), where pollutant presence is most likely.
Total dissolution results lend themselves to normalization techniques and comparison between sediments from different areas. These properties are utilized in the next section to estimate the proportion of metals of pollutant origin in the surficial sediments.
| back to top |
Future study needs and opportunities
The available chemical data described in this report provide considerable information about the distribution and concentration of contaminants in the Lake Pontchartrain Basin. Most of the samples in the current historical database have been taken by grab samplers from surficial sediments. These data define the spatial distribution of contaminants and constrain problem areas. The recent coring studies described herein have revealed that the history of local contaminant discharge is well recorded by layer-by-layer analyses of trace metals or other contaminants.
As suggested in this report, the current Pontchartrain Basin chemical data have features in common with Mississippi River Delta sediments. The data in the current database include samples in the Mississippi River and the Gulf of Mexico proper that were analyzed by common methodologies. These data should be exploited to develop regional comparisons and may lend themselves to interpretive extension to water-quality and ecosystem problems in the lower Mississippi River. A special opportunity in this connection is to match areas where regularly monitored ambient water quality data (including suspended matter) and surficial sediment chemistry data are available. By establishing links between water quality data and sediment layers corresponding to periods of time, one may be able to expand the use of sediment analysis to gain indirect information about past water quality conditions in areas where no historical water quality data exist.
The data of Flocks (Manheim and others, 1999) included in the previous section show that lithologic and trace element data in cores can sensitively distinguish dredged from undredged areas in Lake Pontchartrain. Extended coring analysis studies may also reveal the extent of special contaminant episodes near Bayou Bonfouca and provide predictive value for the impact of future problems.
| Forward to Conclusions
|
|
Table of Contents: Sediment Database and Geochemical Assessment |
|