

Annual grass invasion is transforming the sagebrush biome’s songbird communities
Links
- More information: Publisher Index Page (via DOI)
- Document: XML
- Open Access Version: USGS Accepted Manuscript
- Download citation as: RIS | Dublin Core
Introduction
One of the greatest challenges facing land managers and conservation practitioners today is ecological transformation, a process that occurs when turnover in biological communities precipitates substantial and persistent shifts in multiple ecological characteristics. Although ecological transformations can be further categorized (e.g., as state changes, type conversions, regime shifts, or novel ecosystems), a commonality is that they involve high turnover in biological communities, which results in increasingly novel functioning and service provisioning (Crausbay et al. 2022). These changes affect biodiversity and human well-being, necessitating adaptation in management goals and techniques (Radeloff et al. 2015). A growing body of work seeks to develop strategies for managing and responding to transforming ecosystems (Crausbay et al. 2022). A central tenet of this work is that effective management of transformations requires anticipation of the ways in which they alter biodiversity, ecosystem services, and cultural values (Crausbay et al. 2022).
Diverse terrestrial ecosystems have experienced shifts in their dominant vegetation, driven by such factors as climate change, shifting disturbance regimes, species invasions, and interactions between these processes (Guiterman et al. 2022). Examples include woody encroachment into the prairies of the North American Great Plains, shifts from woody to herbaceous vegetation in Mediterranean ecosystems, and forest-to-shrubland conversion following wildfires in the US Southwest (D’Antonio and Vitousek 1992; Crausbay et al. 2022; Guiterman et al. 2022). Wildlife–habitat research suggests that these shifts in vegetation communities will drive concomitant shifts in wildlife communities. Yet wildlife have not been fully integrated into the modern ecological transformation paradigm, and it remains unclear which members or aspects of wildlife communities should be expected to shift in transforming systems. Indeed, understanding transformations’ consequences will be challenged by slow demographic rates in wildlife (relative to vegetation), which can delay turnover and create extinction debts (Hillebrand et al. 2018; Crausbay et al. 2022). When coupled with the arrival of novel species exploiting new resources in transforming ecosystems, the resultant transient increases in species occurrence and richness can obscure the effects of transformation on biodiversity (Hillebrand et al. 2018). To understand how transformation of vegetation communities scales up to impact wildlife communities, it is therefore key to identify sensitive quantitative approaches and early warning indicators that capture growing novelty (i.e., dissimilarity relative to a baseline driven by departures from historical processes; Radeloff et al. 2015) in wildlife communities.
Accurately evaluating the response of wildlife communities to vegetation transformation is critical to understanding and managing transforming ecosystems. Animals perform important functional roles like seed dispersal, pollination, grazing, and predation. Shifts in animal communities can alter these functions, generating feedbacks that exacerbate or stabilize transformation of vegetation communities (Radeloff et al. 2015; Fricke et al. 2022). Thus, wildlife communities are not only affected by vegetation shifts but can also alter the trajectories of vegetation communities. This fact motivates the study of wildlife community change as a starting point for understanding function-mediated feedbacks in the context of ecological transformations.
Songbirds (order Passeriformes) are a common barometer for ecological change because they are diverse (~60% of all bird species globally are songbirds), provide important ecosystem services (e.g., pest control and seed dispersal; Whelan et al. 2015), are highly detectable, and are sensitive to environmental change (Clavel et al. 2011). Songbird communities are taxonomically and functionally reorganized by global change, with generalists commonly replacing specialists in altered habitats (Clavel et al. 2011). Thus, songbirds are an ideal group for (i) integrating animals into transformation science, (ii) testing hypotheses about how communities respond to transformation and whether such responses are prone to lags and transient dynamics, and (iii) identifying quantitative approaches that provide early warning indicators of wildlife community reorganization.
Here, we evaluated support for the hypothesis that ecological transformation restructures wildlife communities by favoring widely distributed generalists over narrowly distributed specialists, but that extinction debts obscure such effects if researchers use occurrence or richness to quantify community change. In particular, we studied songbirds within western North America’s vast sagebrush biome (Figure 1), where annual grass invasion is rapidly restructuring vegetation communities (Rottler et al. 2015). We predicted that annual grass invasion is also driving compositional turnover in songbird communities, with declines in sagebrush endemics and shrubland nesters, and concomitant increases in widespread grassland and generalist bird species. Yet, because the former—sagebrush endemics and shrubland nesters—are lost slowly (owing to extinction debts) and the latter—widespread grassland and generalist bird species—are added from a larger regional species pool, we also predicted that species occurrence and richness alone would not fully reflect community reorganization. Although recent research has aimed to quantify the effects of grass invasion on certain sagebrush-specialist songbirds (Kumar et al. 2024), a regional, community-wide evaluation of such consequences—which could support conservation and serve as a template for applying similar approaches to other wildlife communities—remains lacking (Rottler et al. 2015).
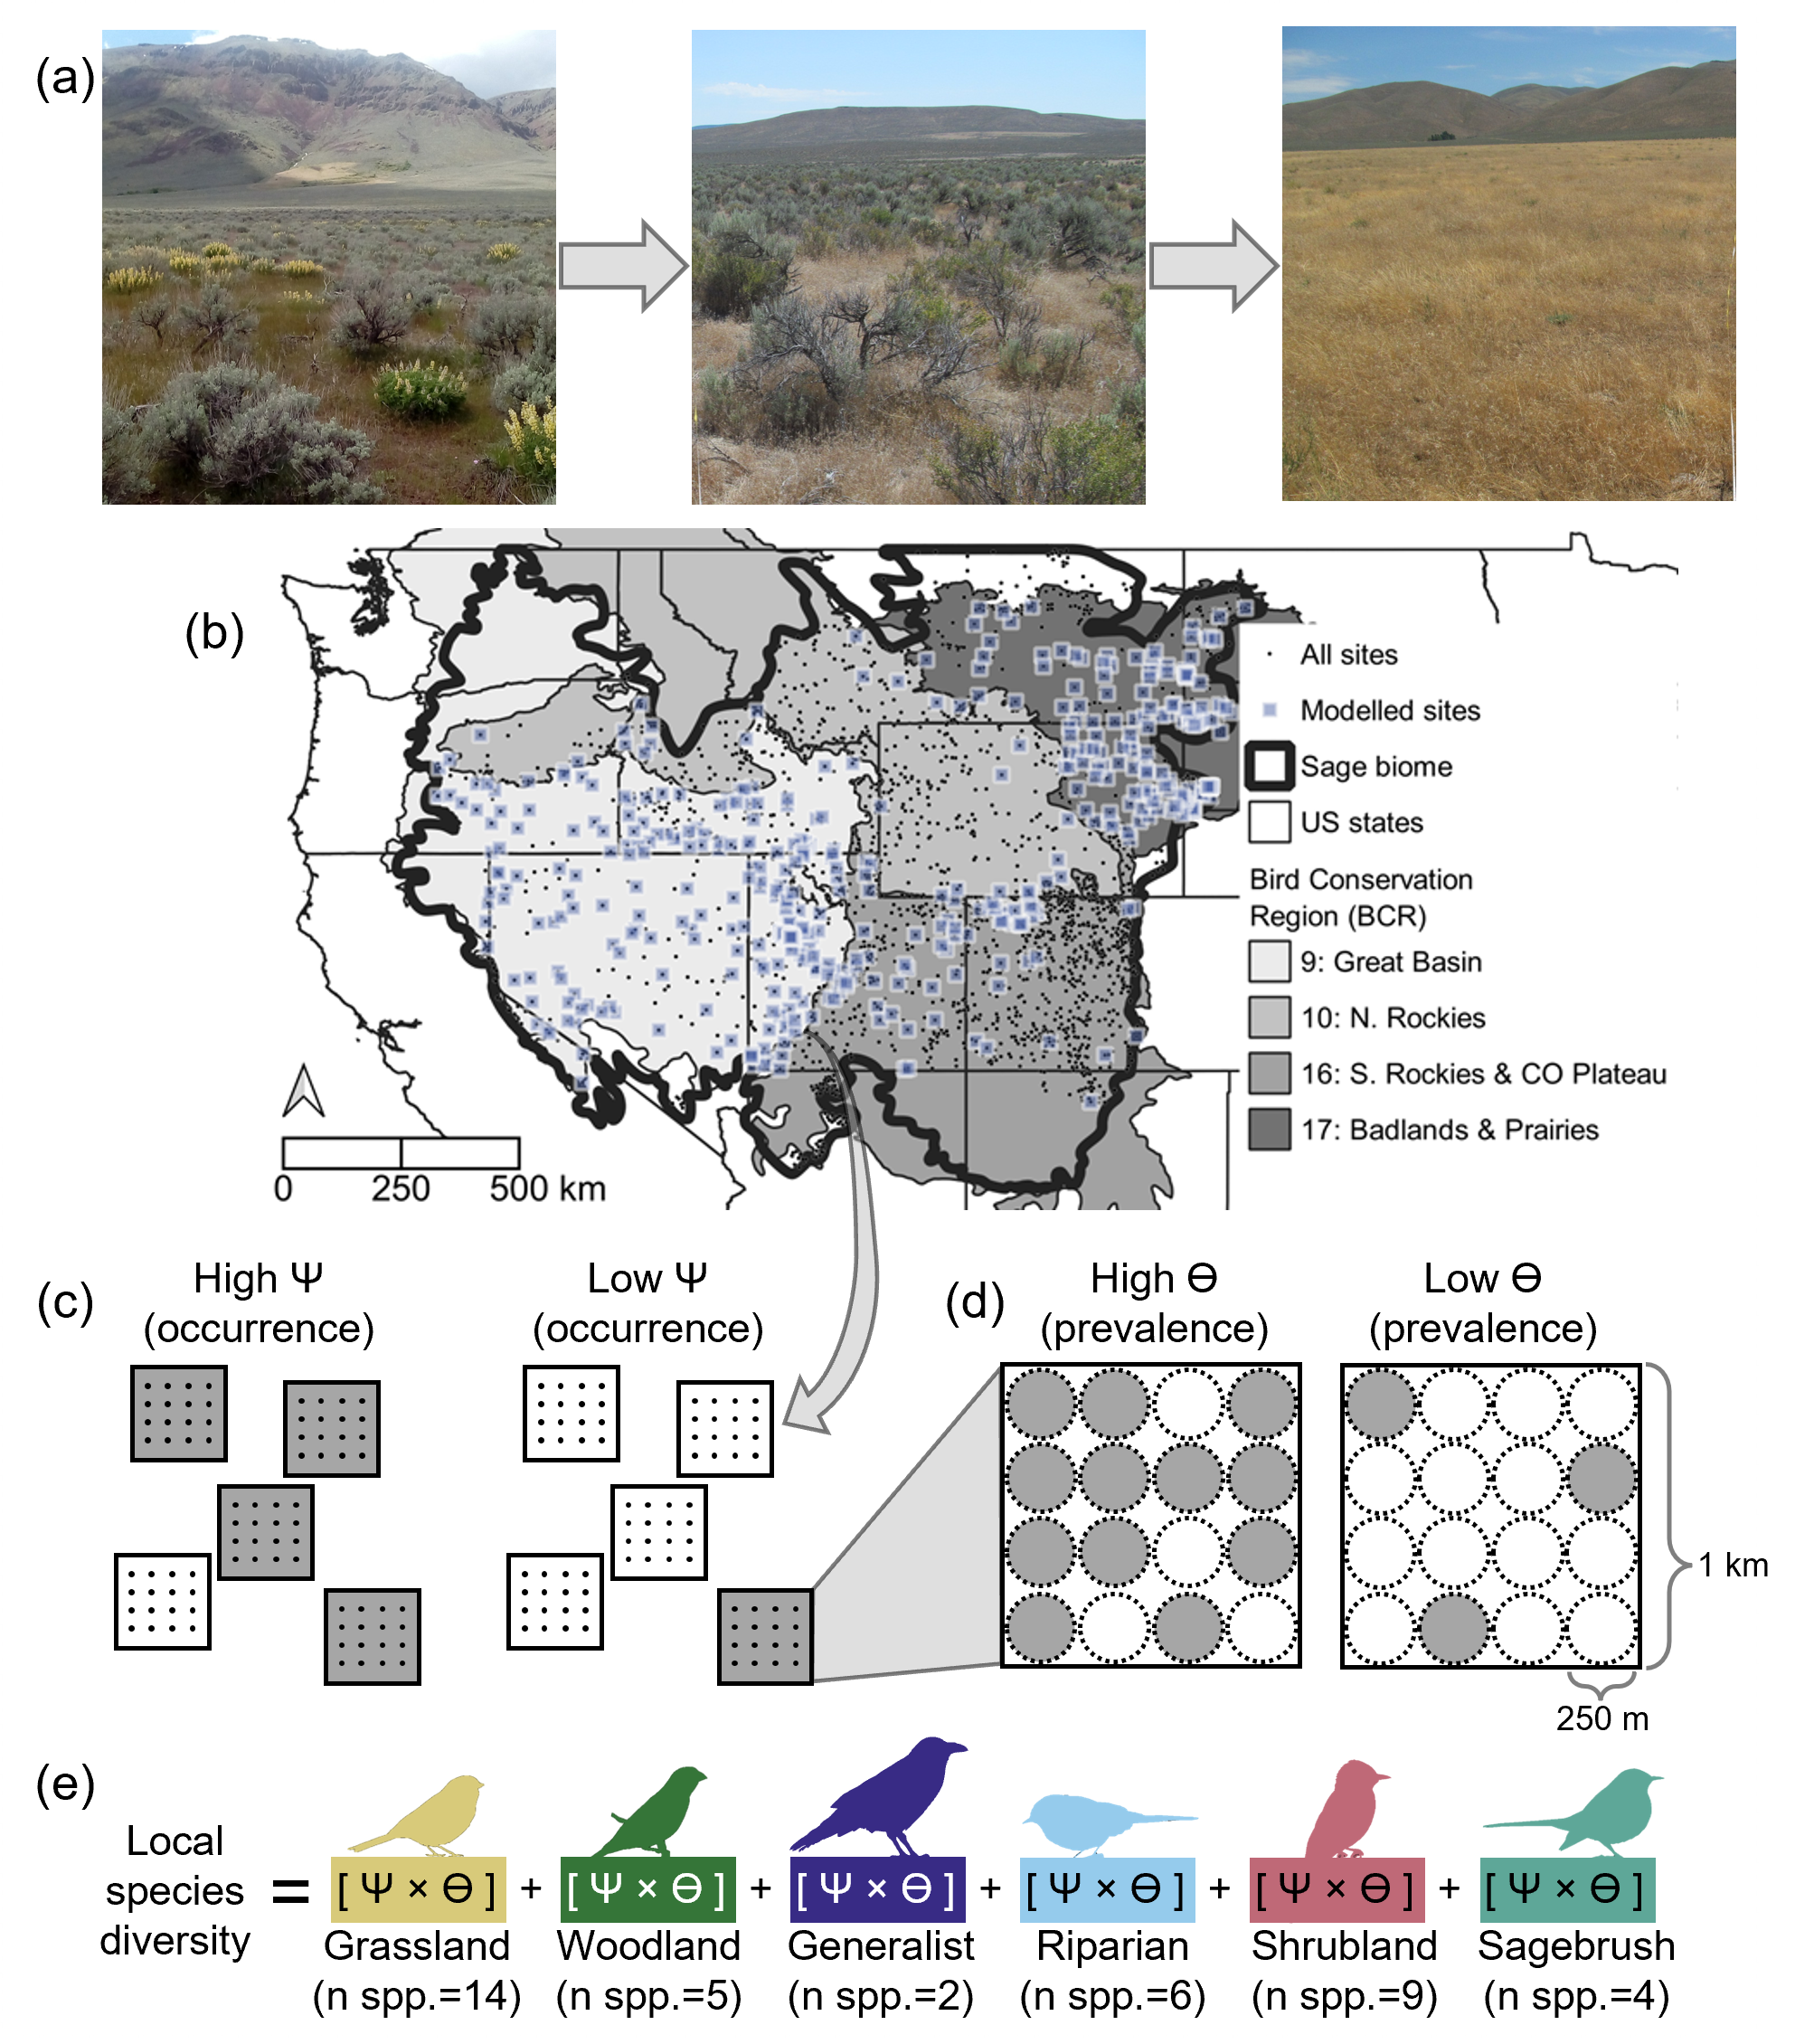
(a) The dramatic transformation of sagebrush-steppe to invasive annual grasslands (from left to right) motivated our study of how this transformation affects songbird communities. (b) From a biome-wide pool of survey sites across four major Bird Conservation Regions in the western US, we used matching to retain pairs of sites that differed in invasion status but were otherwise similar (black circles enclosed within blue squares) and discard sites without such matches (black circles without blue squares). Using multispecies occupancy models, we estimated the site-level (c) occurrence and (d) prevalence where present (an index of abundance) for 40 different songbird species. (e) Occurrence and prevalence were combined to estimate guild-level diversity. Image credits: (a) Adam Mahood (all three photos) and (e) Phylopic (all six icons: CC0 1.0 Universal).
Methods
Study system
Within the American West, the sagebrush biome is expansive, spanning >900,000 km2 and encompassing portions of 13 US states (Figure 1a; Doherty et al. 2022; Boyd et al. 2024). The biome is characterized by sagebrush-steppe—semiarid ecosystems dominated by sagebrush shrubs (Artemisia spp) and interspersed with other shrubs and perennial grasses. Vegetation communities vary strongly along elevational gradients, driven primarily by bioavailable water (which itself is a function of precipitation, temperature, and topography; Knick et al. 2005).
Although vast, the sagebrush biome is under threat: more than one-half of sagebrush-steppe has been lost since European colonization (Davies et al. 2011; Rottler et al. 2015; Boyd et al. 2024) and almost one-third of the region’s remaining intact sagebrush habitat was lost between 2000 and 2021 (Mozelewski et al. 2024). Anthropogenic development (housing, agriculture, and energy) has contributed to such declines, but the greatest contemporary threat is ecological transformation resulting from grass invasion, which has driven ~70% of sagebrush ecosystem degradation since 2000 (Doherty et al. 2024). Annual grasses such as cheatgrass (Bromus tectorum) can replace native flora via competition for water and space (Germino et al. 2016), often capitalizing on and benefiting from anthropogenic disturbances like grazing (Smith et al. 2023). Invasive grasses can also impact fire regimes by adding fuels that increase fire frequency, which further favors annual grass dominance owing to their ability to establish quickly post-fire (D’Antonio and Vitousek 1992). Given feedbacks among disturbance, fire, and grass invasion, we considered annual grass cover as a single indicator of transformation, rather than trying to parse out fire and disturbance effects separately (Appendix S1: Panel S1).
Transformation to annual grasslands almost certainly threatens the ~170 vertebrate species that rely on sagebrush-steppe, but existing research is spatially and/or taxonomically limited (Rottler et al. 2015). We aimed to understand the effects of annual grass invasions on a community of 40 passerine species (which we refer to as “songbirds” for brevity, although five tyrannid flycatchers included in the analysis were not strictly “songbirds”). These particular species (Appendix S1: Figure S1) were selected based on their (i) occurrence in bird surveys in the sagebrush biome (see below) and (ii) documented nesting in sagebrush-steppe and/or adjacent shrubland, grassland, and riparian habitats. Surveys during their breeding season enabled inference about breeding habitats because songbirds have relatively small home ranges (typically <0.1 km2; Wiens et al. 1985). We grouped species into six mutually exclusive, nesting habitat–based guilds: sagebrush, shrubland, riparian, generalist, woodland, and grassland.
Data compilation
We leveraged bird surveys conducted by the Integrated Monitoring in Bird Conservation Regions (IMBCR) program (Pavlacky et al. 2017). Surveys occurred across landownerships within randomly selected 1-km2 grid cells (hereafter, “sites”), such that IMBCR data did not experience common biases (e.g., road bias). Within each site, surveyors annually conducted 6-minute audiovisual surveys at up to sixteen 5-ha plots (hereafter, “plots”; Figure 1, c and d). We analyzed plot-level detection data for all 40 songbird species from 2010 to 2021, although not all sites were surveyed every year. In total, we analyzed 57,936 observations of the 40 songbird species detected during 22,759 IMBCR surveys conducted in 7,072 plots nested within 504 sites across the sagebrush biome within the US (Figure 1b).
Using existing environmental data products, we compiled background information for each site. We estimated cover by annual grasses (yearly) using the annual forb and grass (AFG) cover class in the Rangeland Analysis Platform (RAP; https://rangelands.app) (Allred et al. 2021). Although such satellite-derived products contain known error in cover estimates, RAP’s AFG estimates contain lower error than that of similar remotely sensed products, and such error is highly unpredictable, suggesting it is “noise” that tends to attenuate effect sizes toward zero rather than introduce inflating biases (Applestein and Germino 2022). We used summer vapor pressure deficit (VPD; yearly) to capture ecologically relevant aridity because (i) it was highly correlated (r > 0.7) with both temperature and precipitation in our dataset; (ii) it is an important predictor of productivity in aridland systems; and (iii) it lies along the same causal pathway as temperature and precipitation, and so its inclusion should control for these other variables (Zhong et al. 2023). We also gathered site-level data for elevation, human modification (HM), latitude, and longitude (see Appendix S1: Panel S1 for details).
We aimed to estimate the overall, causal effect of annual grass cover (as a continuous indicator of transformation) on songbird communities; however, causal inference with observational data is challenged by confounding variables that affect invasion and songbirds simultaneously, biasing naïve statistical estimates (Schleicher et al. 2020). We therefore leveraged extensive additional environmental data to perform “pre-regression matching”, a tool for causal inference used to identify sites that differ in invasion status but which are otherwise similar (see Appendix S1: Panel S1 for details and comparison of modeling results in the absence of matching). Using such tools is likely critical to understanding the costs of transformations, given that (i) transformation occurs nonrandomly with respect to many ecological variables and (ii) transformation at relevant scales is typically studied using observational data.
Data analysis
To estimate the effect of annual grasses on songbird communities while controlling for imperfect detection and important covariates, we applied the Bayesian multiscale community occupancy model described by Pavlacky et al. (2022). Using detection/non-detection data, this model derived two important parameters for each species: ψ, the probability of occupying a 1-km2 site, and ϴ, the proportion of (up to) sixteen 5-ha plots within a site occupied, conditional on site occupancy (Figure 1, c and d). We refer to ψ as “occurrence” and ϴ as “prevalence”. Estimating ψ and ϴ separately allowed us to ask how grass invasion affected each bird species’ broad distribution (ψ) versus its local commonness (ϴ; an index of abundance)—two ecologically relevant parameters affected by unique ecological processes (i.e., range expansion versus shifting abundance) (see Packlacky et al. [2022] for a full description of the model). We specified ψ and ϴ as a function of annual grass cover, VPD, HM, and elevation, and ψ was additionally a function of latitude and longitude. We did not include covariates for variables that are affected by invasion and thus mediate its effect (e.g., shrub cover or fire), as doing so would detract from our ability to quantify the total effect of invasion.
For analysis, we aggregated species-level parameter estimates to the guild-level: for instance, ψ for the sagebrush guild was the mean ψ for all species in that guild. For each guild, we evaluated how ψ and ϴ varied as a function of annual grass cover, while holding all other covariates at their mean. We also derived local diversity (within 5-ha plots) for each guild by calculating species-wise ψ × ϴ, then summing that product across all species within each guild (Figure 1e). Local diversity thus accounted for each species’ presence and commonness, producing a metric more sensitive to the consequences of transformation than alternatives relying only on occurrence (e.g., if we had calculated diversity at the 1-km2 site scale).
Finally, we used model estimates to predict diversity across the biome. Within a biome-wide grid of 16-km2 cells, we summarized covariates, masked cells with covariate values outside the range of values in our model, predicted species-wise ψ × ϴ, and mapped the diversity of species that were negatively affected by invasion—that is, species for which the mean effect of annual grasses on ψ and ϴ was significantly negative (Appendix S1: Figure S1). We then intersected this predicted surface with independent “resistance and resilience” (R&R) data created by Chambers et al. (2017), which identifies areas more (low R&R) or less (high R&R) likely to undergo transformation. This intersection provides an evaluation of songbird risk across the biome. All code and data used in this analysis are available online (Hobart 2024).
Results
Of the 40 songbird species, 12 were negatively affected by (i.e., “sensitive to”) annual grasses: two sagebrush species, five shrubland species, three riparian species, and two grassland species (Appendix S1: Figure S1). The prevalence (ϴ or commonness) of sagebrush, shrubland, and riparian songbirds was negatively affected by annual grasses (Figure 2a). Conversely, the occurrence (ψ) of grassland and generalist songbirds was increased by increasing annual grass cover.
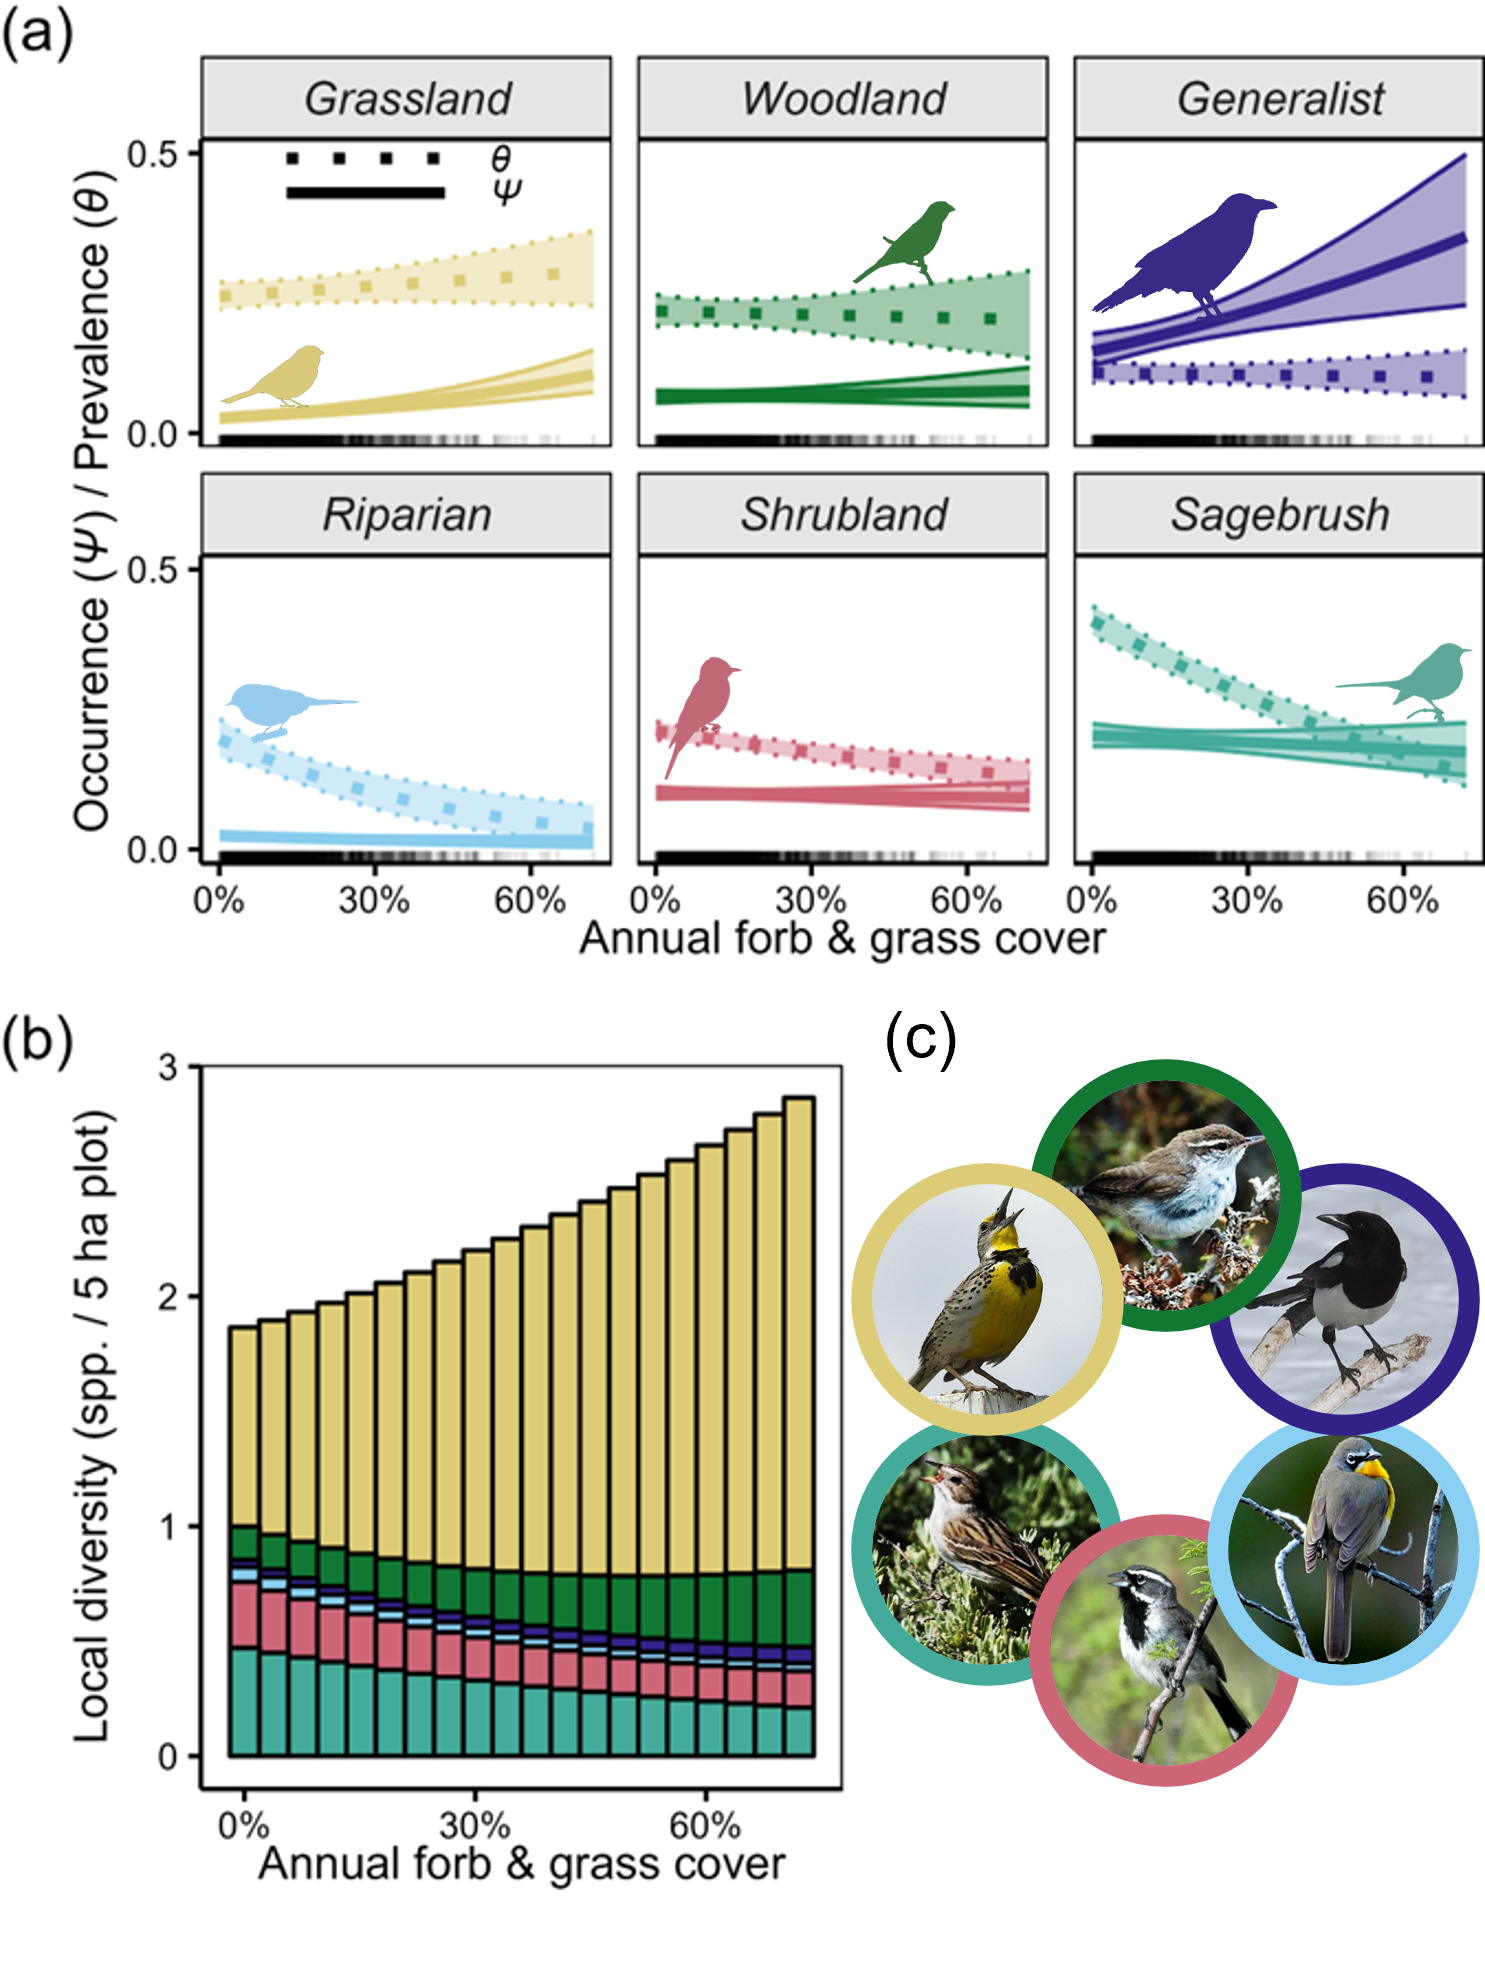
(a) Effects of annual grasses on songbird prevalence (ϴ) and occurrence (ψ) varied among the six avian guilds. Error ribbons depict 90% credible intervals incorporating uncertainty in intercepts and slopes. Rugs (ticks along the x axis) depict site-level annual grass values. All other covariates were held at their means. Appendix S1: Figure S2 contains results for the other covariates; Appendix S1: Figure S3 depicts raw data. (b) Annual grasses drove shifts in community composition; predicted community dissimilarity rose by ~50% across this invasion gradient (Appendix S1: Figure S2). (c) Guild representatives, starting at the top and moving clockwise: Bewick’s wren (woodland; Thryomanes bewickii), black-billed magpie (generalist; Pica hudsonia), yellow-breasted chat (riparian; Icteria virens), black-throated sparrow (shrubland; Amphispiza bilineata), Brewer’s sparrow (sagebrush; Spizella breweri), and western meadowlark (grassland; Sturnella neglecta). Image credits: (a) Phylopic (all six icons: CC0 1.0 Universal) and (c) Bill Schmoker (all six photos).
We found evidence of songbird community compositional shifts along the gradient of annual grass cover. Although annual grass cover increased local community-level diversity, it also drove turnover owing to differential responses among species and guilds to annual grass cover (Figure 2b). In particular, we found notable declines in sagebrush and shrubland songbird diversity with rising annual grass cover, while grassland and woodland species diversity increased along this gradient (Figure 2b). These patterns were consistent across regions (Appendix S1: Figure S2).
Predicting and mapping biome-wide songbird communities revealed several regions with moderate-to-high diversity of sensitive species (i.e., those that were negatively affected by transformation; Figure 3c). Roughly 44% of all predicted communities had moderate diversity of sensitive species (green in Figure 3c), and these were relatively evenly distributed across invasion resistance classes: 28% in areas likely to be invaded and transform (middle red shade in Figure 3d), 35% in areas relatively unlikely to transform (middle blue shade in Figure 3d), and 35% in areas with intermediate likelihood of transformation (middle green shade in Figure 3d). By contrast, only 5% of all predicted communities had high diversity of sensitive species (blue and purple in Figure 3c), and 96% of these communities occurred in areas unlikely to transform (i.e., highly resistant to invasion) (dark blue in Figure 3d).
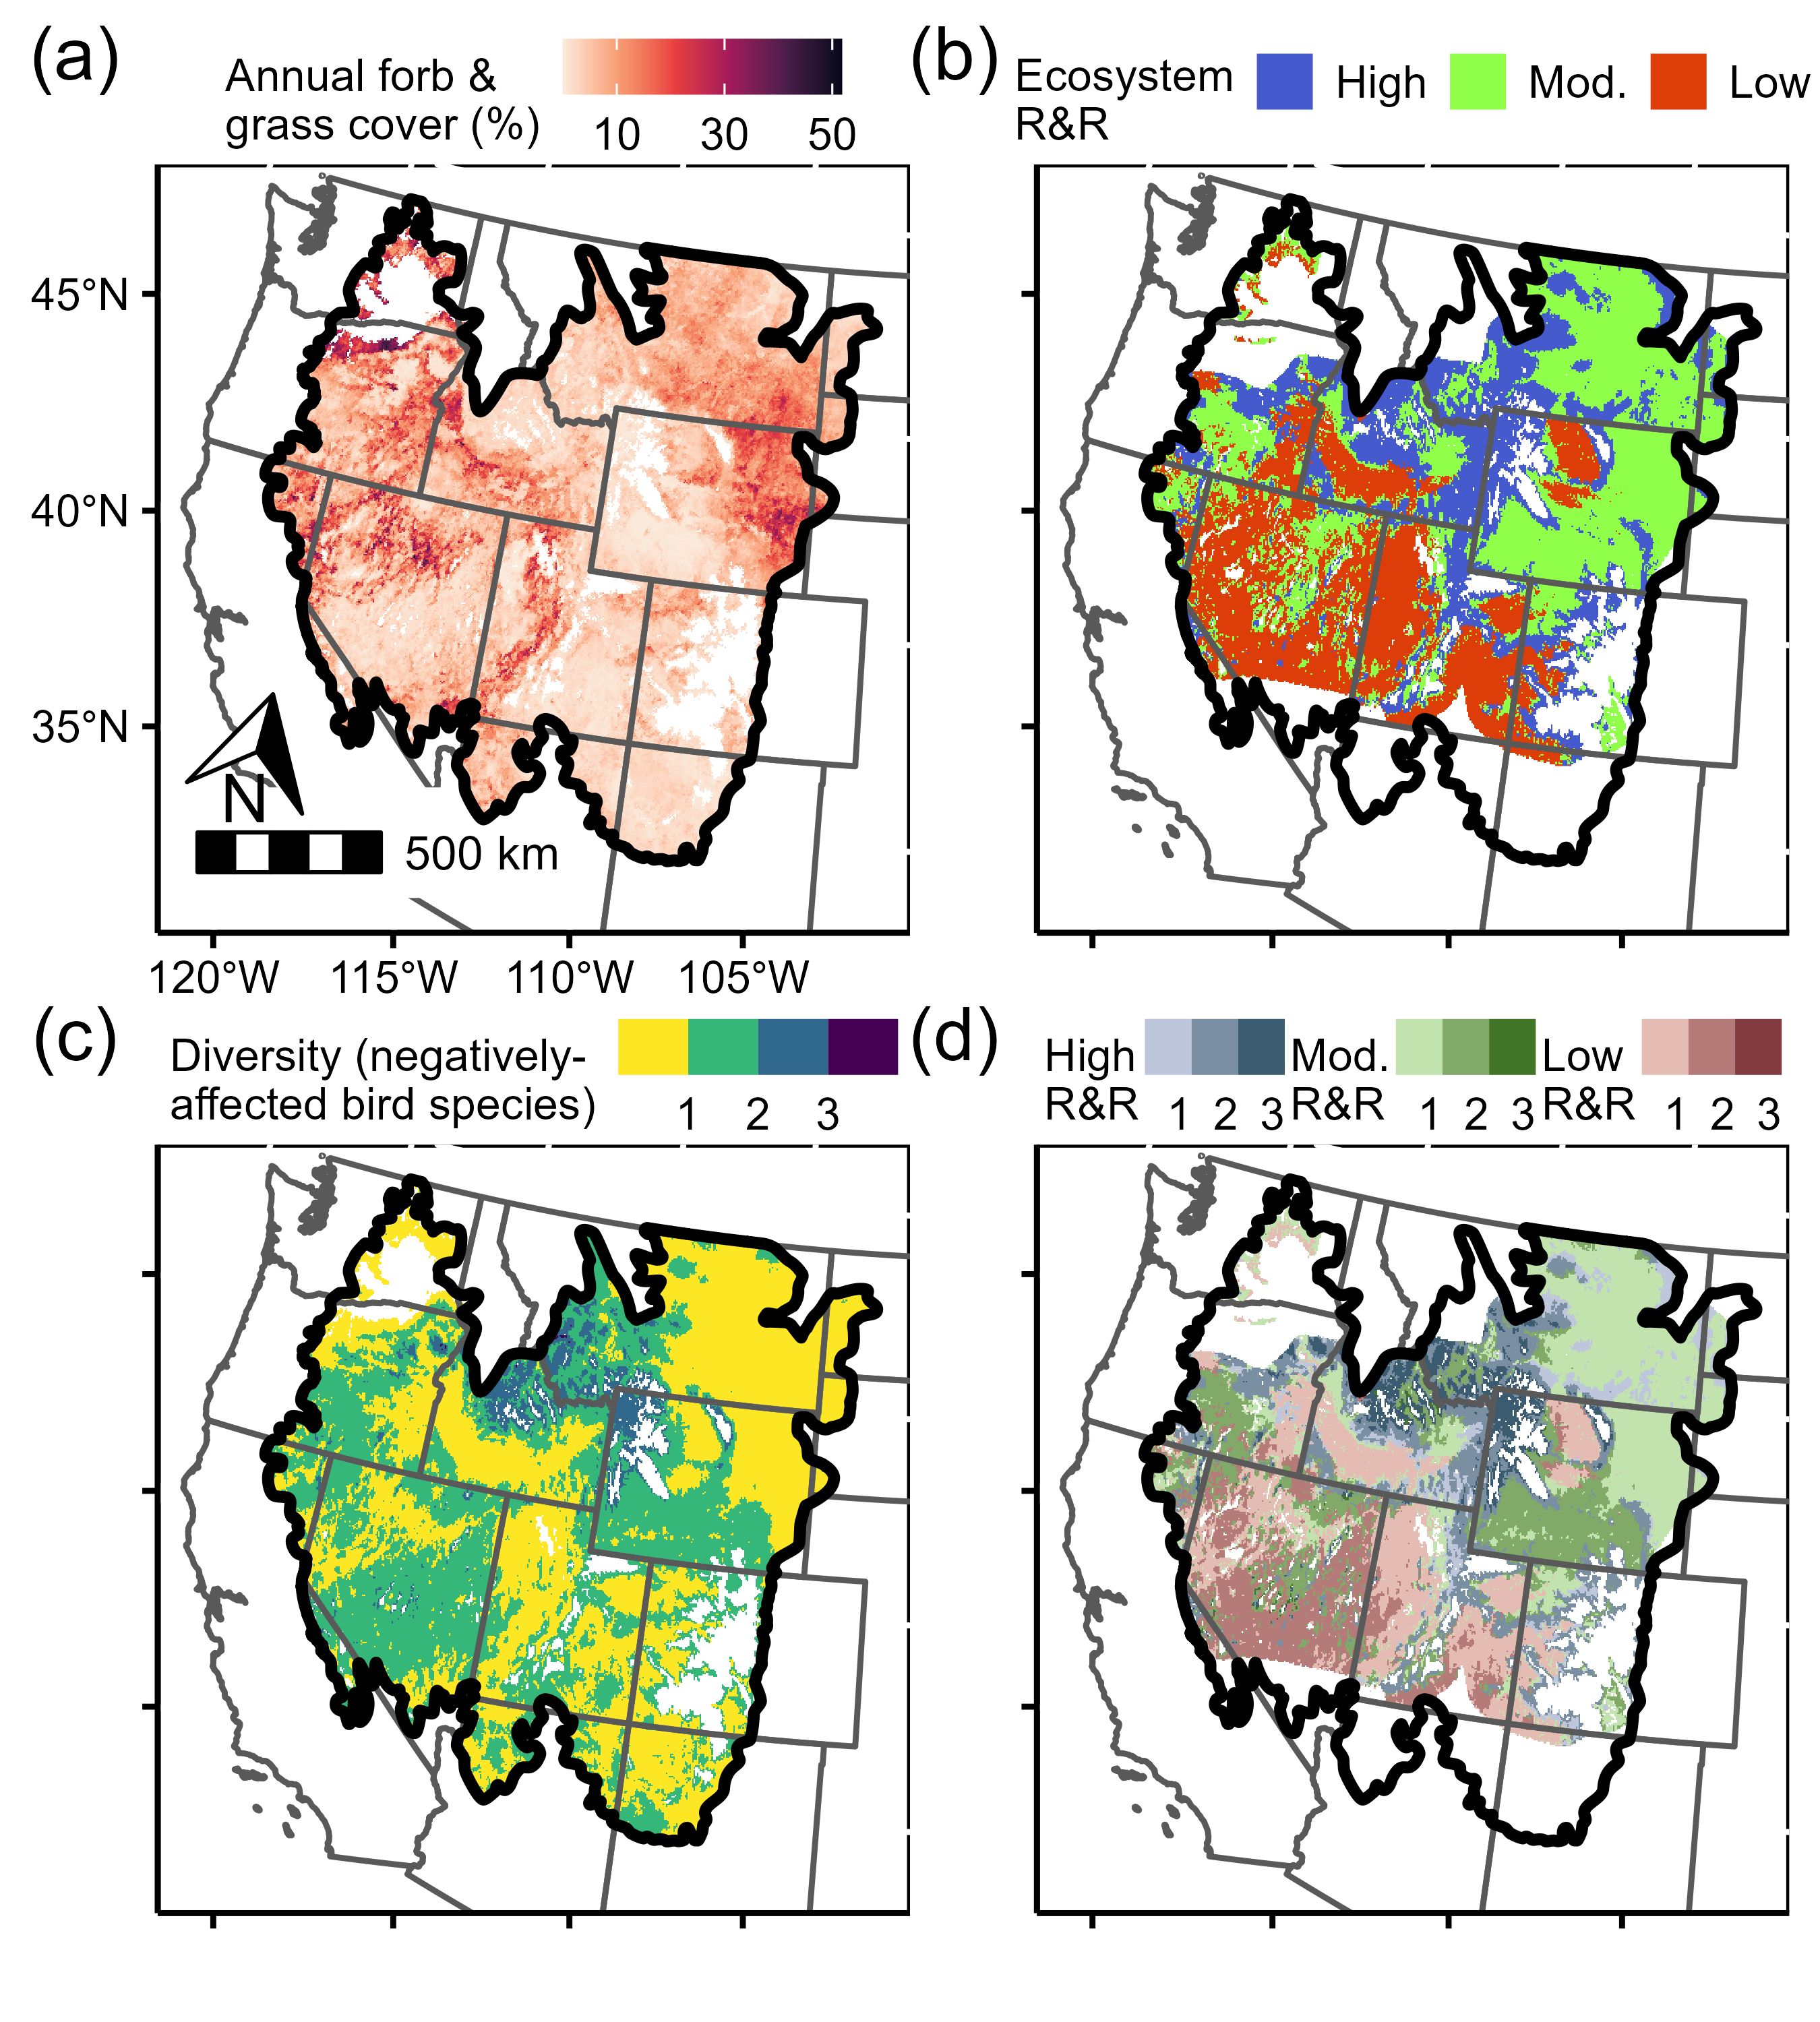
To spatially contextualize regional predictions across the sagebrush biome (bold outline), we mapped (a) the Rangeland Analysis Platform’s (RAP’s) annual forb and grass cover (our proxy for annual grasses) and (b) the “resistance and resilience” (R&R) categories from Chambers et al. (2017), an independently generated likelihood of invasion- or disturbance-driven transformation (high R&R indicates lower probability of future invasion). We then used our occupancy model to predict and map (c) the local diversity of songbirds that were negatively affected by invasion. Finally, we parsed (d) predicted diversity by R&R classes (i.e., spatially intersected panels [b] and [c]). Dark blue areas in panel (d) contain a high number of invasion-sensitive species but are relatively unlikely to be invaded, whereas dark red indicates high diversity in areas more likely to be invaded (green is intermediate likelihood). In panels (c) and (d), continuous diversity was binned for visualization purposes and areas without shading were masked or lacked R&R data. Appendix S1: Figure S4 maps guild-level diversity predictions.
Discussion
Because animals are affected by vegetation change and can functionally alter the trajectory of such change, it is essential to integrate wildlife communities into contemporary ecological transformation research. Our work supports the hypothesis that ecological transformation in vegetation communities also drives substantial turnover in wildlife communities: we found clear evidence that the shift of sagebrush-steppe to annual grasslands is reshaping songbird communities across the sagebrush biome (Figure 2b). Because annual grass invasion is extremely difficult to reverse (Davies et al. 2011; Boyd et al. 2024), we suspect that the shift in songbird community composition may similarly persist. Yet, understanding whether novel songbird community structure is self-reinforcing, and quantifying its temporal rate of change, will better help to categorize the process within the larger body of work on types of transformations (e.g., as a stable state shift or tipping point) and inform practitioners about how responsive the shift may be to management interventions. Our results collectively affirm intuitive thinking that regional vegetation transformation will scale up to transformation at higher trophic levels but suggest that lagged responses and intermediate communities may obscure the true extent of biodiversity change, especially when relying on occurrence- and richness-based metrics alone.
Our occupancy model captured a transformation of songbird communities and suggested that these communities may grow increasingly novel (i.e., dissimilar relative to pre-invasion communities; Radeloff et al. 2015). This interpretation is supported by (i) the negative effect of invasion on sagebrush and shrubland species prevalence and (ii) the positive effect of invasion on grassland and generalist species occurrence (Figure 2a). In general, for species experiencing negative impacts of a process like grass invasion, local abundance (and consequently prevalence) tends to decline before ranges contract (Lawton 1993). On the other hand, when such processes facilitate expansion, species occurrence tends to increase before abundance, as is the case in many nascent range expansions (e.g., grassland songbirds) and biological invasions (e.g., cheatgrass) (Lodge et al. 2006). In other words, the arrival of new species often precedes and outpaces the loss of native biodiversity, leading to transient communities with unpaid extinction debts. Thus, occupancy model estimates not only supported our prediction that annual grasses drive species turnover in the sagebrush biome’s songbird communities but also suggested that such turnover may be in its early stages. Left unchecked, increasing turnover may eventually lead to range contractions and replacement of relatively narrowly distributed sagebrush specialists and shrubland species (e.g., sagebrush sparrow [Artemisiospiza nevadensis]) by more broadly distributed grassland and generalist species (e.g., western meadowlark [Sturnella neglecta]).
Interestingly, in more highly invaded areas, species turnover was accompanied by increased songbird diversity. This finding runs counter to general intuition about the effects of invasions on biodiversity but joins a large body of work similarly reporting increased alpha (local-scale) richness in systems experiencing transformations, biological invasions, or other forms of degradation (Cardinale et al. 2018; Hillebrand et al. 2018). Such patterns are driven by factors like increased habitat heterogeneity, high influx of introduced species, and an outpacing of extinction rates by introduction rates (Hillebrand et al. 2018; Chase et al. 2019). Local diversity may therefore be a poor indicator of ecological integrity and may not reflect trends in diversity at larger scales (Cardinale et al. 2018). For instance, our results suggest that songbird communities of the sagebrush biome may increasingly resemble those of the Great Plains—influx from this larger species pool could drive increased alpha diversity but ultimately decrease beta and gamma diversity if it comes at the cost of losing endemic sagebrush specialists. Thus, in support of our predictions, we would have failed to accurately describe vegetation transformation’s effects on biodiversity had we quantified only occurrence, highlighting the value of approaches that leverage both richness and abundance (or that quantify diversity at multiple scales) to provide sensitive early warning indications of wildlife community transformation (Chase et al. 2019).
Owing to the life-history variation among the 40 species in our study, diverse mechanisms may underlie our results. Annual grass invasion alters microclimates, nesting sites, concealment structures, foraging habitats, and food resources, directly favoring some species while disadvantaging others (Rottler et al. 2015; Germino et al. 2016). Interspecific interactions could also mediate outcomes (for instance, if increased competition in invaded landscapes exacerbates impacts on declining songbirds). Indeed, sagebrush- and grassland-associated songbirds (e.g., sagebrush sparrow and western meadowlark, respectively) overlap in both space and diet within habitats composed of sagebrush–invasive grass mixtures, suggesting that competition is likely (Rottler et al. 2015). Such spatial co-occurrence within invaded landscapes may result in temporarily inflated songbird diversity but longer-term consequences for some species. These insights derive from a rich history of observational research, but experimentally leveraging invasion or restoration may be required to test hypotheses about the mechanistic basis of wildlife community change in novel ecosystems.
Understanding risk is central to effective conservation in the face of transformation: decision-makers must know which species are adversely affected, where such species occur, and how likely transformation is in such areas (Crausbay et al. 2022). We intersected the diversity of sensitive species with the anticipated likelihood of future invasion (Figure 3d), advancing understanding of community-wide risk for songbirds in the sagebrush biome. Most existing risk assessments in this region focus on specialists or single species of conservation concern (Duchardt et al. 2021; Kumar et al. 2024). Our approach is powerful in its community- and biome-wide scope, which may help managers identify high-value biodiversity conservation targets and adjust strategies to match their likelihood of transformation. For instance, areas with low invasion risk and a high diversity of sensitive species (dark blue in Figure 3d) may serve as potential refugia for some songbirds and represent locations where land protection efforts are particularly worthwhile. Conversely, in areas with both high invasion risk and low diversity of sensitive species (light red in Figure 3d), the costs of resisting invasions may outweigh the benefits for biodiversity, and managers might therefore choose to direct limited resources toward other management needs. Finally, monitoring, early detection, and eradication efforts might be most effectively spent where the potential for songbird biodiversity loss is the highest—in areas characterized by a high risk of invasion and a high diversity of sensitive species (dark red in Figure 3d). This kind of information aids managers in prioritizing resource allocation and identifying realistic goals for management actions in areas that are threatened by transformation (Clifford et al. 2022; Schuurman et al. 2022). Note that because we prioritized causal inference over prediction (Appendix S1: Panel S1), our map represents songbird diversity across biogeographical (e.g., climatic) gradients but does not account for fine-scale habitat availability. Although our map provides coarse regional guidance for conservation prioritization, additional local information and improved invasive annual grass cover products are needed to better inform project-scale planning decisions.
Incorporating animals into the study and management of transforming ecosystems is essential to conservation. We have shown that terrestrial wildlife communities are liable to transform alongside vegetation, and an important next step is to evaluate how this in turn affects plant communities via functions like herbivory and seed dispersal. Feedbacks that reinforce novel states are common in transforming ecosystems (Crausbay et al. 2022), and animal community turnover may represent an important avenue for such feedbacks. Focusing on animals’ functional roles also increases the impetus to conserve common, widespread, and otherwise “least concern” species that are nevertheless in decline. Despite little protection for relatively common species like those studied here, their declines and functions are often outsized relative to rare species with formal protections (Baker et al. 2019). Given advancements in large-scale, species-agnostic monitoring programs and remote-sensing technology, transforming ecosystems offer an opportunity to move beyond reactive, single-species paradigms in wildlife conservation and toward community- and function-based approaches.
Acknowledgements
We thank L Dee, K Siegel, C Aldridge, C Latimer, D Pavlacky, and G Jones for input and stimulating conversations throughout the development of this research. We also thank all those who have contributed to the collection and curation of IMBCR data. This material is based upon work supported by the US Geological Survey (USGS) North Central Climate Adaptation Science Center (managed by the USGS National Climate Adaptation Science Center) under Grant/Cooperative Agreement G21AC10278 to RCN, which provided salary and tuition funding for BKH. Any use of trade, firm, or product names is for descriptive purposes only and does not imply endorsement by the US Government.
References
Hobart BK. 2024. Data and code for: Hobart et al. “Annual grass invasion is transforming the sagebrush biome’s songbird communities”. Figshare. https://doi.org/10.6084/m9.figshare.25329127.v1. Viewed 24 Nov 2025.
Additional Information
Data Availability Statement Data and code (Hobart 2024) are available in Figshare at https://doi.org/10.6084/m9.figshare.25329127.
Appendix S1
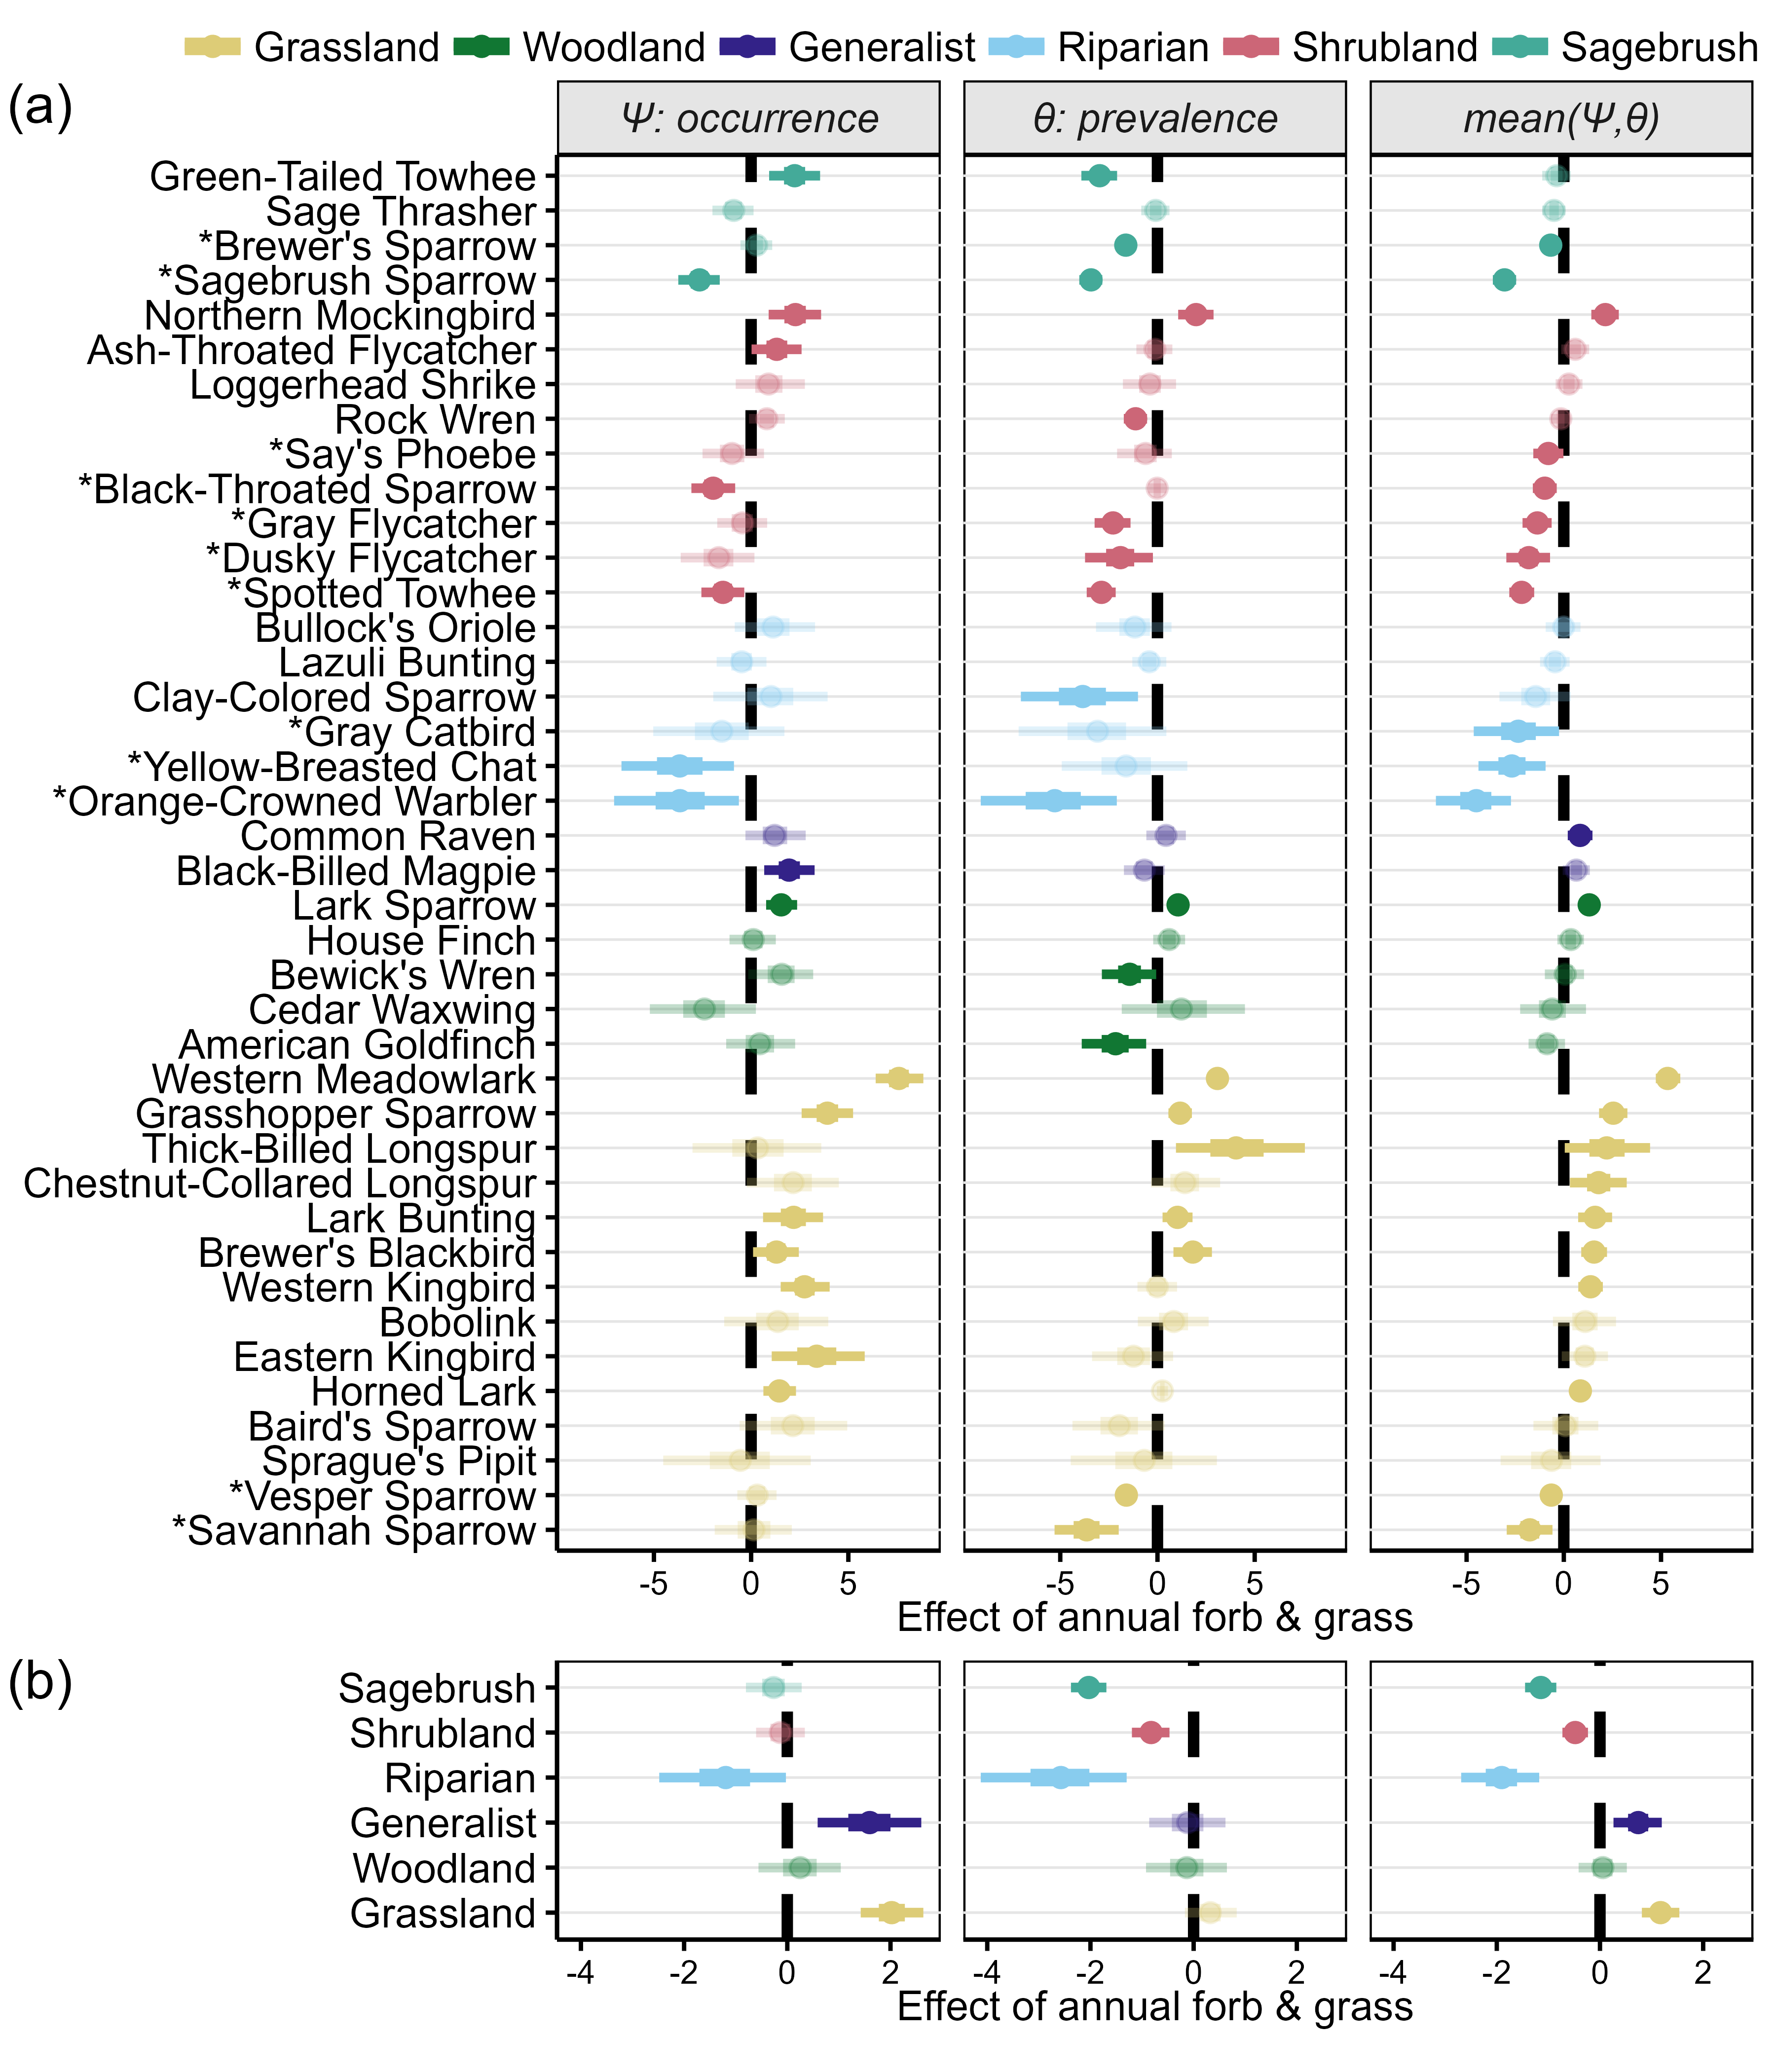
(a) The effect of annual grass cover on ψ (occurrence) and ϴ (prevalence) for each bird species in the study, and (b) guild-level aggregated effects. The third column provides the species- or guild-level arithmetic mean of the effect of annual forb and grass cover on ψ and ϴ and is thus a proxy for the net effect of annual grass cover. Species marked with * are those with a negative response to annual grasses, when averaging across ψ and ϴ (i.e., sensitive to invasion). Points depict median coefficient estimates (on the logit scale) with 50% (thick lines) and 90% (thin lines) equal-tail credible intervals. Scientific names for each species are provided in Table S1.
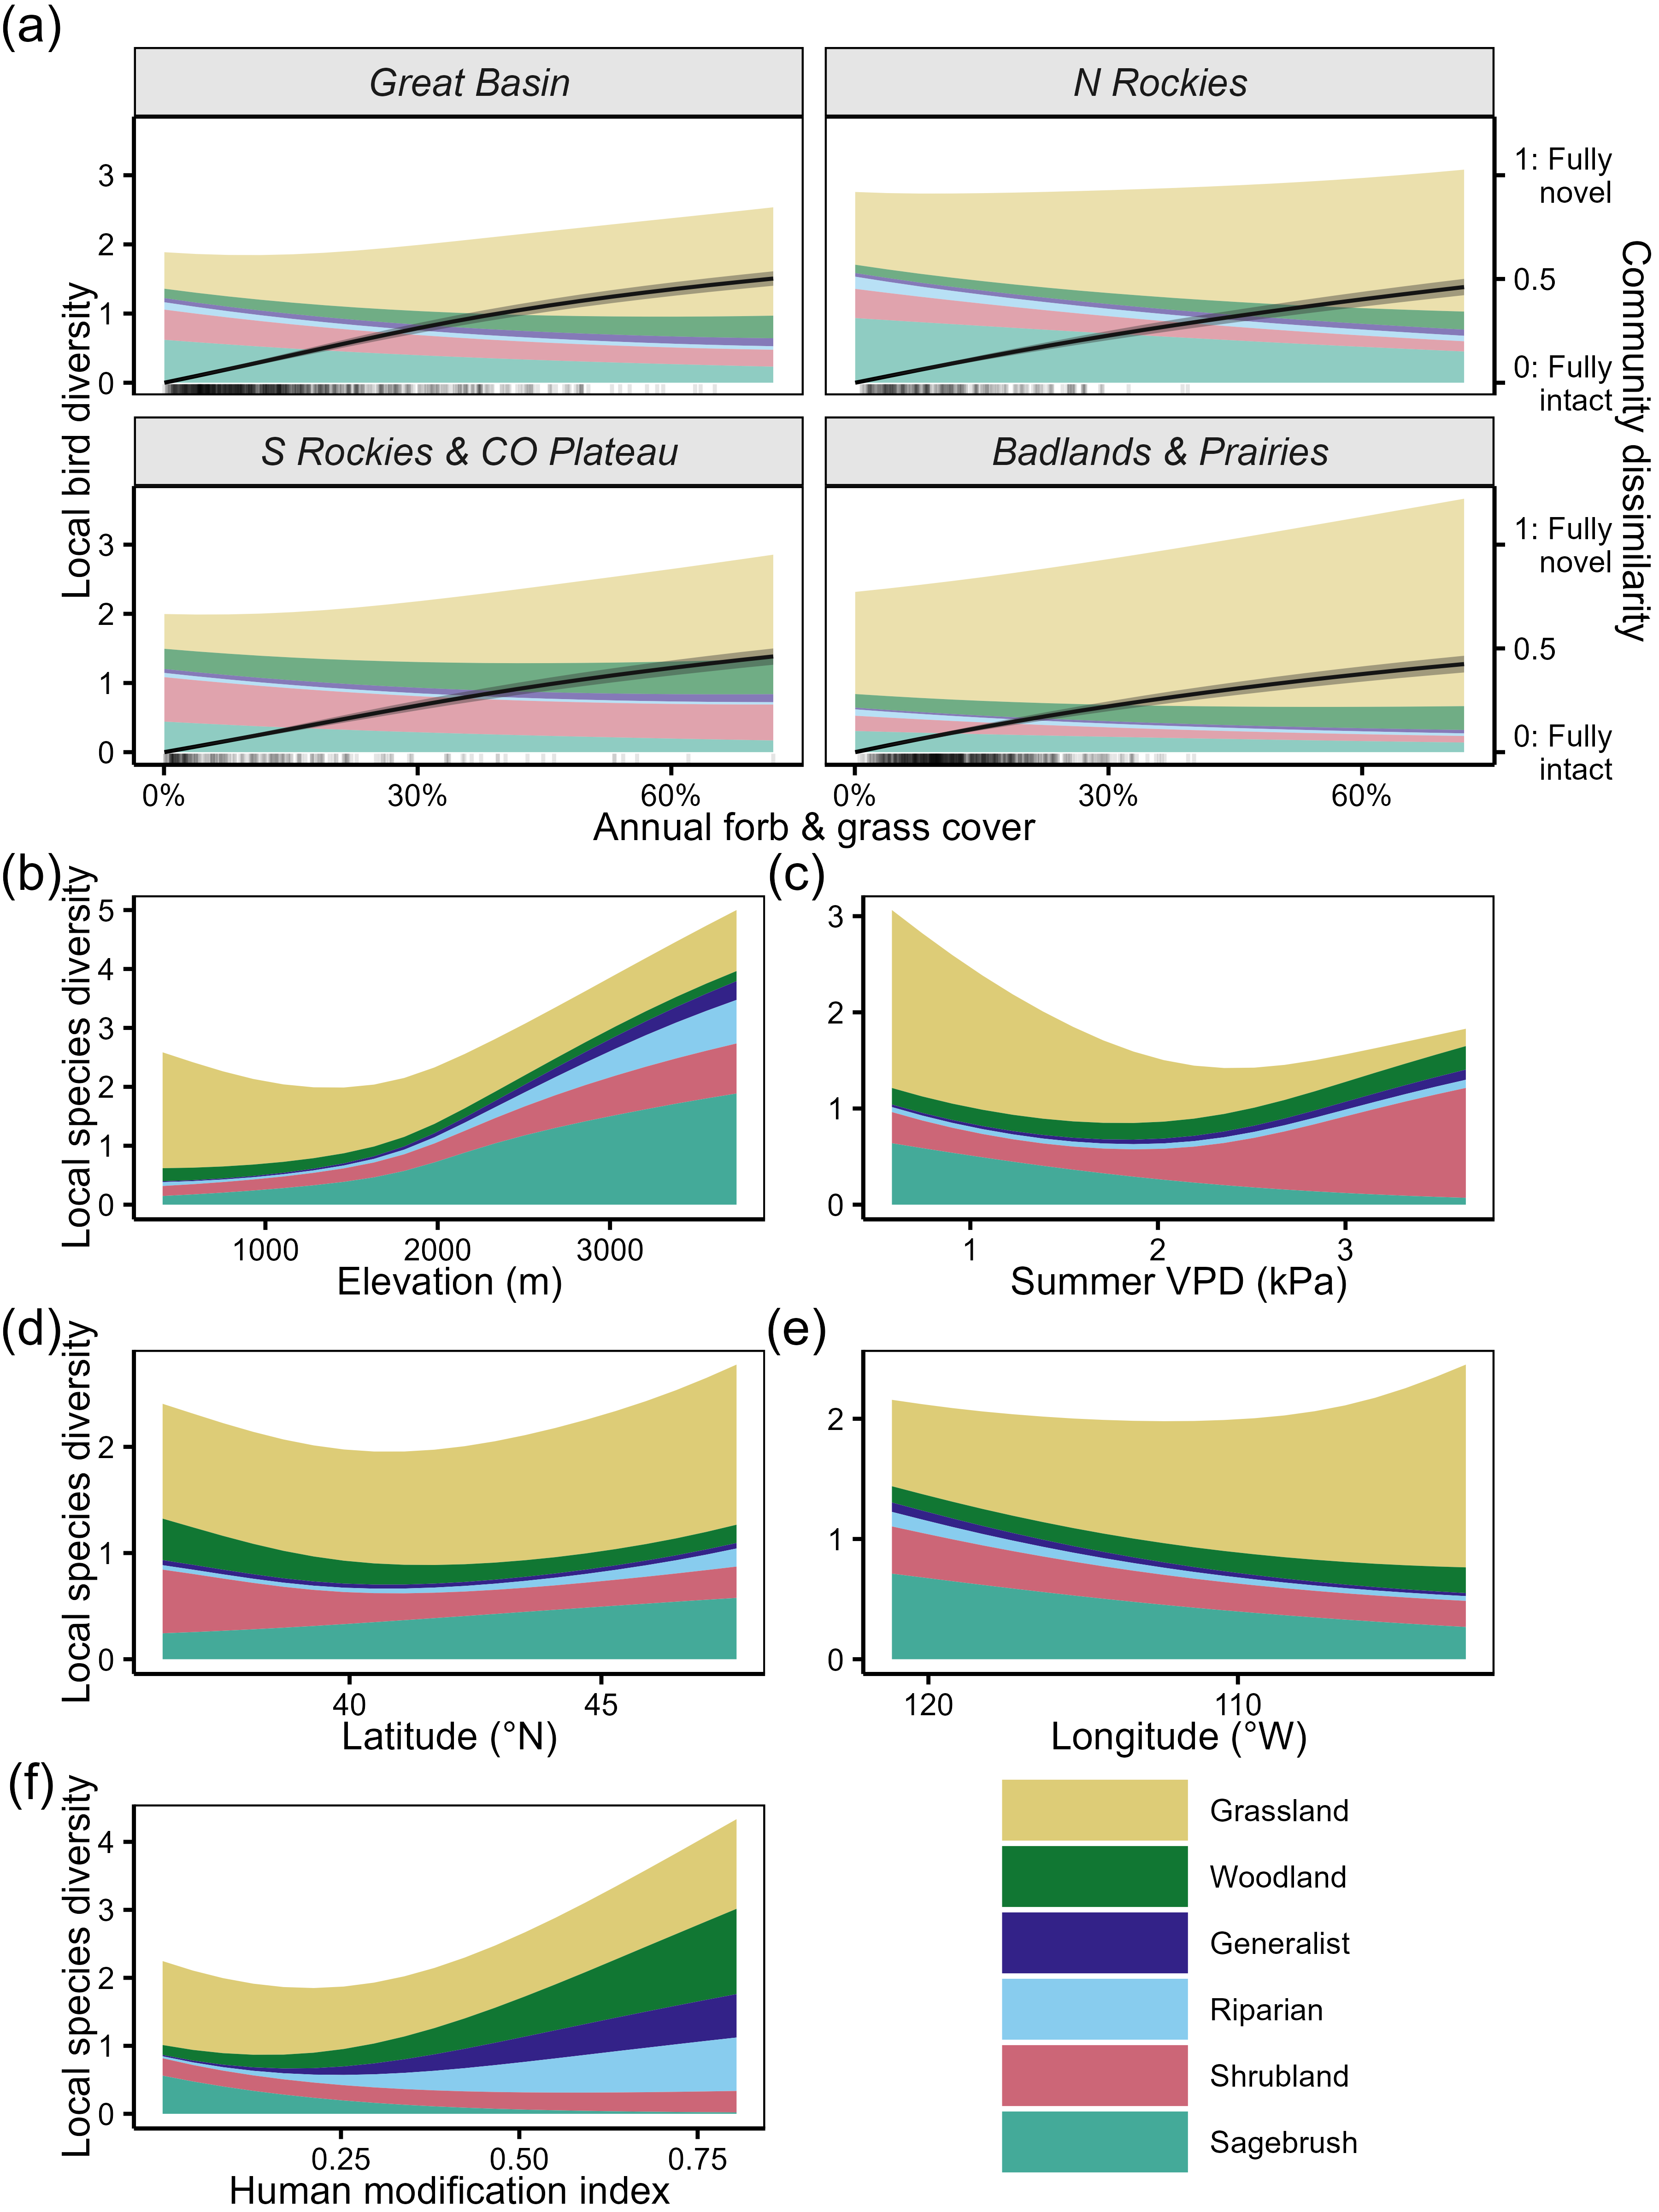
(a) Predicted community composition and Bray-Curtis dissimilarity (relative to uninvaded) as a function of annual grass cover and across the four major Bird Conservation Regions of the sagebrush biome. (b–f) Guild-level composition as a function of additional covariates. For each panel, all other covariates were held at their mean value. Importantly, unlike annual grass results, results for controlling covariates should not be considered causal. Because we did not match for these covariates, their associations with songbird community composition are correlative. For instance, we could not feel confident that an increase in summer VPD at a particular site would cause an increase in the local diversity of shrubland species.
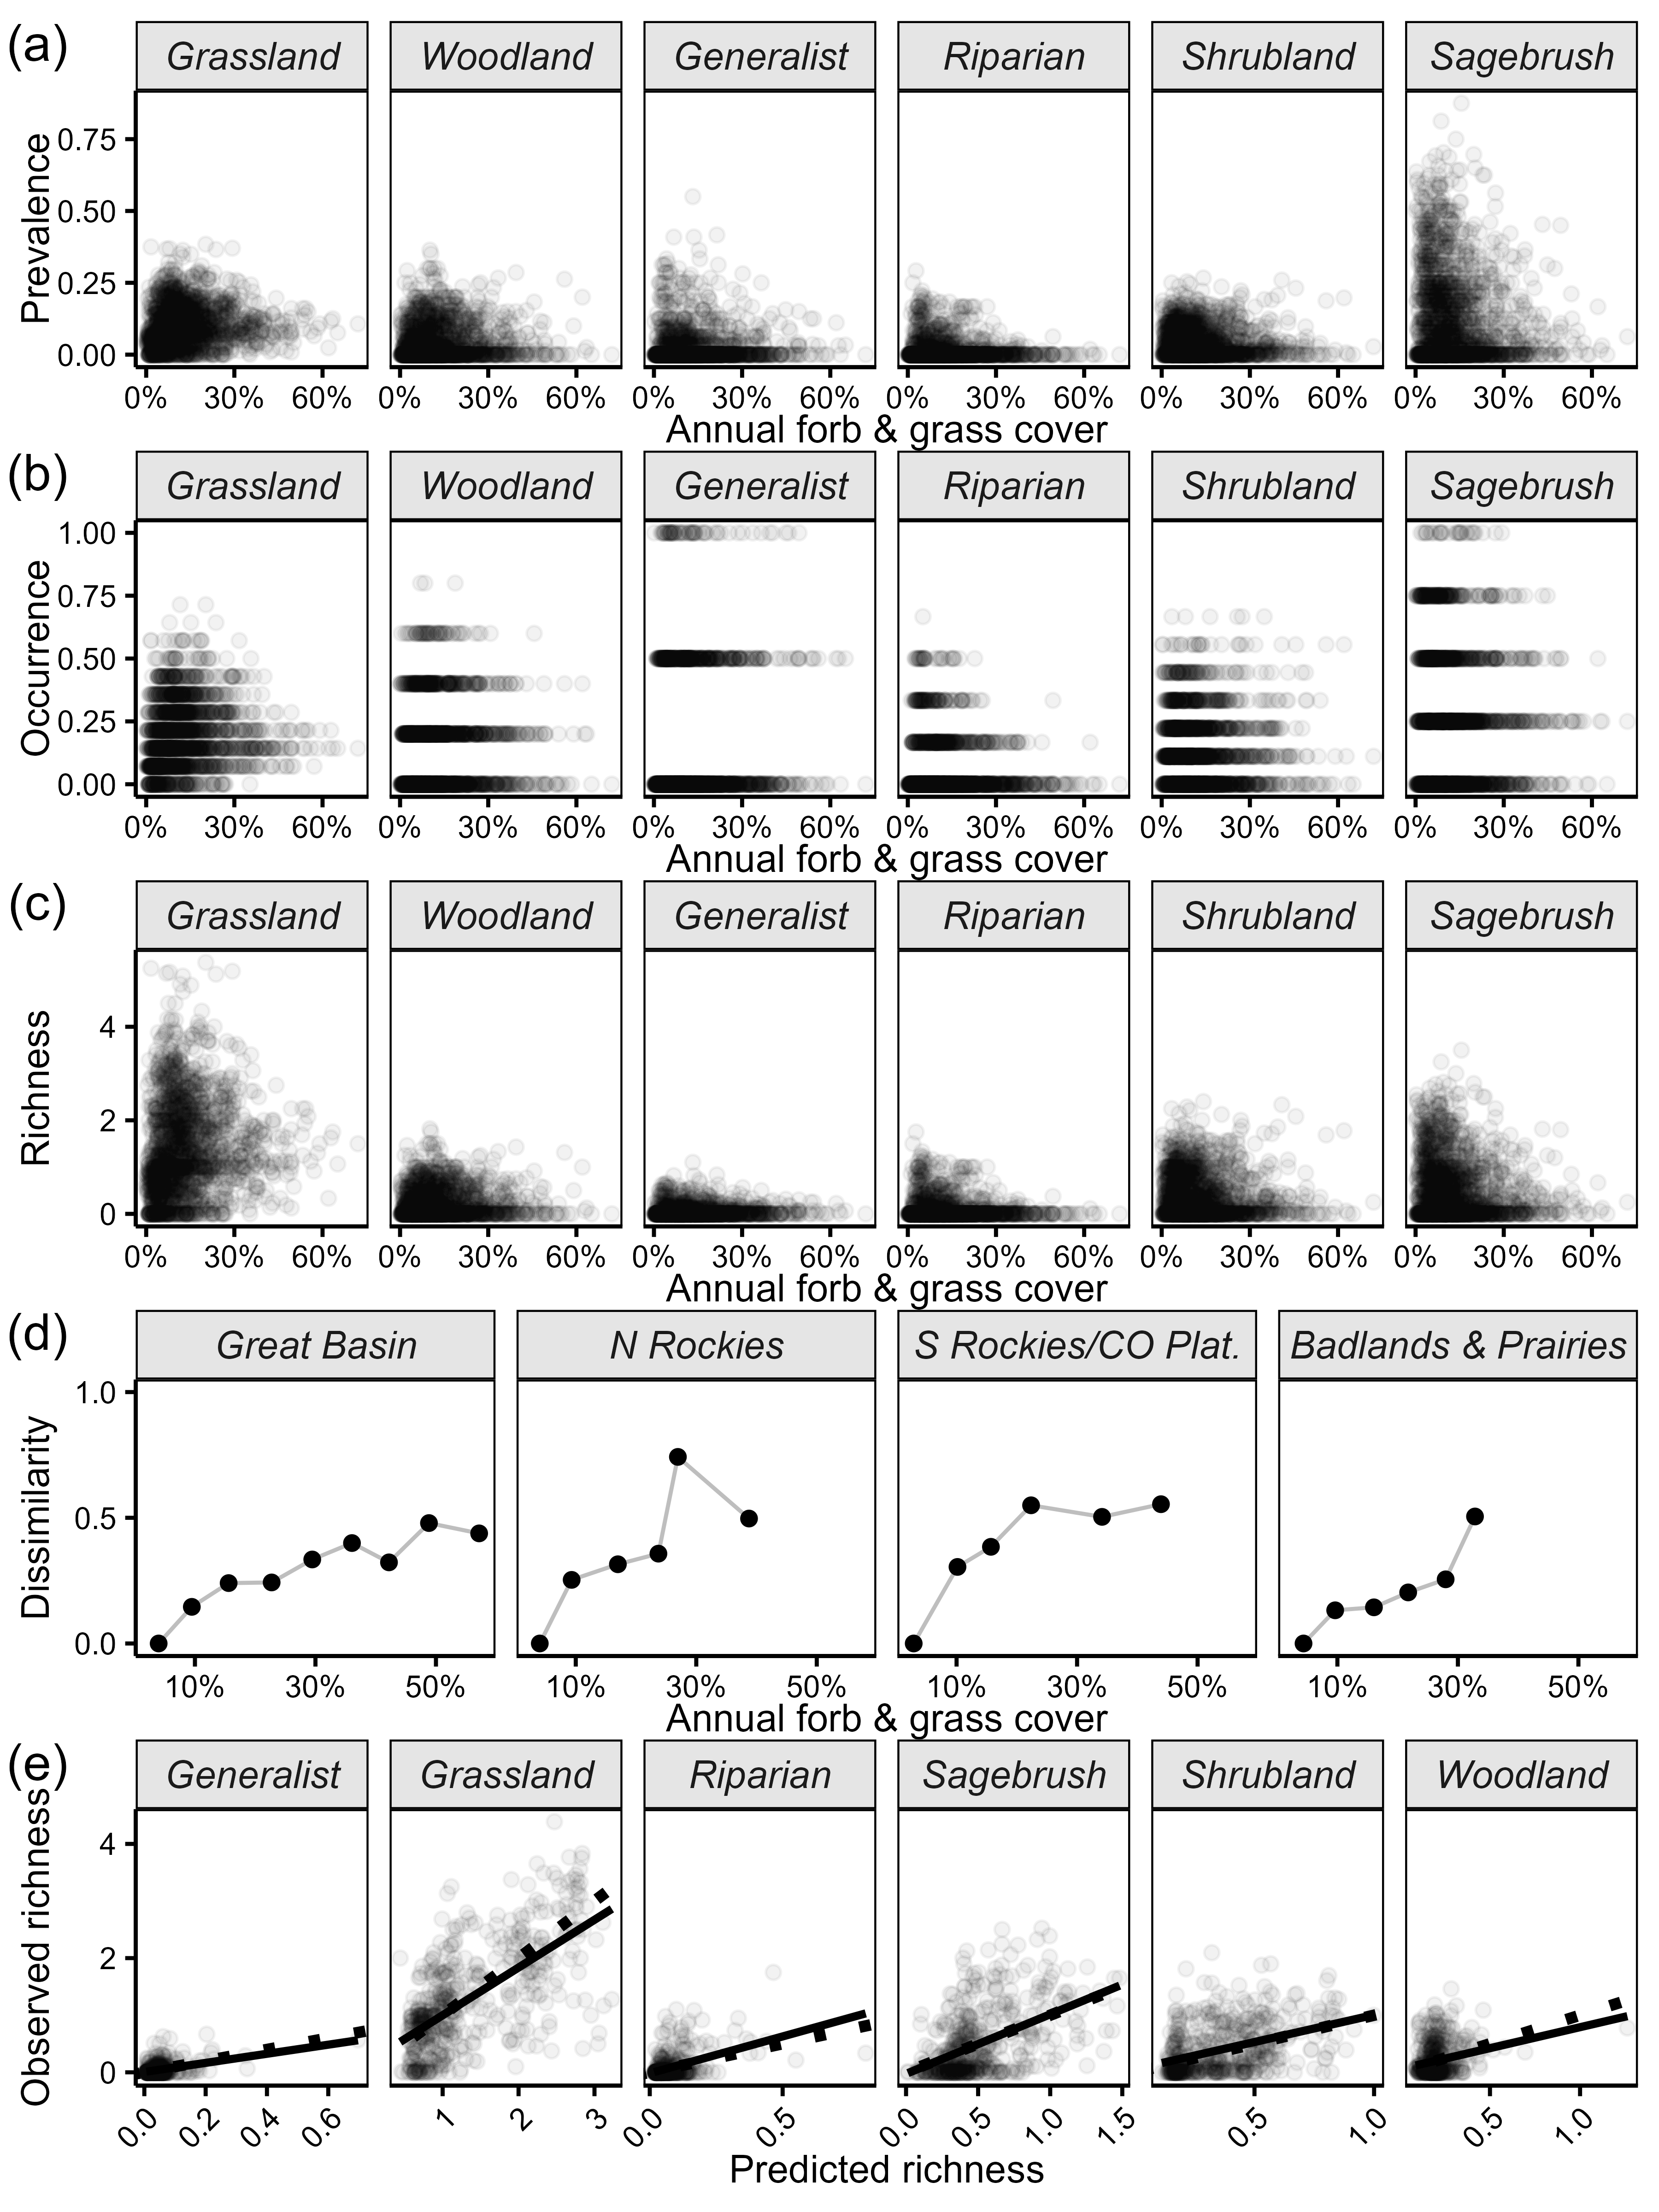
(a–c) Site-level mean prevalence, occurrence, and local richness across site-level mean annual forb and grass values. (d) Observed Bray-Curtis dissimilarity values across annual grass values; each point represents the dissimilarity for the mean of all communities within successive equal-width annual grass bins (6.55%) relative to the first bin. These plots suggest consistent turnover in observed songbird communities with increasing coverage of annual grasses. (e) Predicted versus observed local richness, where the dashed line is 1:1 and the solid line is the best fit of a simple linear regression. Predictions were made using the same process described in the Methods; observed richness is the site-level mean (averaging across plots within sites and across years). These plots suggest good model fit and prediction accuracy.
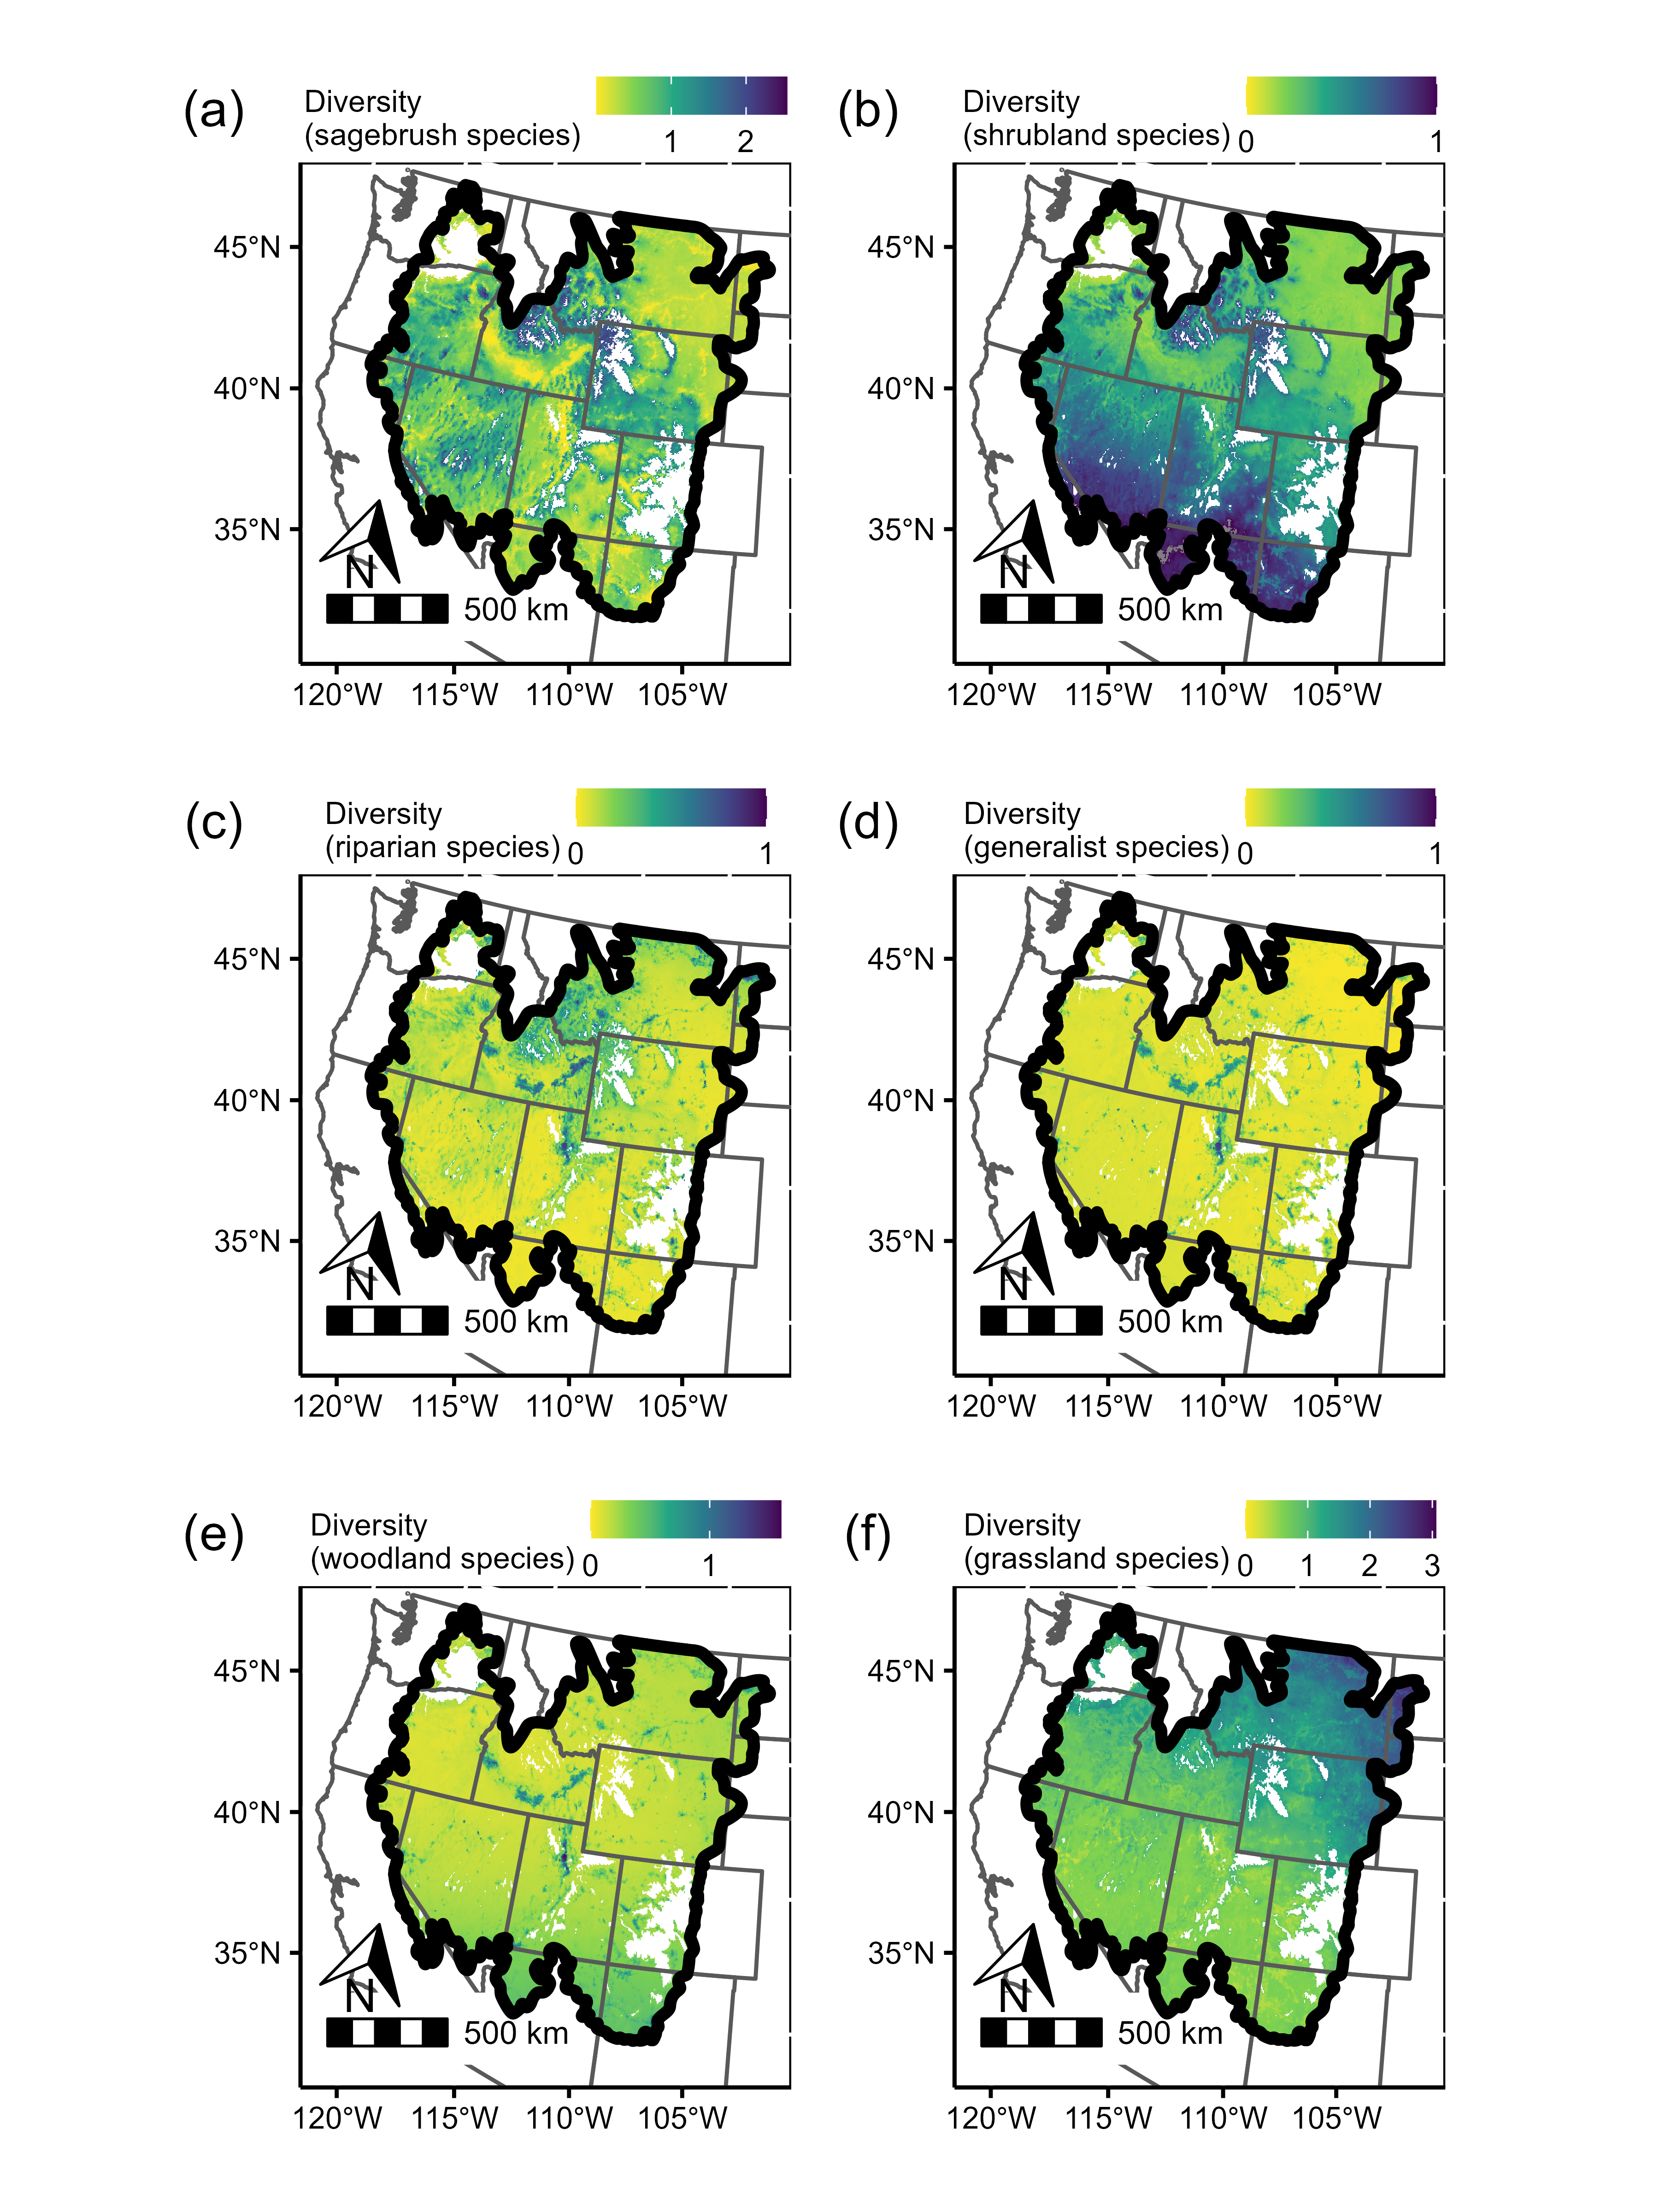
Predictions of local songbird diversity across the sagebrush biome (bold outline) for each of the six guilds we considered. As described in the main text, diversity is estimated with local species richness, obtained by multiplying ψ × ϴ for each species in the community, then summing those products across species within each guild. Diversity values tend to be quite small because the resulting value corresponds to expected richness at the plot scale (i.e., within a 5-ha plot). Unshaded areas are masked because their covariate values fell outside the range of values in our model (most often these were high-elevation areas). See Figure S3e for predicted versus observed richness.
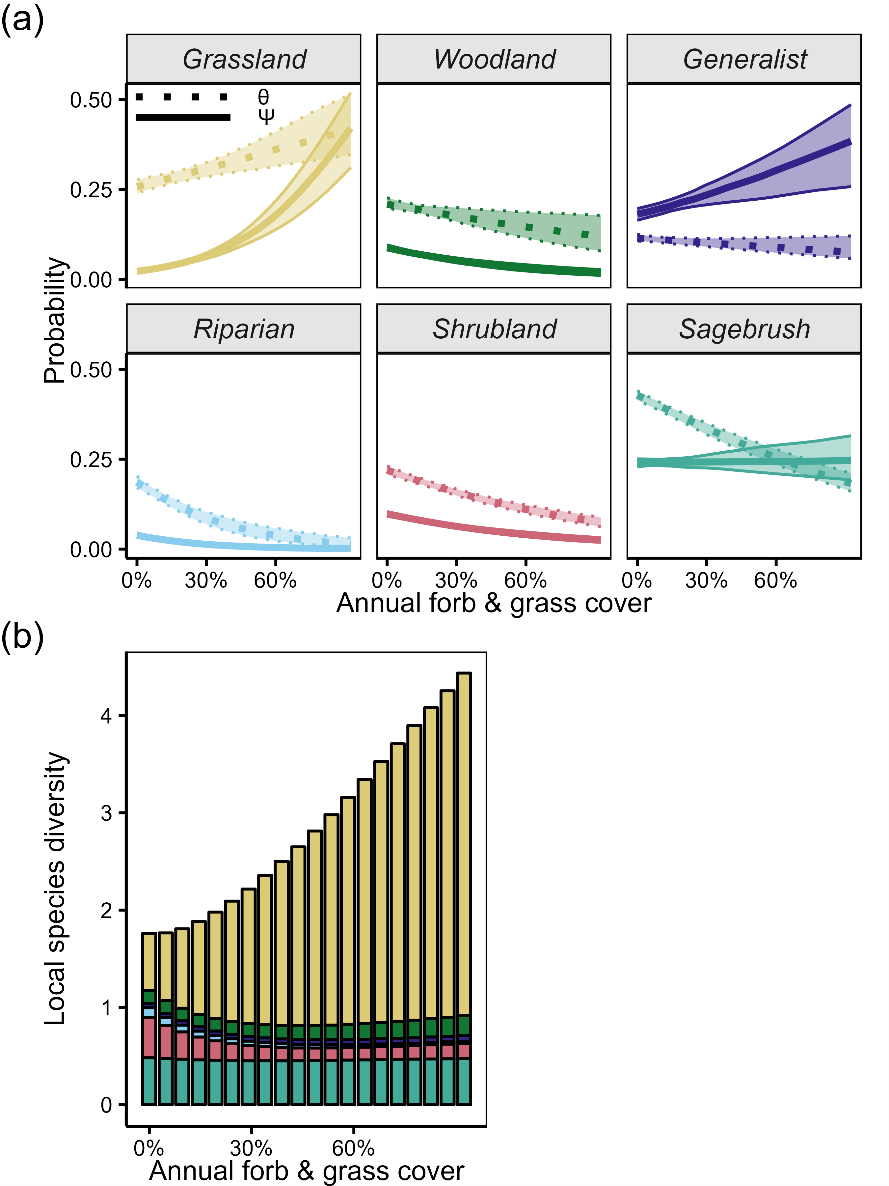
Results of community occupancy modelling for songbirds of the sagebrush biome, if the modelling had been performed without conducting pre-regression matching. As in Figure 2 in the main text, guild-level occurrence and prevalence (a) and community structure (b) are shown as a function of proportional cover of annual forbs and grasses. However, the results shown here are for a model that was fit using the full set of 1,554 candidate sites, rather than the 504 that were selected with matching and used for the analysis presented in the main text.
Table S1.
Common and scientific names for all bird species that were included in our study.Panel S1. Additional methodological details.
Covariate sources
To capture annual grass cover, we calculated the yearly mean proportional cover of annual forbs and grasses from the Rangeland Analysis Platform (RAP), a common practice because the bulk of this cover class is made up of invasive grasses (Allred et al. 2021; Smith et al. 2022). We extracted mean vapor pressure deficit (VPD) for April to July of each year from the gridMET dataset, given the importance of moisture for vegetation and birds in this system (Abatzoglou 2013; Pilliod et al. 2017). Finally, we summarized four time-invariant covariates for each site: the human modification index (Kennedy et al. 2019), elevation (USGS 3DEP 10-m DEM), latitude, and longitude. We used Google Earth Engine to extract all covariates, which we mean-centered on zero and scaled by multiples of 10 to improve model fitting by putting all covariates on similar numeric scales.
Causal inference: Challenges
Quantifying the effect of annual grasses on songbird communities is an attempt at causal inference with observational data: we wanted to know how the bird community at any given site would change if annual grass cover increased or decreased. Yet, annual grass invasion occurs nonrandomly with respect to many ecological factors, such as elevation, precipitation, and temperature (Williamson et al. 2020). This poses a challenge for obtaining unbiased estimates of the consequences of invasion because it introduces confounding: some of the factors that influence where invasion occurs independently drive variation in bird communities, and failure to account for such factors results in biased estimates (Addicott et al. 2022). Ecologists commonly handle such confounding by including those factors as covariates in statistical models (“conditioning on observables”) (Arif and MacNeil 2022); while this can improve inference, further controlling is often needed to approach unbiased estimates and truly causal inference (Butsic et al. 2017; Larsen et al. 2019).
Causal inference: Matching
Pre-regression matching is an intuitive method of handling confounding in observational data; it is routine in some fields but is seldom applied by ecologists (but see, e.g., Simler-Williamson and Germino 2022). In the language of our study, matching helps identify sites (i.e., “study units”) that differ in their invasion status (i.e., “treatment”) but are otherwise similar with respect to a suite of background variables (Stuart 2010; Schleicher et al. 2020). In an ideal world, we would know all the confounders in our system, measure them, and match on them; in doing so, we would approach a quasi-experimental design in which all background variables are effectively randomized with respect to annual grass cover. Although we seldom know or measure all confounders in ecosystems, matching still helps in important ways. First, matching can trim extreme uninvaded sites that lack invaded corollaries (and vice versa). In our candidate set of sites, there were many high-elevation (>~2,500 m) low/no-invasion sites, but no high-invasion sites reaching this altitude; leaving these high-elevation sites in our analysis would have retained confounding between invasion status and elevation. Second, matching also makes our analyses “doubly robust,” in that some confounders are both matched and conditioned on. Doubly robust inference makes analyses less sensitive to misspecification of covariate functional forms (e.g., including only a linear term for a covariate that truly has a quadratic effect on songbird occurrence) (Stuart 2010). Further, we matched on some variables that were not included in occupancy models as covariates owing to fitting and convergence issues (e.g., temperature and precipitation), which helps provide a measure of control for these additional variables. Thus, matching is a simple and effective method for controlling confounding influences in analyses aimed at making causal inferences based on observational data.
We used a form of matching that relies on estimating each site’s “propensity score”—the probability of being highly invaded (>12%) (Bradley et al. 2018; Ramsey et al. 2019). This approach required classifying each site as being highly invaded or not, a task we accomplished by taking the mean annual forb and grass level at each site across all years in which the site was surveyed (mean 5 years) and evaluating whether that value was greater or less than 12%. Although this approach was somewhat crude, averaging across years helped smooth interannual error in annual forb and grass values. Additionally, our focal models included annual forb and grass as a continuous term, and thus this binarization of annual forb and grass was used only for matching via propensity scores. Using logistic regression, we estimated each site’s propensity score as a function of 10 suspected confounders: spring VPD, summer VPD, spring precipitation, summer precipitation, spring minimum temperature, summer maximum temperature, elevation, topographic complexity, human modification, and tree cover. Importantly, we did not match on any vegetation characteristics besides tree cover because these variables are affected by annual grass invasion, and matching on them would thus partially match on invasion itself, diminishing the value of matching (Stuart 2010). We used the MatchIt R package (Stuart et al. 2011) to identify pairs of sites—one high-invasion, one low/no-invasion—with similar propensity scores (within 0.1 units). We also matched “exactly” on Bird Conservation Region (BCR)—only sites within the same BCR could only be paired. Only sites with a matched pair were retained in the final dataset for occupancy modelling; subsequent models did not use a classical “paired” design.
Of the 1,554 candidate sites, we identified 504 with well-balanced propensity scores and covariate distributions. We evaluated the quality of our matching using standardized mean differences and visual evaluations of covariate distributions before versus after matching. All standardized mean differences were acceptably small (<0.15) (Stuart 2010), and the distributions of covariates were visually well-aligned. To further evaluate the effect of matching on our results, we fit our focal occupancy model to the full dataset of observations from all 1,554 candidate sites, the results of which are shown in Figure S5 (which is a recreation of Figure 2 in the main body). The principal difference in results was a steeper increase in occupancy (ψ) of grassland songbirds with rising annual forb and grass cover, suggesting that our conclusions would have been exaggerated had we not performed pre-regression matching.
Causal inference: Model design
The final component of causal inference was selecting which covariates to include in our occupancy model. We aimed to include important confounders but exclude likely mediators. Confounders would obscure true relationships between annual grass cover and songbird responses if left unaccounted for (Rohrer 2018; Laubach et al. 2021; Arif and MacNeil 2022). We accounted for these confounders by matching and conditioning upon elevation, VPD, and human modification index. Notably, although temperature and precipitation represent likely confounders and are included in many similar analyses, we opted to exclude these from occupancy modeling in favor of including VPD, given that (i) VPD was highly correlated (Pearson correlation coefficients r > 0.7) with both temperature and precipitation in our dataset, even though temperature and precipitation themselves were not highly correlated, (ii) VPD lies on the same causal pathway as temperature and precipitation, and (iii) VPD captures ecologically relevant aridity that is predictive primary productivity in dryland ecosystems (Konings et al. 2017; Roby et al. 2020; Li et al. 2023).
Conversely, mediators are factors that are affected by annual grass cover and subsequently affect songbirds; in other words, mediators lie within the causal pathway from annual grass cover to songbirds (Rohrer 2018; Laubach et al. 2021; Arif and MacNeil 2022). Including mediators such as fire or shrub cover in our occupancy model would have “split” the effect of annual grasses into these separate pathways and attenuated the estimated effect of annual grass cover (Rohrer 2018; Laubach et al. 2021; Arif and MacNeil 2022). Although such mediator analysis is important and interesting, our goal was to capture the total effect of annual grasses on songbird communities. We thus did not include any mediators in our occupancy model.
Modeling details
We used a Bayesian multiscale community occupancy model (Pavlacky et al. 2022) to estimate the effect of annual grass cover on each species within our community of 40 songbird species. Using detection/non-detection data, this model derives three important parameters for each species: ψ, the probability of occupying a 1-km2 site; ϴ, the probability of occupying a 5-ha plot within an occupied site; and p, the probability of being detected at an occupied plot during a survey. We specified ψ to have species-level intercepts, random effects for year, and to be a function of six covariates, which were an incomplete subset of those variables used for pre-regression matching: annual grass cover, summer VPD, human modification index, elevation, latitude, and longitude. We structured ϴ similarly, except that excluded latitude and longitude as covariates. Finally, the linear model for p had species-level intercepts and random effects (intercepts) for year.
Each covariate’s effect on ψ and ϴ (i.e., its slope) was species-specific, drawn from a hyperdistribution with model-estimated mean and dispersion. The formulas for ψ and ϴ included species-specific random intercepts and year effects that were drawn from hyperdistributions with mean zero and model-estimated dispersion. Our model differed from Pavlacky et al. (2022) only in that we excluded the BCR random term from the detection probability (p) formula owing to convergence issues.
We estimated model parameters using Markov Chain Monte Carlo (MCMC) simulation with Just Another Gibbs Sampler (JAGS), used the rjags package to write JAGS model code, and fit the JAGS model with the saveJAGS package to estimate occupancy model parameters (v0.0.4.9002) in R (v4.3.1) (Plummer 2003; R Development Core Team 2015). We fit the model with a 10,000 iteration burn-in phase, before allowing three chains to run in parallel for 20,000 additional iterations; we applied a thinning rate of 10 when loading chains, yielding a set of 6,000 samples from the posterior distribution for analysis. We diagnosed model convergence based on each node’s (<1.05 deemed acceptable) and trace plot (to ensure proper mixing and chain behavior).
Authors
Disclaimers
Any use of trade, firm, or product names is for descriptive purposes only and does not imply endorsement by the U.S. Government.
Although this information product, for the most part, is in the public domain, it also may contain copyrighted materials as noted in the text. Permission to reproduce copyrighted items must be secured from the copyright owner.
Suggested Citation
Hobart, B.K., Moss, W.E., Cook, M.C., Nagy, R.C., and McKenzie, V.J., 2026, Annual grass invasion is transforming the sagebrush biome’s songbird communities: Frontiers in Ecology and the Environment, v. 24, no. 4, e70024, 8 p., https://doi.org/10.1002/fee.70024.
Study Area
| Publication type | Article |
|---|---|
| Publication Subtype | Journal Article |
| Title | Annual grass invasion is transforming the sagebrush biome’s songbird communities |
| Series title | Frontiers in Ecology and the Environment |
| DOI | 10.1002/fee.70024 |
| Volume | 24 |
| Issue | 4 |
| Publication Date | January 13, 2026 |
| Year Published | 2026 |
| Language | English |
| Publisher | Ecological Society of America |
| Contributing office(s) | Northern Rocky Mountain Science Center |
| Description | e70024, 8 p. |
| Country | United States |
| Other Geospatial | western United States |