

Modeling carbon fluxes in tidal forested wetlands in the Mississippi river deltaic plain under various hydrologic conditions: Implications for river diversions
Links
- More information: Publisher Index Page (via DOI)
- Document: XML
- Open Access Version: USGS Accepted Manuscript
- Download citation as: RIS | Dublin Core
Introduction
Tidal forested wetlands are situated between terrestrial and aquatic ecosystems. Although the global area is unknown, tidal forested wetlands occur in large areas along the U.S. Gulf and Atlantic, Europe, Central America, and the Amazon (Adame et al. 2024). Within the United States, tidal forested wetlands occupy > 400 km2 in South Carolina, > 230 km2 in Georgia, and > 828 km2 in Louisiana (Shaffer et al. 2016; Krauss et al. 2018); actual tidal forested wetland area is likely to be much higher than currently realized. Tidal forested wetlands play an important role in sequestering and storing “blue carbon,” like mangroves, saltmarshes, and seagrasses (Krauss et al. 2018; Adame et al. 2024), thereby helping to mitigate negative impacts of climate warming. Nevertheless, the location and low-lying position of tidal forested wetlands make them especially vulnerable to saltwater intrusion from climate change-induced sea-level rise (SLR), drought, flooding and increased storm surges (Neubauer et al. 2013; Noe et al. 2013; Pierfelice et al. 2015; Kirwan and Gedan 2019).
The Maurepas Swamp is the second largest contiguous coastal swamp forest in Louisiana, containing 776 km2 of freshwater forested wetlands, and about 52 km2 of fresh and oligohaline marshes (Shaffer et al. 2016). It was once naturally connected to the Mississippi River (MR) and received freshwater input from the MR with high nutrients and sediment loads. Historically, the Maurepas forests were 90% baldcypress–water tupelo (Taxodium distichum–Nyssa aquatica) tidal swamps (Shaffer et al. 2016). The Lake Maurepas swamp forests are productive with the highest above-ground net primary productivity (ANPP) reaching ~932 g C m-2 yr-1 in the area near the MR with an average of ~485 g C m-2 yr-1 and range of 195 - 932 g C m-2 yr-1 in the entire swamp (Shaffer et al. 2003; Hoeppner et al. 2008; Shaffer et al. 2016). This highest ANPP is comparable to mangrove forests (mean ± SE: 1,320 ± 170 g C m-2 yr-1, median: 900 g C m-2 yr-1, and higher than that of saltmarshes (mean ± SE: 500 ± 30 g C m-2 yr-1, median: 370 g C m-2 yr-1) (Alongi 2020). However, over the last century, this swamp has become highly degraded with high tree mortality and conversion to freshwater marshes. The swamp degradation was attributed to subsidence, permanent flooding, lack of mineral sediment and nutrient input, nutria herbivory, and saltwater intrusion from Lake Pontchartrain as well as canal dredging, specifically a large shipping channel, which exacerbates surge, high tide salinity pulses, and drought (Shaffer et al. 2003; Effler and Goyer 2006; Hoeppner et al. 2008; Day et al. 2009a, b; Shaffer et al. 2009a, b; Middleton et al. 2015; Hunter et al. 2016; Shaffer et al. 2016).
The impacts of saltwater intrusion range from stress and mortality of individual trees to total tree mortality and conversion of swamp forests to tidal marshes and open water (Krauss et al. 2018). Swamp forest basal area was reduced from 44 – 87 m2 ha-1 without salinity impacts to 23 – 36 m2 ha-1 with salinity levels of 1.3 – 3.0 parts per thousand (ppt) in South Carolina and Louisiana (Krauss et al. 2007), on average a 13.4 m2/ha decrease per ppt salinity specifically for Louisiana (Krauss et al. 2017). These salinity impacts have continued over time and led to up to 75% reduction in live tree aboveground carbon stock over a 7-year period (Shipway et al. 2024). Moreover, the magnitude and direction of changes in gross primary productivity (GPP), net primary productivity (NPP), ecosystem respiration (ER), methane (CH4) and nitrous oxide (N2O) emissions, soil carbon sequestration, and carbon storage in tidal forested wetlands along the Waccamaw River and the Savannah River varied greatly with site-specific soil salinity and water level conditions, implying that there are large uncertainties in blue carbon accounting and budget estimation from tidal forested wetlands (Wang et al. 2022, 2023a). For salinity impacted tidal forests along the Savannah River, drought caused soil salinity to increase from 3.46 ± 2.12 to 7.23 ± 0.72 ppt, resulting in a -64% (-106 g C m-2 yr-1, from 167 to 61 g C m-2 yr-1) reduction in NPP compared to NPP versus pre-drought, and, soil carbon dioxide (CO2) flux increased by 140 g C m-2 yr-1 from 116 to 256 g C m-2 yr-1, equating to a 120.7% change (Wang et al. 2022). Under the same drought condition, CH4 fluxes switched from emission of 0.81 g C m-2 yr-1 to uptake of 0.91 g C m-2 yr-1, whereas N2O emissions increased from 0.19 to 1.09 kg N ha-1 yr-1 (Wang et al. 2023a). In contrast, for the upper tidal river (less salinity impacted) swamp forest site along the same river, NPP increased from 240 g C m-2 yr-1 pre-drought to 362 g C m-2 yr-1 (51% increase) under drought, while soil CO2 flux remained relatively constant (178 vs. 176 g C m-2 yr-1) (Wang et al. 2022), CH4 emissions increased from 56 to 144 kg C ha-1 yr-1, and N2O declined slightly from 0.51 to 0.47 kg N ha-1 yr-1 (Wang et al. 2023a). Although carbon fluxes and greenhouse gas (GHG) emissions are critical components of carbon budget estimation in tidal forested wetlands, data and understanding of carbon dioxide exchange between the atmosphere and forested wetlands remain limited. There are very few measurements of net ecosystem exchange (NEE) of CO2 from tidal forested wetlands that can be used to determine if the forested wetlands are carbon sources or sinks of atmospheric CO2 under different ecosystem-based management scenarios, such as large-scale river re-introduction projects (aka, diversions).
To combat the degradation of the Lake Maurepas swamp forests, Louisiana Coastal Protection and Restoration Authority (CPRA) are building the River Reintroduction into Maurepas Swamp Project (CPRA 2023). A Mississippi River reintroduction into the Maurepas Swamp is designed to restore and sustain the natural hydrology of one of the largest remaining forested wetlands along the U.S. Gulf coast (e.g. Day et al. 2009a). Construction of the diversion project began in December 2024 and is expected to be completed in 2029. However, although the growth and mortality of tree species in Lake Maurepas swamp have been intensively studied over the past three decades (Shaffer et al. 2003; Hoeppner et al. 2008; Shaffer et al. 2009a, b; Shaffer et al. 2016), our understanding of projected changes in carbon fluxes and GHG emissions in the swamp forests with hydrologic regime change is unknown. The objectives of this present study are to 1) validate a process-based wetland biogeochemistry model for the Lake Maurepas swamp forests in the Mississippi River Deltaic Plain (MRDP); 2) use the calibrated model to determine the spatial variability in NEE, NPP, ER, CH4, and N2O emissions; and 3) examine the impacts of climate change induced drought, flooding, and SLR, as well as a river diversion on these carbon fluxes and GHG emissions. Results of this modeling study could help monitoring and adaptive management of Lake Maurepas forested wetlands as a major restoration tool to combat the impacts of SLR and salinity intrusion, understand MR diversion potential, and improve understanding of the potential effects of river reintroduction as a coastal management approach.
Methods
Study Sites
Lake Maurepas swamp forests are located in the upper Lake Pontchartrain Basin of Southeastern Louisiana in the MRDP (Fig. 1). The swamp forests consist of roughly 550 km2 of baldcypress (Taxodium distichum) and water tupelo (Nyssa aquatica) dominated swamps, interspersed with 150 km2 of fresh and intermediate marshes (Hoeppner et al. 2008). The Lake Maurepas swamp forests were once naturally connected to the Mississippi River and received freshwater input that maintained high productivity (Shaffer et al. 2016; Krauss et al. 2017). Lake Maurepas is an oligohaline coastal lake with an average depth of approximately 2 m (Hoeppner et al. 2008). Monthly mean salinity commonly reaches 2 ppt during fall months in Pass Manchac in the east of Lake Maurepas that links it to Lake Pontchartrain; salinity could rise to as high as 6.5 ppt as observed during the drought in 2000 (Shaffer et al. 2003; Hoeppner et al. 2008; Shaffer et al. 2016). Located in the southeast of Lake Pontchartrain, the Mississippi River Gulf Outlet (MRGO), a 76-mile shipping channel completed in 1965 and intersected with the Gulf Intracoastal Waterway, had large impacts on swamps, marshes, and lakes by saltwater intrusion from the Gulf to the Lake Maurepas swamp forests (Shaffer et al. 2009a; Poirrier 2013; Hunter et al. 2016.). A closure structure across MRGO at Bayou La Loutre was completed in July 2009, and the precipitous decline of storm surge (up to 8.5 m depending on event) and saltwater intrusion was documented from a soil salinity timeseries after a 2.9 km Lake Borgne Surge Barrier was completed in 2011 (Poirrier 2013; Hunter et al. 2016). Since the closing of the navigation channel, surface water salinities did not exceed 6 ppt compared to the fluctuation of 2 – 12 ppt prior to the closure (Hunter et al. 2016). The climate in this region is warm temperate with an annual average temperature of 20 °C and an average annual rainfall of about 1,300-1,400 mm, and the growing season can be as long as 300 days (Hoeppner et al. 2008).
Twelve sites from the Coastwide Reference Monitoring System (CRMS, https://www.lacoast.gov/crms_viewer/Map/CRMSViewer) in the swamp forest area were selected for this modeling study (Fig. 1). These CRMS sites were classified into three groups based on the changes in hydrological regimes and their impacts on forest structure and biomass growth: throughput, relict, and degraded. According to Shaffer et al. (2003, 2009b, 2016), the throughput sites are forest stands receiving reliable nonpoint sources of freshwater runoff, characterized by mature overstory and midstory stands and little herbaceous cover; the relict sites are stagnant, nearly permanently flooded interior sites, characterized by trees with broken canopies, few mid-story species, well-defined herbaceous community, and complete lack of natural regeneration; the degraded sites are near Lake Pontchartrain or the margin of Lake Maurepas that are prone to severe saltwater intrusion events characterized by dead trees, sparsely dotted with baldcypress, and dominated by herbaceous species and open water. Site elevation ranged from -0.11 to 0.32 m North American Vertical Datum of 1988 (NAVD88), soil bulk density measured in 2021 ranged from 0.06 to 0.63 g cm-3, and soil organic matter ranged from 12.8 to 80.5% (CRMS 2025).
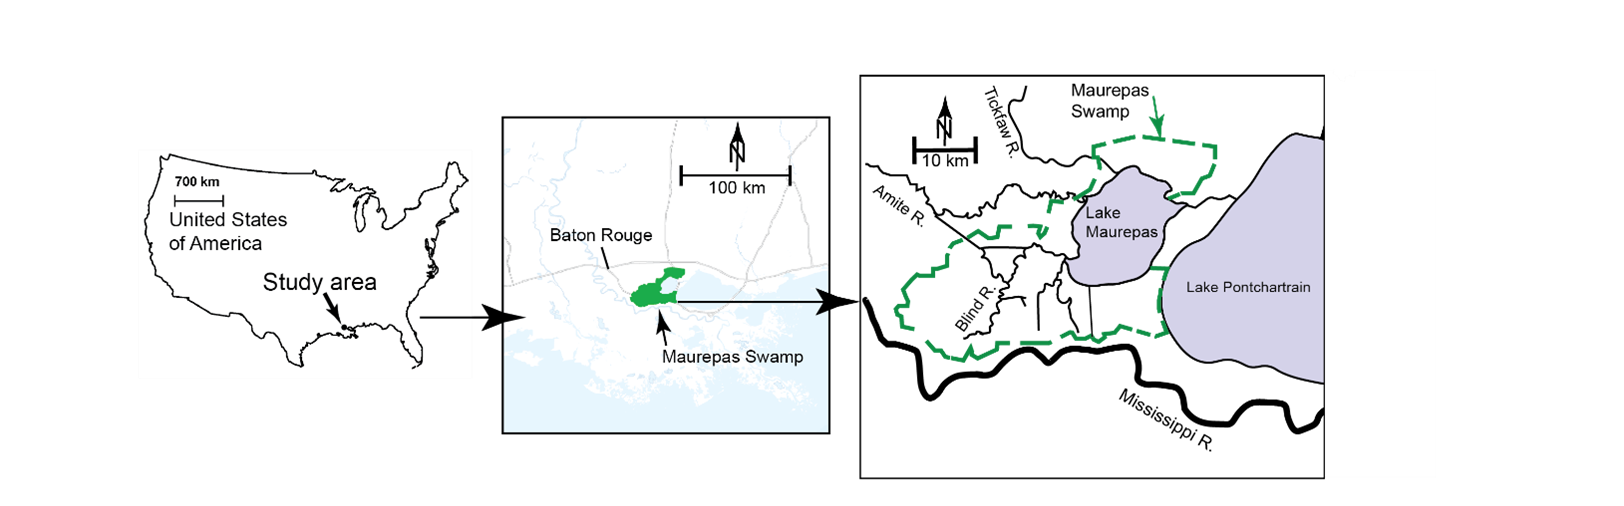
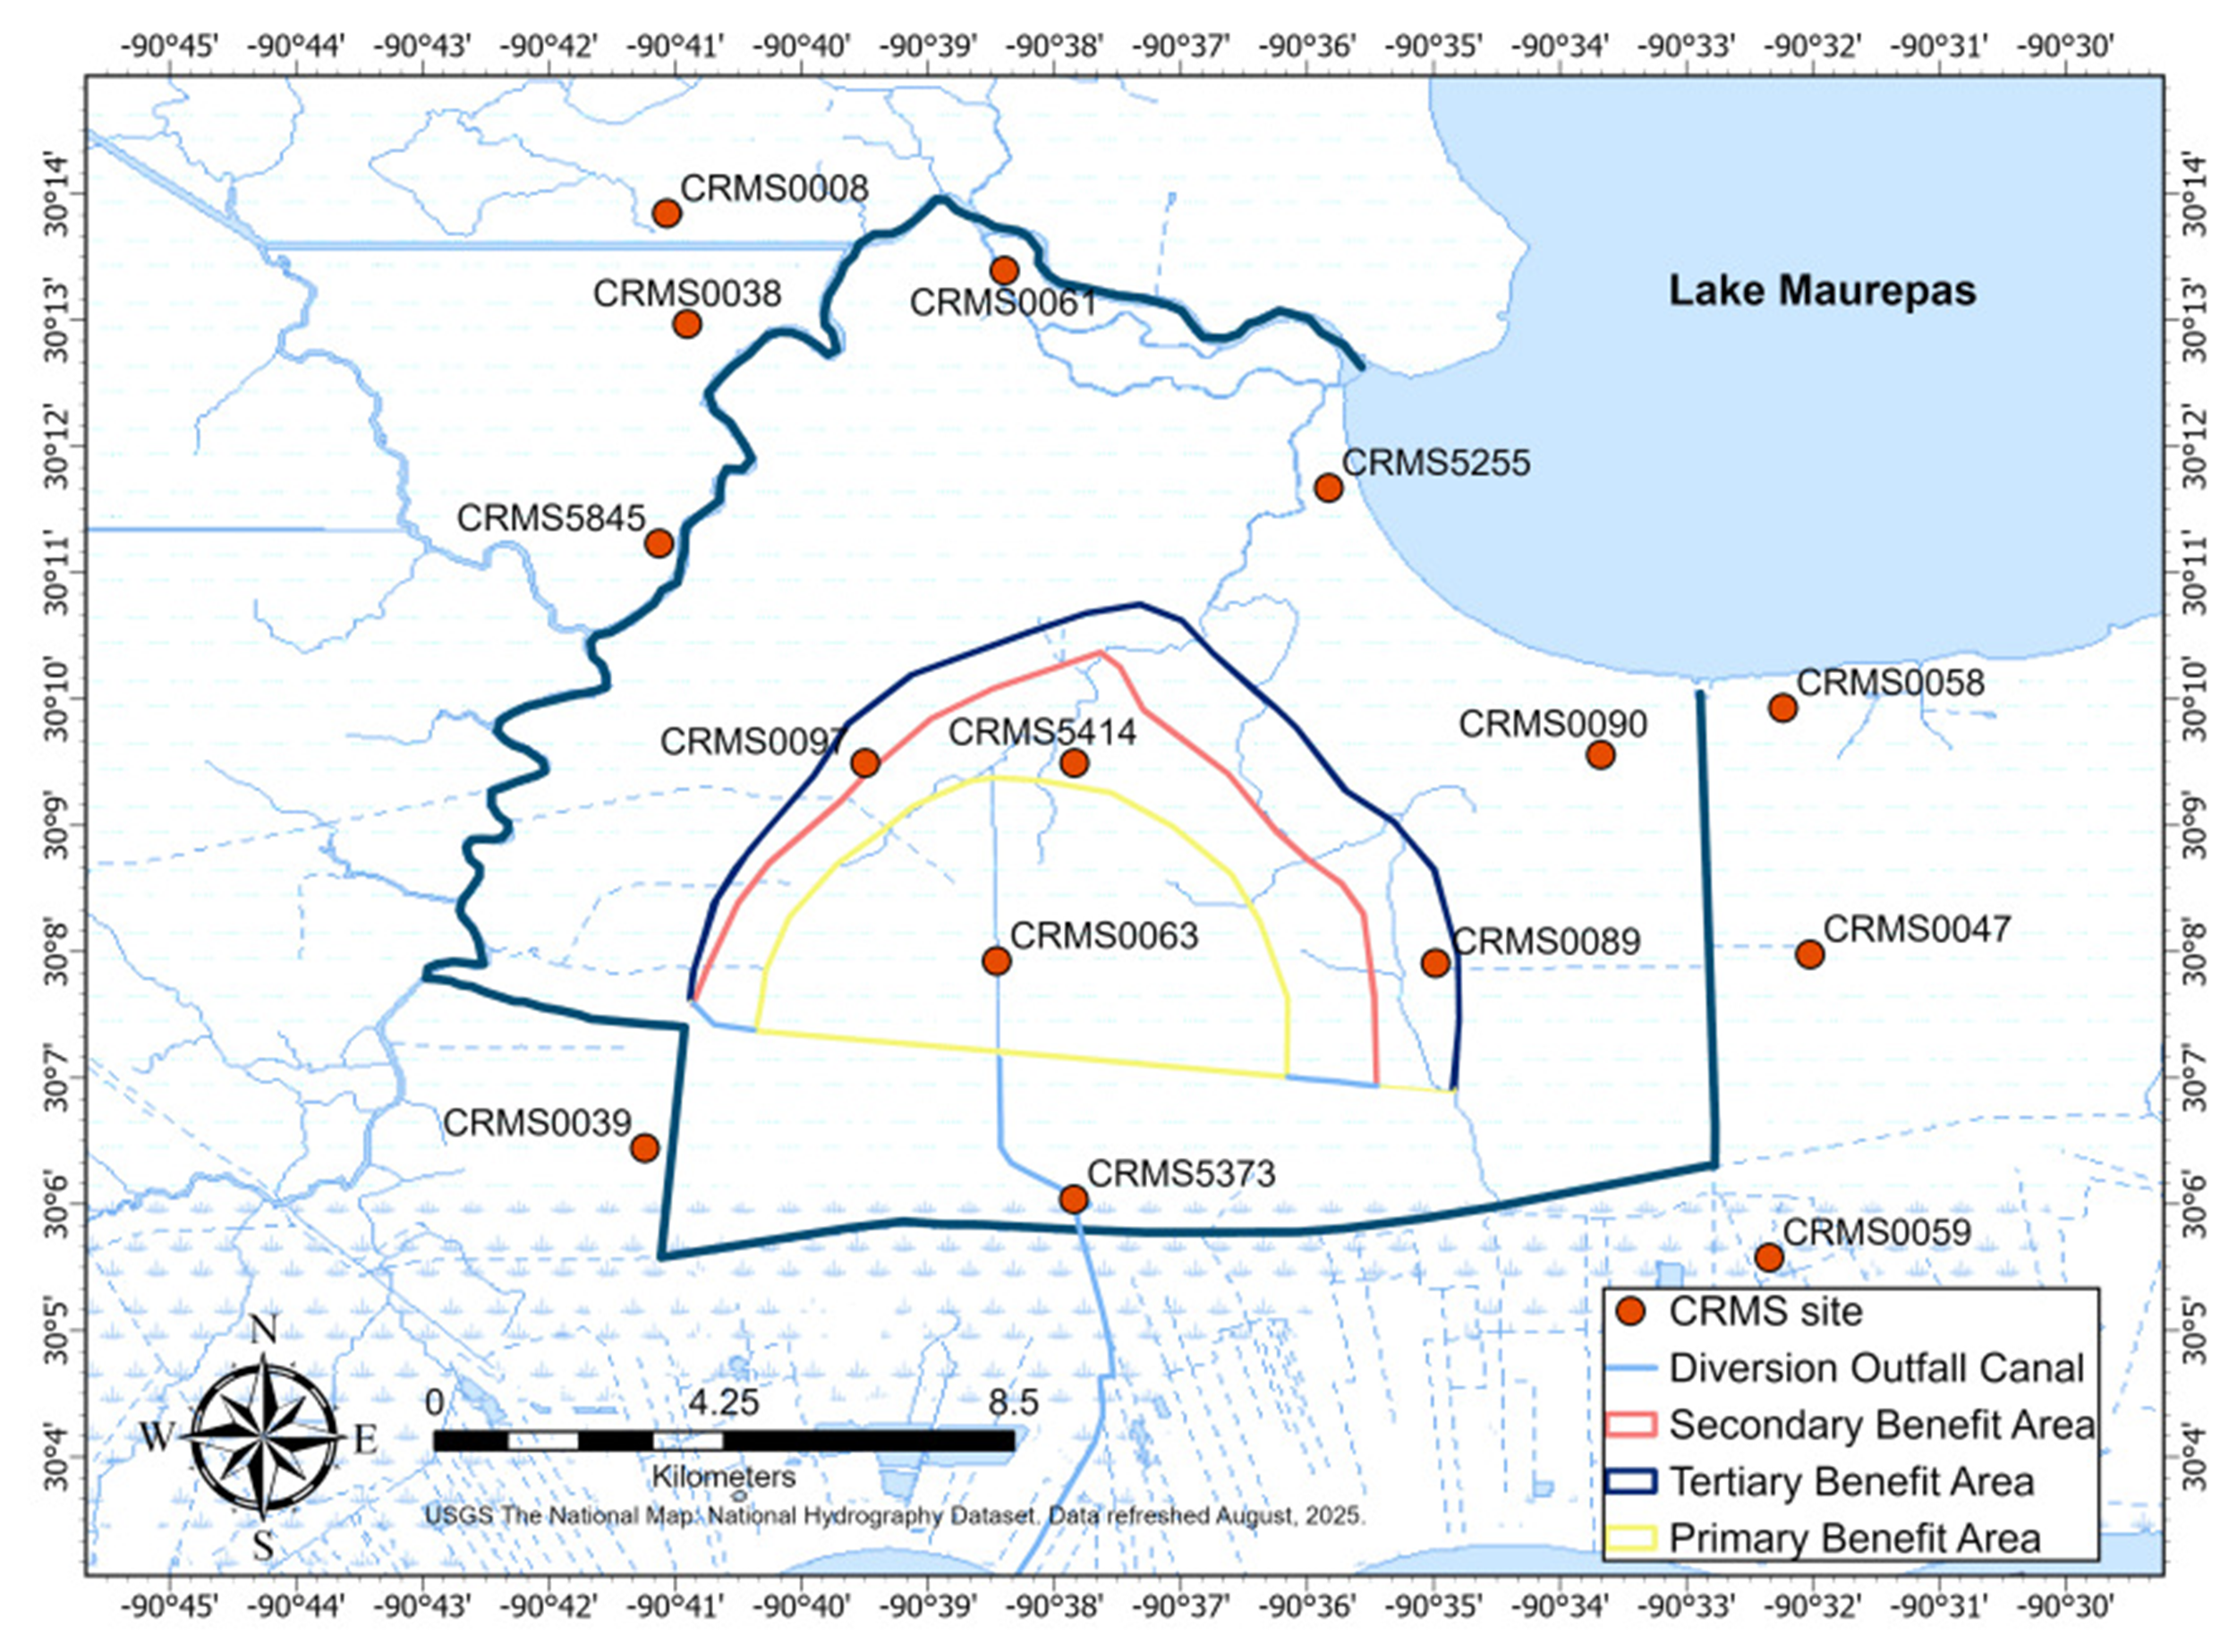
Maps of the study area and the selected sites in the Lake Maurepas swamp forests from the Coastwide Reference Monitoring System (CRMS) along coastal Louisiana. Diversion project area, channel and outfall area were provided by Louisiana Coastal Protection and Restoration Authority (CPRA). Image was provided by ESRI.
Model Description
A process-driven biogeochemistry model for low salinity tidal wetlands was used to examine the impacts of climate change-induced hydrologic change including drought, inundation, and SLR, and river diversion management on carbon fluxes in Lake Maurepas swamp forests. The biogeochemistry model is called Wetland Carbon Assessment Tool DeNitrification-DeComposition (WCAT-DNDC) model, which was based on the mangrove version of the DeNitrification-DeComposition (DNDC) model of mangrove carbon assessment tool (MCAT) (Dai et al. 2018) with necessary modifications to incorporate the impacts of salinity on plant production and soil organic matter decomposition at the low salinity (< 10 ppt) tidal forested wetlands (Wang et al. 2022). For example, the impacts of salinity on plant productivity, literfall, wood growth, soil organic matter decomposition, and methane emission were determined from field data collected from tidal swamps and freshwater marshes affected by salinity intrusion and incorporated in the WCAT-DNDC (Wang et al. 2022). The model was validated by comparison between simulated and observed litterfall, wood growth, root growth, soil respiration, soil organic carbon storage, methane and nitrous oxide emission at swamp forests in the floodplains of the Savannah and Waccamaw Rivers along the South Carolina and Georgia coasts (Wang et al. 2022, 2023a) and brackish marshes along the Gulf coast (Wang et al. 2024). Therefore, WCAT-DNDC is suitable for not only high salinity tidal wetlands such as mangrove forests, but also low salinity tidal wetlands. WCAT-DNDC consists of several sub-models, the main sub-models are hydrology, plant growth, soil organic matter, methanogenesis/methanotrophic activity, and nitrification/denitrification (Fig. 2). The drivers of WCAT-DNDC include climate, hydrology, soil, vegetation, and disturbance (Fig. 2). Therefore, the impacts of climate change induced SLR, warming, flooding, drought and wetland protection and restoration can be explored in WCAT-DNDC as scenario simulations. For details about WCAT-DNDC equations that describe these processes and critical model parameters, refer to Wang et al. (2022) and Dai et al. (2018). WCAT-DNDC is written in C/C++ and operates on a daily time step with summation to annual output. A spin up period of four years was adopted to reduce the influences of initial conditions (primarily soil salinity and water level) and numerical calculations on model stability. Soil depth was simulated to 50 cm below the soil surface.
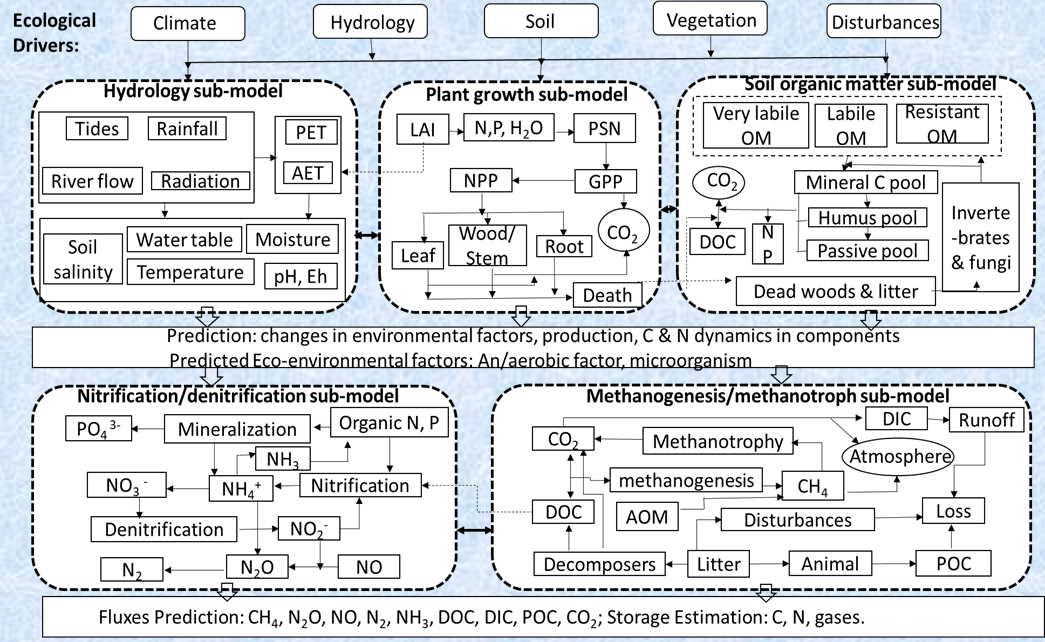
The framework of Wetlands Carbon Assessment Tool - DeNitrification-DeComposition (WCAT-DNDC) model. PET: potential evapotranspiration; AET: estimated actual evapotranspiration; PSN: photosynthesis; NPP: net primary production; GPP: gross primary production; Death: including fallen leaf tissue and dead wood; DIC: dissolved inorganic C; DOC: dissolved organic C; POC: particulate organic C; AOM: anaerobic oxidation of methane (modified from Dai et al. 2018).
Model Input and Output
Input data and sources are shown in Table 1. It should be noted that daily soil porewater salinities at these sites were simulated using a mass-balance-based soil salinity model (Wang et al. 2020). Input data for the soil salinity model includes daily air temperature, hourly rainfall, incoming tidal elevation, and surface water salinity. The soil salinity model for the swamp forests was calibrated using 2010 CRMS field soil porewater data and validated using 2023 CRMS field data. Comparisons between simulated and observed soil salinities (ranging from 0.2 to 2.2 ppt) for calibration (R2 = 0.82) and validation (R2 = 0.83) showed that simulated soil salinities are in good agreement with observations and the soil salinity model captured both the magnitude and seasonal pattern with relatively high accuracy. Output of WCAT-DNDC model for this study includes daily and annual rates of NPP, ER, NEE, CH4, and N2O. NEE was calculated as NEE = ER – GPP, therefore, positive values indicate net carbon release to the atmosphere while negative values indicate net carbon uptake.
Table 1.
Input data and sources for the WCAT-DNDC model simulations at the Lake Maurepas swamp forests.Model Validation and Performance
Validation of WCAT-DNDC model for the Lake Maurepas swamp forests were conducted using field data on wood growth and litterfall in 2010. Distribution of tree primary productivity was determined through the collection of annual litterfall and the measurement of annual tree diameter growth at 24 sites in Lake Maurepas swamp forests during 2000-2010 (Shaffer et al. 2003, 2016). Annual litterfall including leaves, flowers, fruits, and seeds was determined from five litterfall traps (0.25 m2 per trap) at each of two plots at the 24 sites (Shaffer et al. 2016). Each trap was constructed to catch biomass in a fine (1 mm) mesh approximately 1 meter above the ground to prevent loss from flooding events. Litterfall was collected frequently during site visits and the collected litterfall was then dried to constant mass at 65 °C (Shaffer et al. 2016). Wood biomass was derived from measured tree diameter (dbh > 5 cm). Each year during 2000-2010, tree diameter was used to calculate tree wood biomass using the regression formulas developed by Shaffer et al. (2016). Wood growth per tree was calculated as the difference in wood biomass per year, then summed by all trees (dbh > 5 cm) per plot to convert to total wood growth (Shaffer et al. 2016). Because the wood growth and litterfall data in 2010 were not available at each of the 12 CRMS sites, the 2010 total wood growth and total litterfall data were allocated into the three groups (throughput, relict, degraded) based on the distribution (decrease from throughput to relict to degraded) of the average of the two productivity variables during 2000-2010 in the three groups (Shaffer et al. 2016) with the assumption that the 2000-2010 average distribution also represented 2010 total wood growth and total litterfall data in the three groups. Then, the group-averaged wood growth and litterfall were interpolated for each of the 12 CRMS sites according to two gradients of forest productivity: decreasing from interior to near Lake Maurepas in the east-west direction and increasing from interior to near a freshwater source at Hope Canal in the north-south direction (Shaffer et al. 2003) to estimate site-specific wood growth and litterfall for model validation. For example, tree primary productivity decreased from approximately 1,200 g C m-2 yr-1 at site 12, to 1,000 g C m-2 yr-1 at site 11, to 600 g C m-2 yr-1 at site 10, to 300 g C m-2 yr-1 at site 8 (Fig. 1 in Shaffer et al. 2003), corresponding to CRMS5377, CRMS0063, CRMS0097, and CRMS5255 in this study, respectively (Fig. 1).
The performance of WCAT-DNDC in simulating carbon dynamics in MRDP forested wetlands was evaluated using coefficient of determination (R2), root mean square error (RMSE), and bias. Values for R2, RMSE and bias are calculated as:
where Oi and Pi are observed and simulated values at each time i; and are observed mean and simulated mean; n is the number of observations. The coefficient of determination measures the linear association between modeled and observed data; a high correlation coefficient is considered desirable. Typically values greater than 0.5 are considered acceptable (Bellocchi et al. 2010). RMSE describes the residual difference between model performance and actual data; a good model has low RMSE values. Bias is the average of the difference between modeled and observed values; a good model exhibits low bias.Scenario Design
The validated WCAT-DNDC model was used to examine the trend and variability in carbon fluxes at the forested wetland sites in Lake Maurepas area under average, wet and dry conditions as well as hypothetical sea-level rise and freshwater diversion scenarios. Average, wet, and dry years in this study were determined by the Palmer Drought Severity Index (PDSI) for the Northeast Division of Coastal Louisiana during 2001 – 2023. Year 2019 was determined to represent average years, Year 2021 (third heaviest precipitation year on record) represents wet years, and Year 2011 represents dry years. Statistical summaries of soil salinity and water table depth are shown in Table 2. It should be noted that although 2021 was defined as a wet year based on PDSI with Hurricane Ida episodic impact of high-water level on August 30, 2021, the water level in January 2021 was lower than that in 2019 (the average year) at some CRMS sites (e.g. CRMS0058, CRMS3913, CRMS0089, and CRMS0059). This resulted in relatively higher simulated soil salinity in the wet year (2021) than the average year (2019). Discrete CRMS soil salinity data also showed this higher salinity in early months of 2021 (Table 2). Compared to the average year (2019), average water table depth increased but soil salinity decreased in the wet year (2021) whereas average water table depth decreased but soil salinity increased in the dry year (2011), which can be used to represent a drought-induced saltwater intrusion event in the Lake Maurepas swamp forests.
There are fundamental differences between salinity increases from drought events and salinity increases from the persistent SLR. Drought events result in temporary salinity increases with large salinity variations whereas the persistent SLR causes gradual and continuous salinity increases with less salinity variations but lasting impact on coastal wetlands. Since the dry year did not represent increases in both soil salinity and water table depth under SLR and saltwater intrusion, we added two hypothetical SLR cases for scenario simulations. A low SLR of 0.27 m (SLR1) and a relatively high SLR of 0.50 m (SLR2) over the next 50 years were added to the water table depth of an average year based on previous studies on SLR in MRDP (Wang et al. 2017; Baustian et al. 2018). For the low SLR scenario, soil salinity in the dry year (2011, range of average salinity: 0.54 – 1.63 ppt, range of maximum salinity: 0.68 – 1.74 ppt, Table 2) was used. For the high SLR scenario, we assumed that salinity in this swamp forest area could be reflected by the observed historical high salinities. It was observed that historical high salinities in the swamp occurred in the range of 2.0 – 5.0 ppt (maximum 8.0 ppt at sites on Jones Island, east of Lake Maurepas) during the 2000 severe drought condition in the Lake Maurepas swamp area, which is three times higher than that in other years during 2000 – 2010 (Shaffer et al. 2003; Hoeppner et al. 2008; URS 2014; Shaffer et al. 2016). Furthermore, it was observed that soil salinity in the baldcypress swamp area, south of Lake Pontchartrain, ranged 4 – 8 ppt with the highest salinity in Fall season (Hunter et al. 2016). After multiplying the salinity in the dry year (2011) by the multiplier (3x), the salinity magnitude and temporal pattern were close to the observed historical high salinity (2.0 – 8.0 ppt) in this area as well as the high salinities observed in the tidal swamp forests along the Southeast Coast with rising sea level (e.g., Wang et al. 2020, 2022).
A freshwater diversion case was also designed. The River Reintroduction into the Maurepas Swamp project has the capacity of delivering up to 56.6 m3 s-1 of freshwater, sediment, and nutrients to freshen a nearly 182 km2 section of the Lake Maurepas swamp through a 8.85 km controlled-flow path (Hope Canal) (CPRA, https://coastal.la.gov/wp-content/uploads/2023/04/Maurepas-Swamp-Final-Full-Fact-Sheet.pdf). The expected annual operational period for the diversion would be between January 1 and July 1 (USACE 2022). The hydrodynamic modeling predicted water levels to rise by less than 0.08 m with diversions ranging from 14.2 to 70.8 m3 s-1 and Lake Maurepas salinity would be reduced by 30% after only one month (URS 2014). Therefore, 0.08 m was added to the water table depth and soil salinity was reduced by 30% during January 1 to July 1 in the average year for the diversion scenario. Climate data in the average year was used for the two SLR and freshwater diversion scenarios.
Statistical Analysis
The impacts of drought, inundation, SLR and MR diversion restoration on simulated daily carbon and GHG fluxes (NEE, NPP, ER, CH4, N2O) at the 12 swamp sites were analyzed using two-way ANOVA with site and scenario and their interaction as explanatory variables. When necessary, the simulation results were transformed using the Box-Cox method prior to analysis to meet normality and homoscedasticity assumptions. The SAS 9.3 software package (SAS Institute, Cary, North Carolina, USA) was used for statistical analyses. All the tests were two-tailed based on type III sums of squares (SS) and considered significant at p < 0.05.
Table 2.
Statistical summary (average, maximum, minimum, and standard deviation) of the daily soil water table depth and soil salinity in an average year (2019), wet year (2021), and dry year (2011) at the forested wetlands sites (degraded, relict, and throughput) in the Lake Maurepas area.Results
Model Performance
The observed wood growth and litterfall in 2010 at the Lake Maurepas swamp forest sites were 27 to 274 g C m-2 yr-1 and 68 to 698 g C m-2 yr-1 while the simulated values were 72 to 210 g C m-2 yr-1 and 217 to 583 g C m-2 yr-1. Both simulated and observed litterfall exceeded wood growth. Simulated wood growth and litterfall were in good agreement with observed values with R2 values of 0.95 (Fig. 3a) and 0.90 for wood growth and litterfall (Fig. 3b), respectively. The WCAT-DNDC model tended to overestimate wood growth (bias = 16.2 g C m-2 yr-1 and RMSE = 39.8 g C m-2 yr-1, Fig. 3a) whereas the model tended to underestimate litterfall (bias = -1.8 g C m-2 yr-1 and RMSE = 127.2 g C m-2 yr-1, Fig. 3b). Overall, model validation indicated that WCAT-DNDC captured the biogeochemical processes in the Lake Maurepas swamp forests especially the primary productivity and can be used to examine the impacts of various hydrologic management outcomes on carbon fluxes and GHG emissions in the tidal forested wetlands.
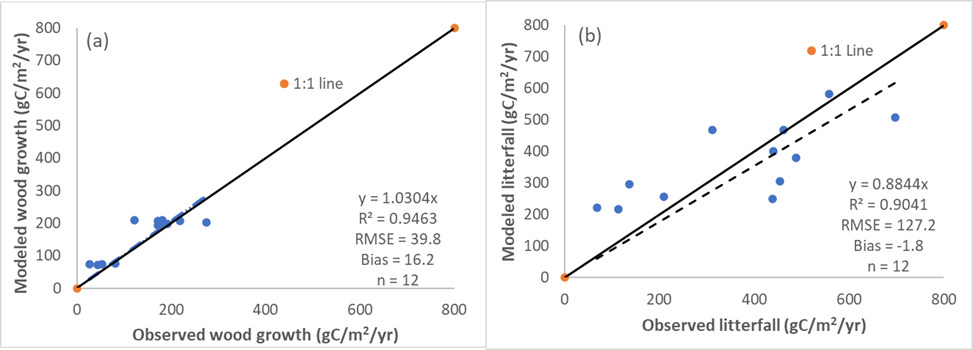
Comparisons between simulated and observed wood growth (a) and litterfall (b) in 2010 in the Lake Maurepas swamp forests. The dotted lines are the regression lines between the observed and simulated variables.
Spatial Variability in Carbon Fluxes and N2O emission
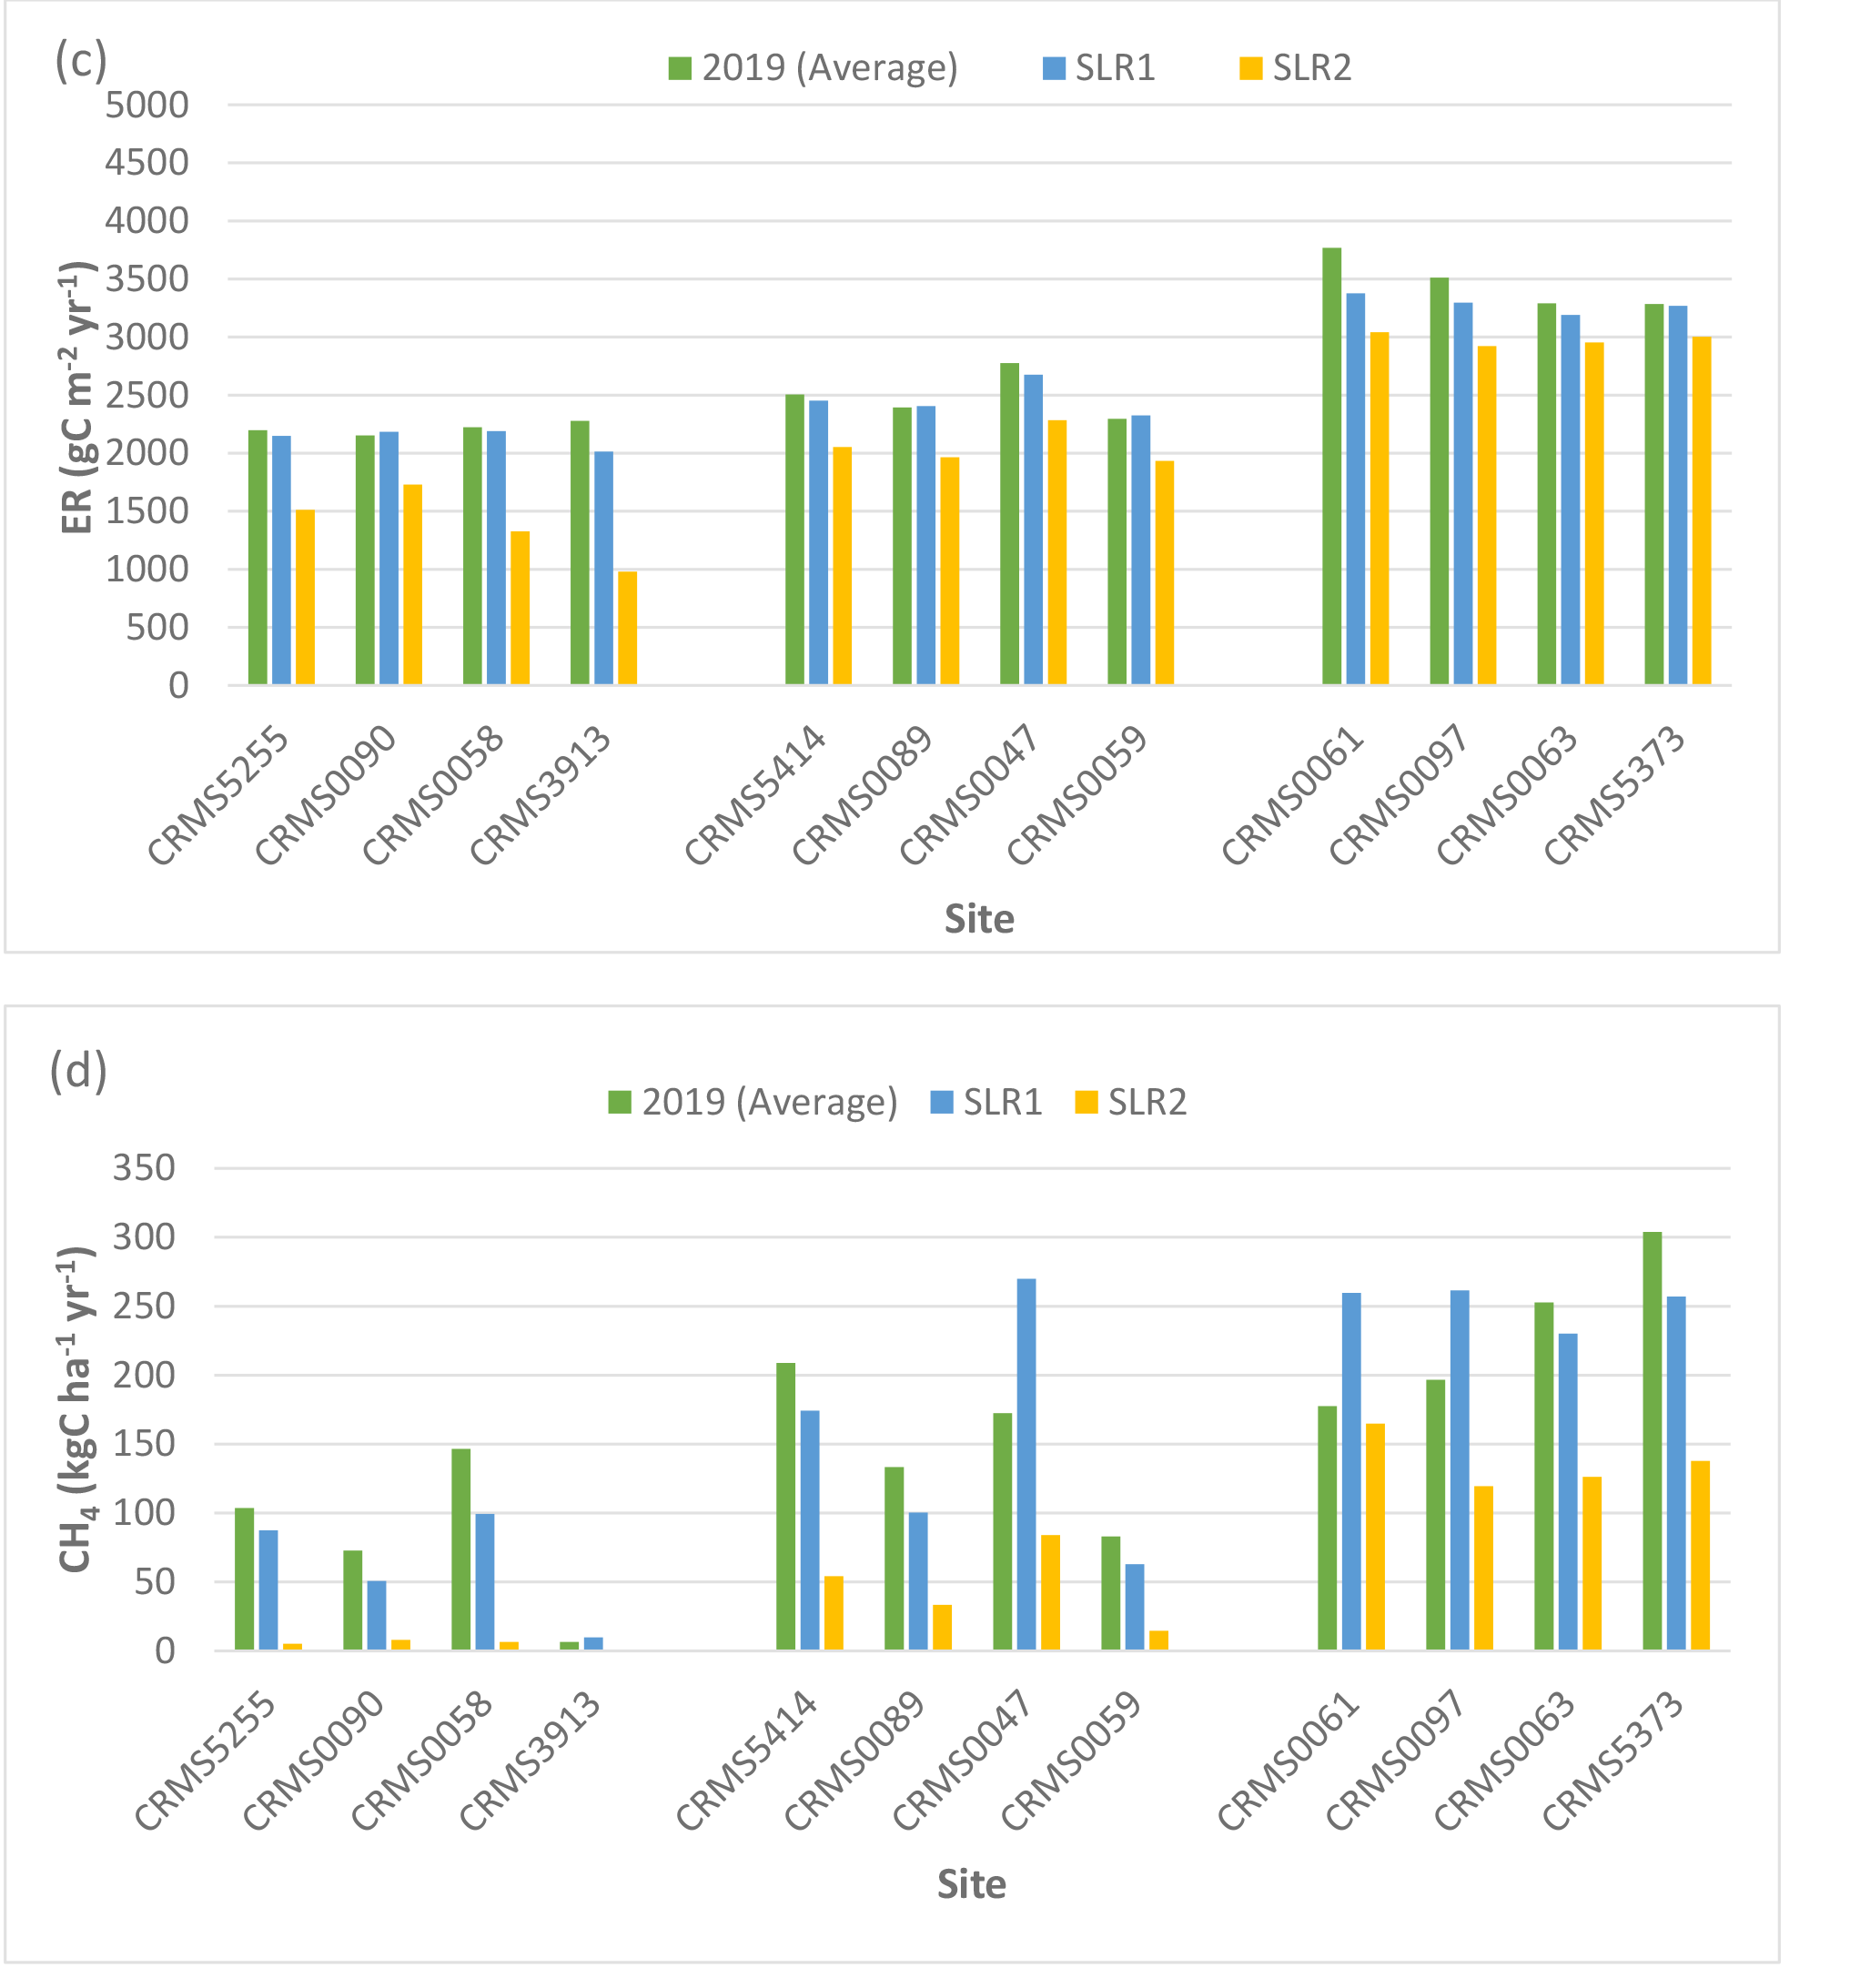
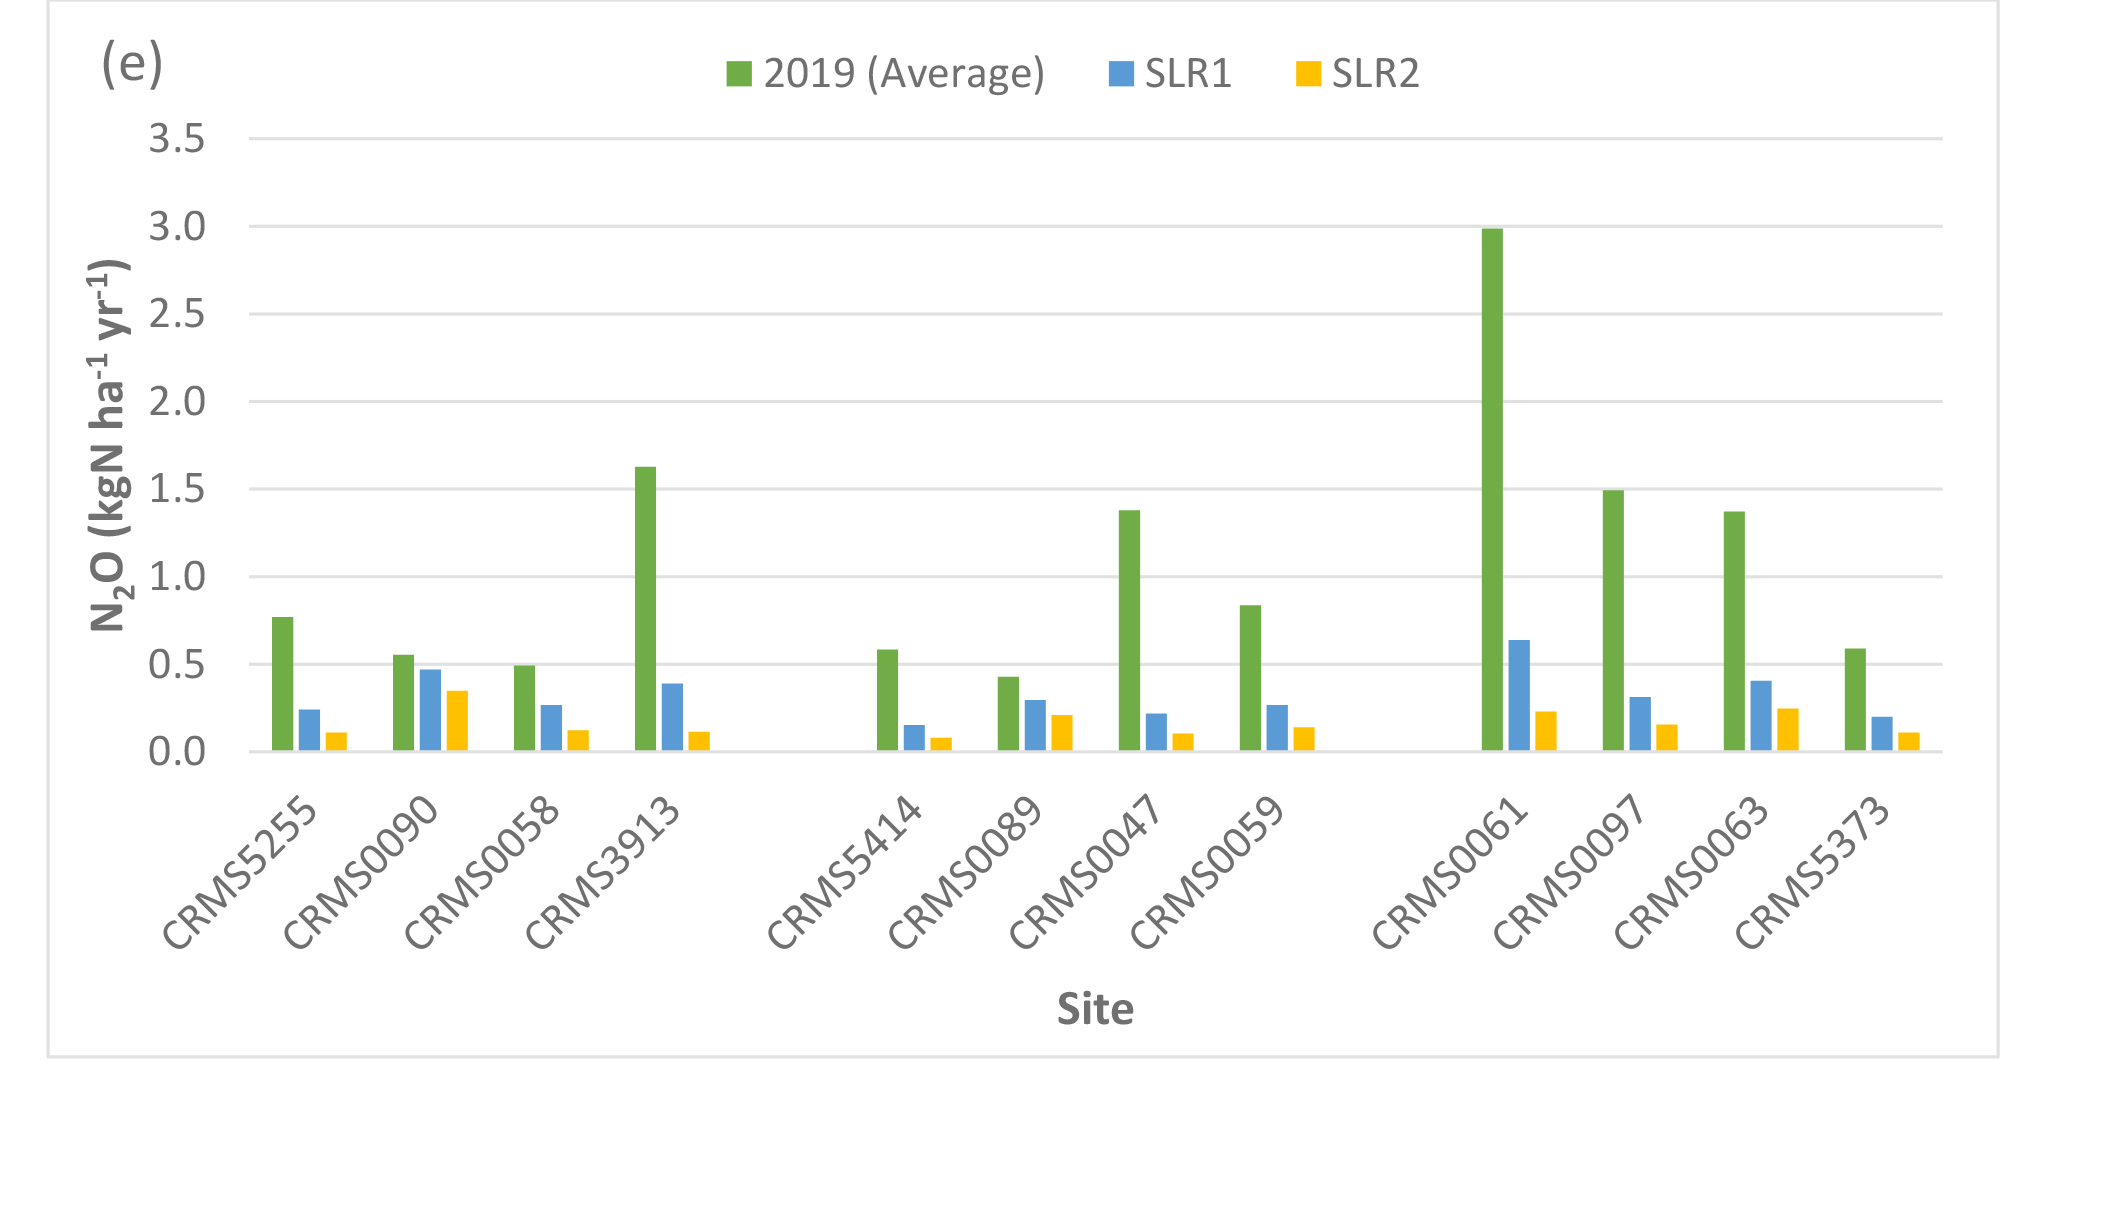
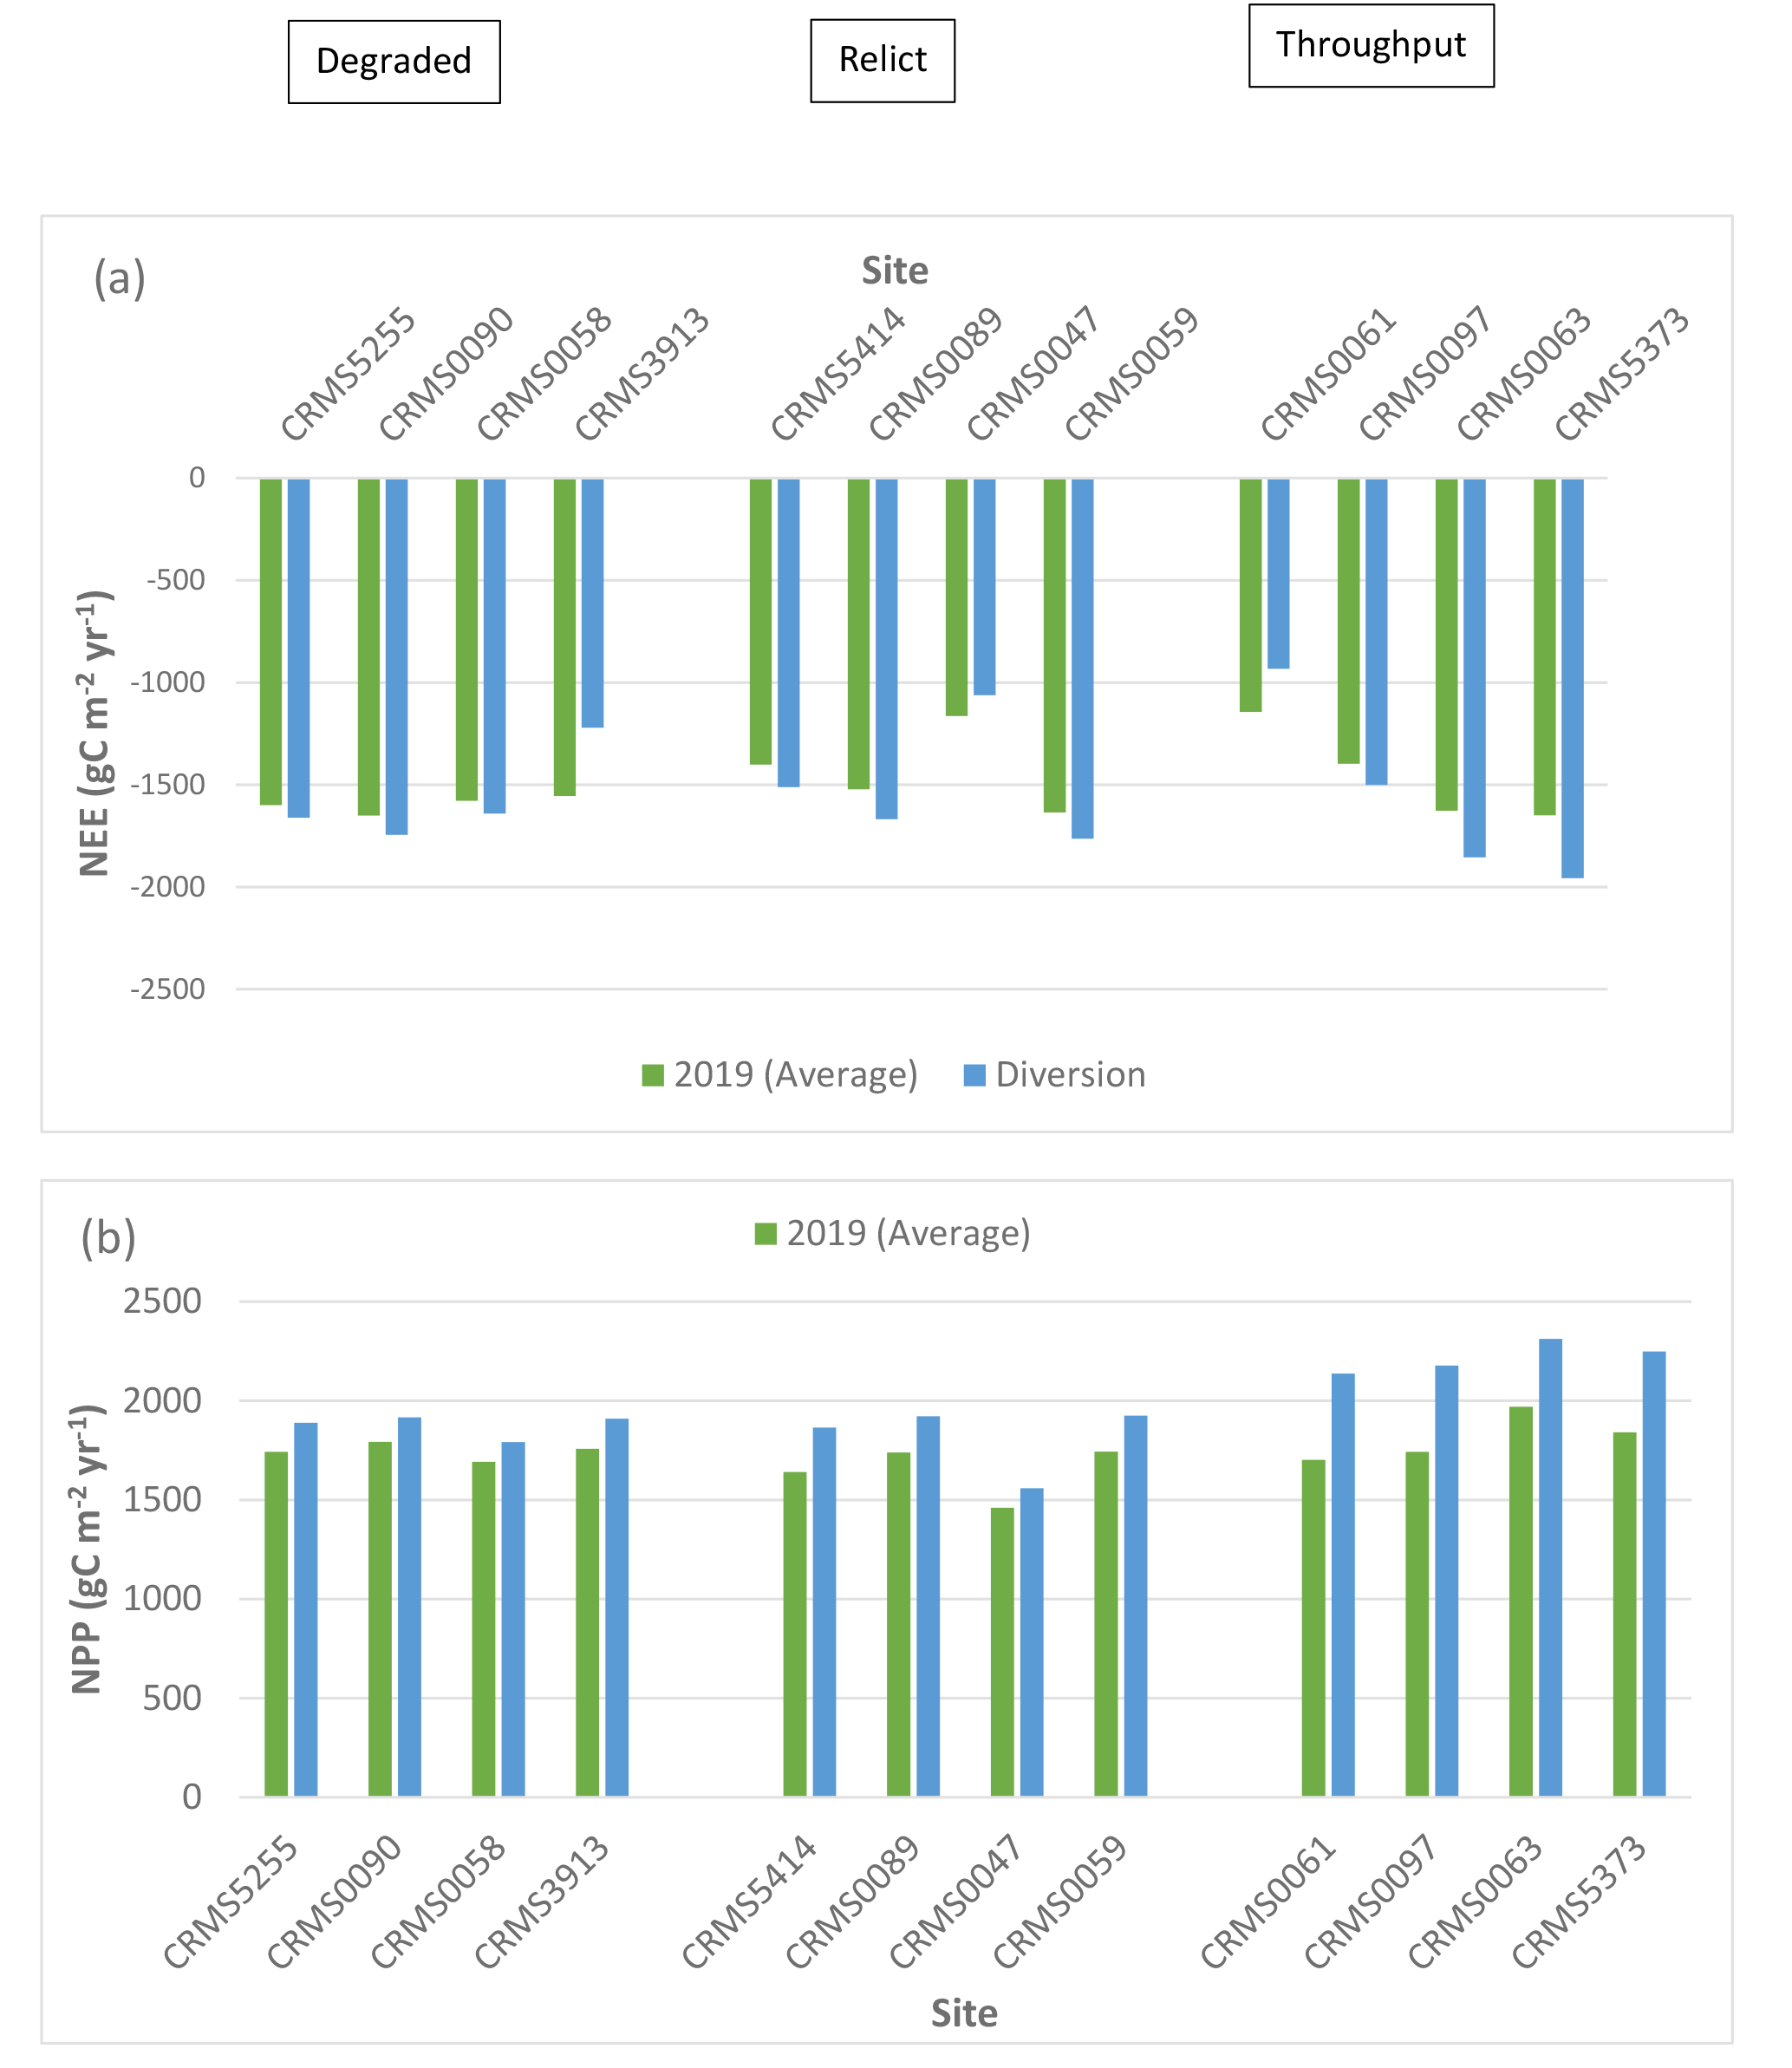
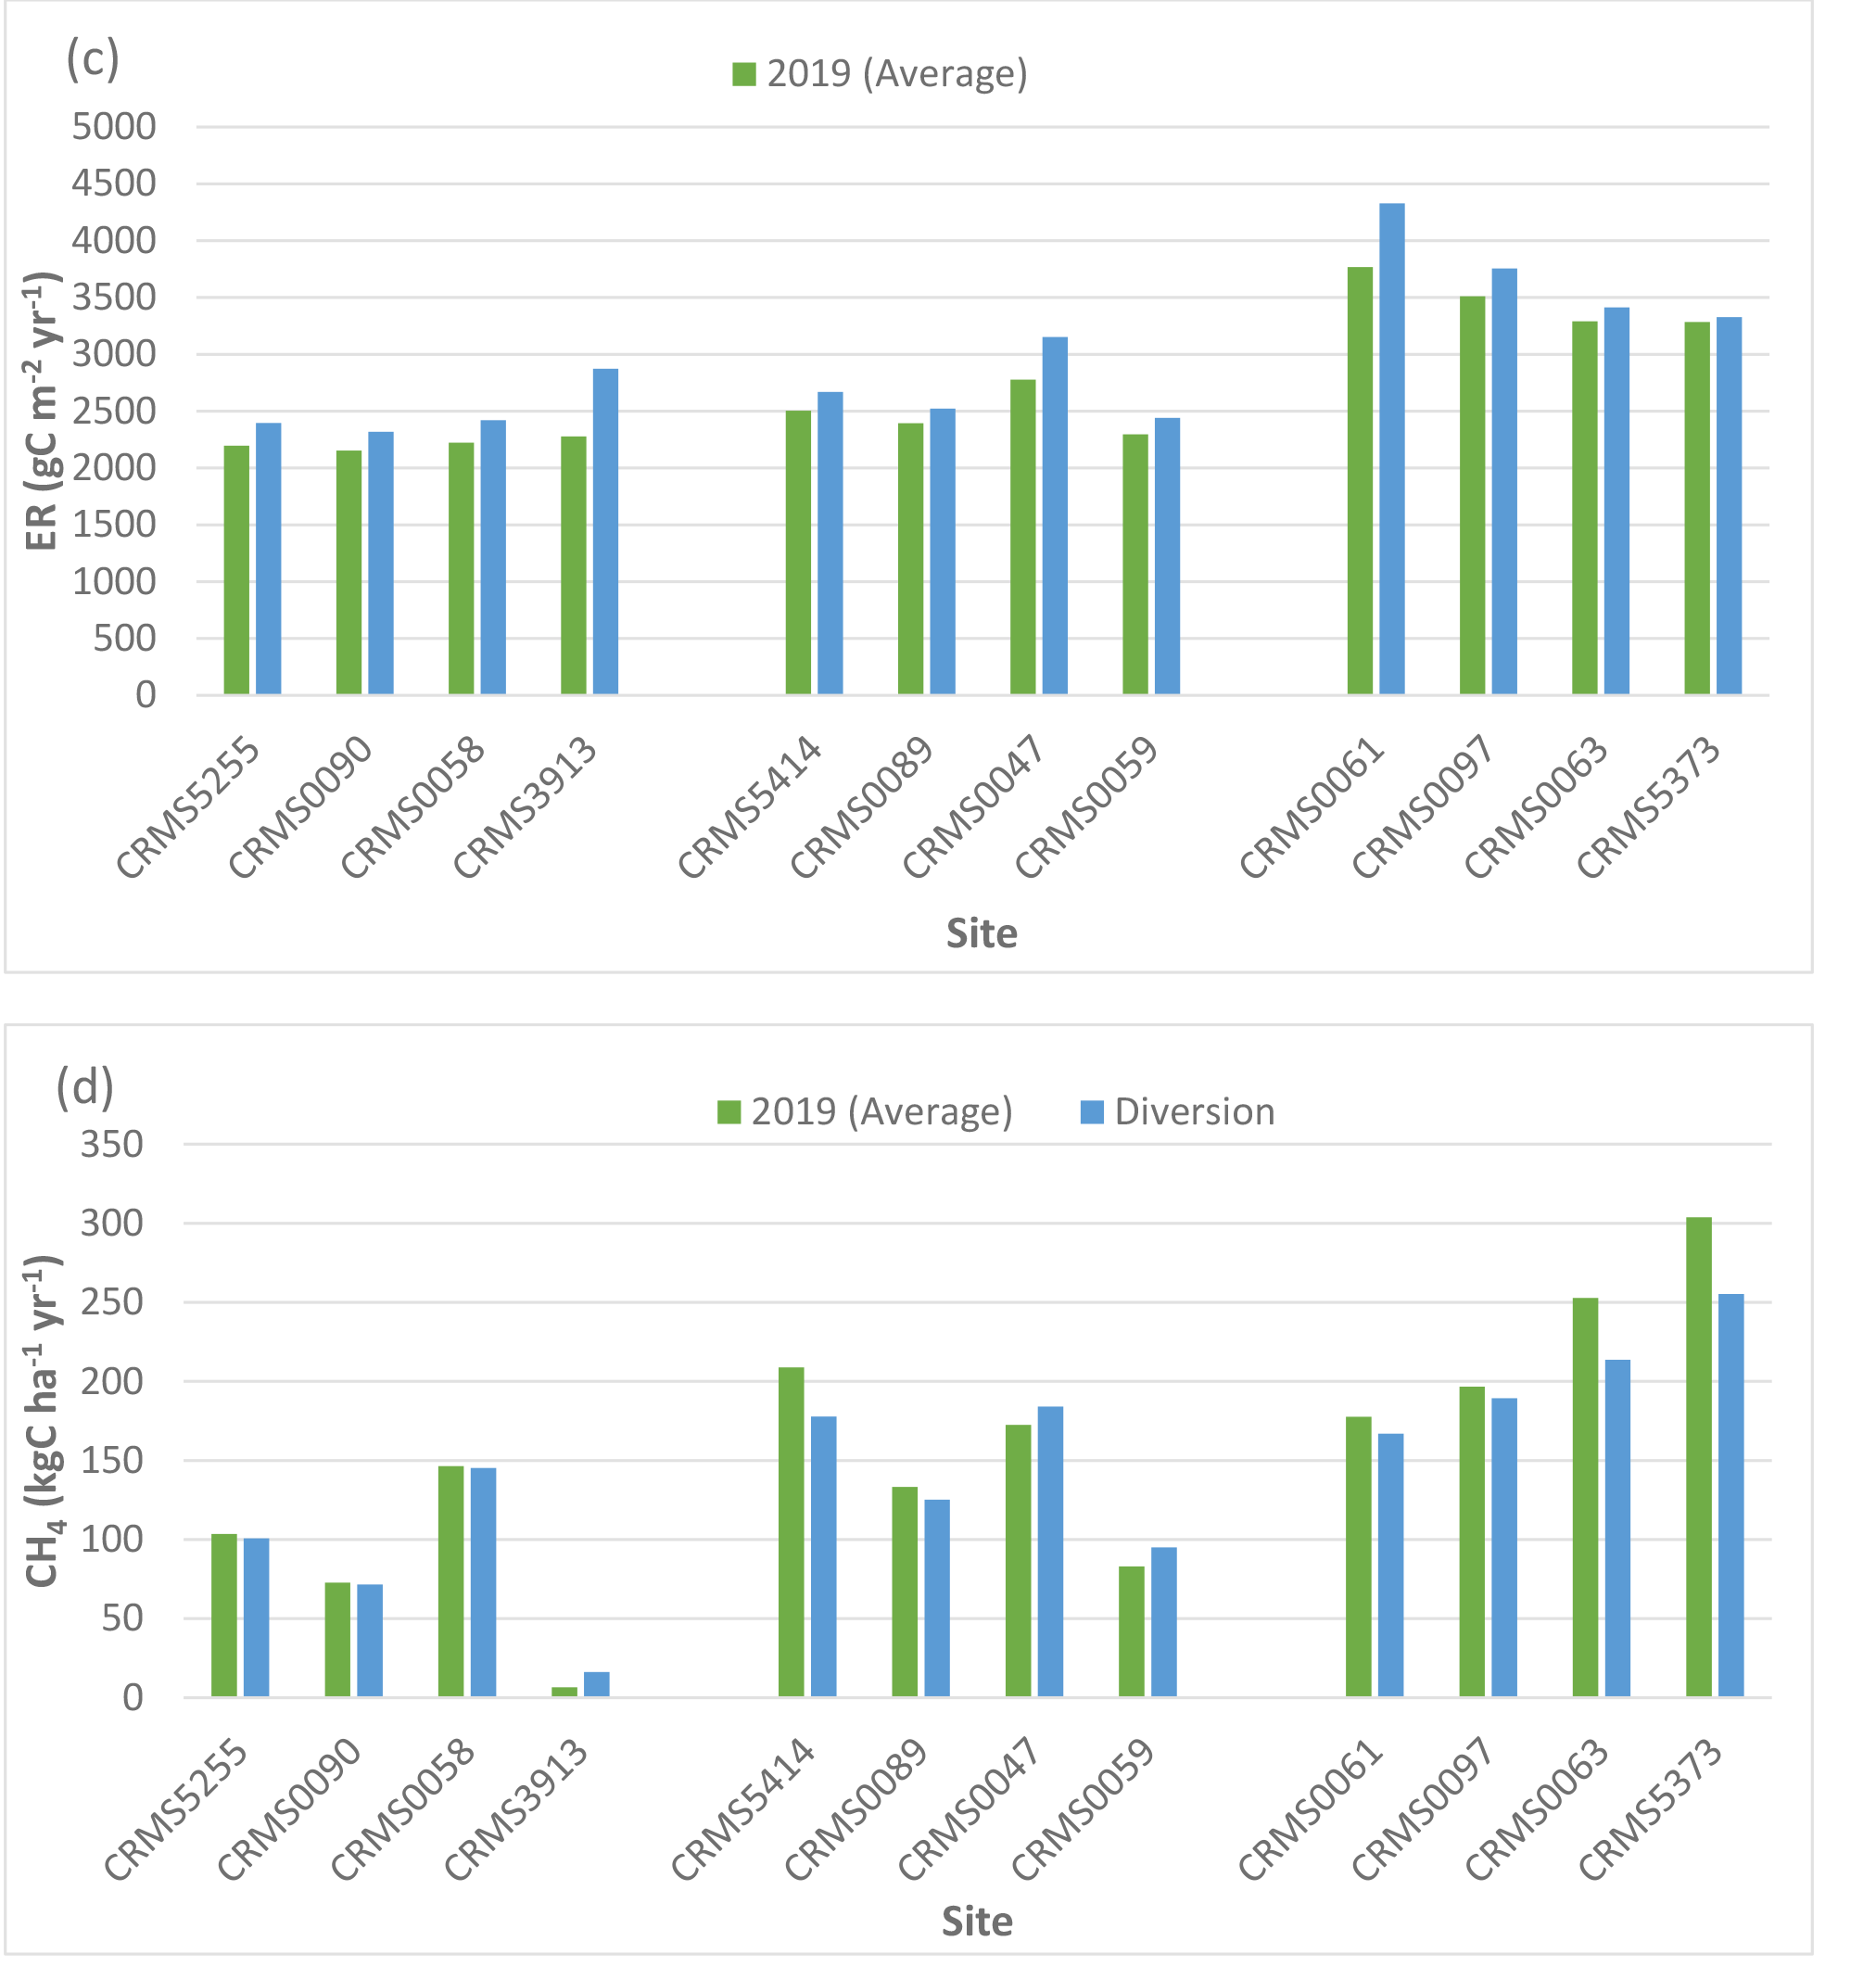
NEE, NPP, ER, CH4 fluxes, and N2O fluxes differed significantly by site (two-way ANOVA, p < 0.0001), suggesting spatial variability in carbon fluxes and GHG emissions in the Lake Maurepas forested wetlands. NEE values at all 12 sites were negative (range: -1,143 to -1,650 g C m-2 yr-1, average: -1,493.5 g C m-2 yr-1, standard deviation: 173.1 g C m-2 yr-1) (Table 3, Fig. 4a), indicating that Lake Maurepas swamp forests were significant sinks of atmospheric carbon dioxide. NPP ranged from 1,460 to 1,970 g C m-2 yr-1 and the highest NPP occurred at a throughput site CRMS0063 whereas lowest NPP was found at a relict site, CRMS0047 (Fig. 1, Table 3, Fig. 4b), demonstrating the decreasing trend of NPP from throughput sites to the degraded and relict sites. The highest ER (3,769 g C m-2 yr-1, or 13,832 g CO2-eq m-2 yr-1) also occurred at a throughput site, CRMS0061, whereas the lowest ER (2,154 g C m-2 yr-1, or 7,905 g CO2-eq m-2 yr-1) was found at a degraded site, CRMS0090 (Table 3, Fig. 4c).The highest ER led to the lowest NEE (-1,143 g C m-2 yr-1) at the throughput site CRMS0061 compared to the highest NEE (-1,650 g C m-2 yr-1) at the degraded site CRMS0090 (Fig. 1), where a mix of forest and marsh prevailed. Highest CH4 emissions (304 kg C ha-1 yr-1, or 1,013 g CO2-eq m-2 yr-1) were found at a throughput site, CRMS 5373; whereas the lowest CH4 emissions (6 kg C ha-1 yr-1, or 20 g CO2-eq m-2 yr-1) occurred at the degraded site, CRMS3913 (Table 4, Fig. 4d), showing a decreasing CH4 gradient from sites close to river freshwater source to sites close to the lake. Similarly, the highest N2O emissions (2.99 kg N ha-1 yr-1, or 140 g CO2-eq m-2 yr-1) occurred at the throughput site, CRMS0061, whereas the lowest N2O emissions (0.43 kg N ha-1 yr-1, or 20 g CO2-eq m-2 yr-1) occurred at a relict site, CRMS0089 (Table 4, Fig. 4e), indicating a significant impact of river water and nutrients on N2O emissions.
Impacts of Climate Change Induced Drought and Inundation
Two-way ANOVA tests on climate change-induced drought and inundation indicated significant “scenario” (p < 0.001) and “site × scenario” effects (p < 0.05) for NEE, NPP, ER, CH4 fluxes, and N2O fluxes. Simulations had all sites in Lake Maurepas swamp forests serving as sinks of atmospheric carbon dioxide regardless of hydrologic condition as evidenced by negative NEE values. However, statistical analysis of simulation results demonstrated that climate change induced drought and flooding significantly affected the capability of the swamp forests to serve as CO2 sinks. The responses of NEE, NPP, ER, CH4 flux, and N2O flux, including the direction and magnitude of the changes imposed by hydrological regime change, varied significantly among forested wetland sites.
Compared to the average year, NEE decreased significantly at 10 out of the 12 sites (except increased at CRMS0090 and CRMS0061) by an average of -26.2% (range: -9.7 to -83.6%, standard deviation (sd): 21%) in the simulated dry year whereas NEE increased at all 12 sites by an average of 20.6% (range: 14.2 to 33%, sd: 5.6%) in the simulated wet year (Table 3, Fig. 4a). NPP changed little in the dry year (i.e., decreased at 6 sites with an average of -0.8% and increased for the remaining 6 sites by an average of 3%); whereas NPP increased at all sites with an average of 16.4% (range: 12.3 to 23.1%, sd: 3.1%) in the wet year (Table 3, Fig. 4b). ER increased at 7 sites with an average of 14% (range: 1.5 to 53%, sd: 16.6%) in the dry year, and ER decreased at the remaining sites with an average of -4.4% (range: 0.7 to 9.8%, sd: 3.5%) also in the dry year (Fig. 4c). In contrast, ER decreased consistently across sites with an average of -4.5% (range: -2.5 to -8%, sd: 1.5%) in the wet year (Table 3, Fig. 4c). Across all the sites, NEE was reduced in the dry year mainly due to the general increase in ER, but NEE was enhanced in the wet year due to both increased NPP and reduced ER.
Compared to the average year, CH4 emissions decreased significantly (p < 0.0001) at all sites with an average of -66% (range: -6 to -158%, sd: 39.8%) in the dry year (Fig. 4d). CH4 emissions generally increased by 26% (sd: 70,6%) across sites in the wet year, with the highest increase (256%) at CRMS3913, a degraded swamp forest site located near the south rim of Lake Maurepas (Fig. 1, Table 4, Fig. 4d). A slight decrease in CH4 emissions (-6.5%, range: -2.5 to -10%, sd: 2.5%) was also found in the wet year at the throughput and relict sites, suggesting a bi-directional trend of CH4 emissions under inundation. Unlike CH4, substantial increases in N2O emissions (average: 350.6%, range: 41-1,006%, sd: 262.4%) were found at all but one site (CRMS0090, -4.7%) in the dry year; whereas N2O emissions generally decreased across sites (except CRMS0061 and CRMS0090) by an average of -27% (range: 5.7 to -50.5%) in the wet year (Table 4, Fig. 4e).
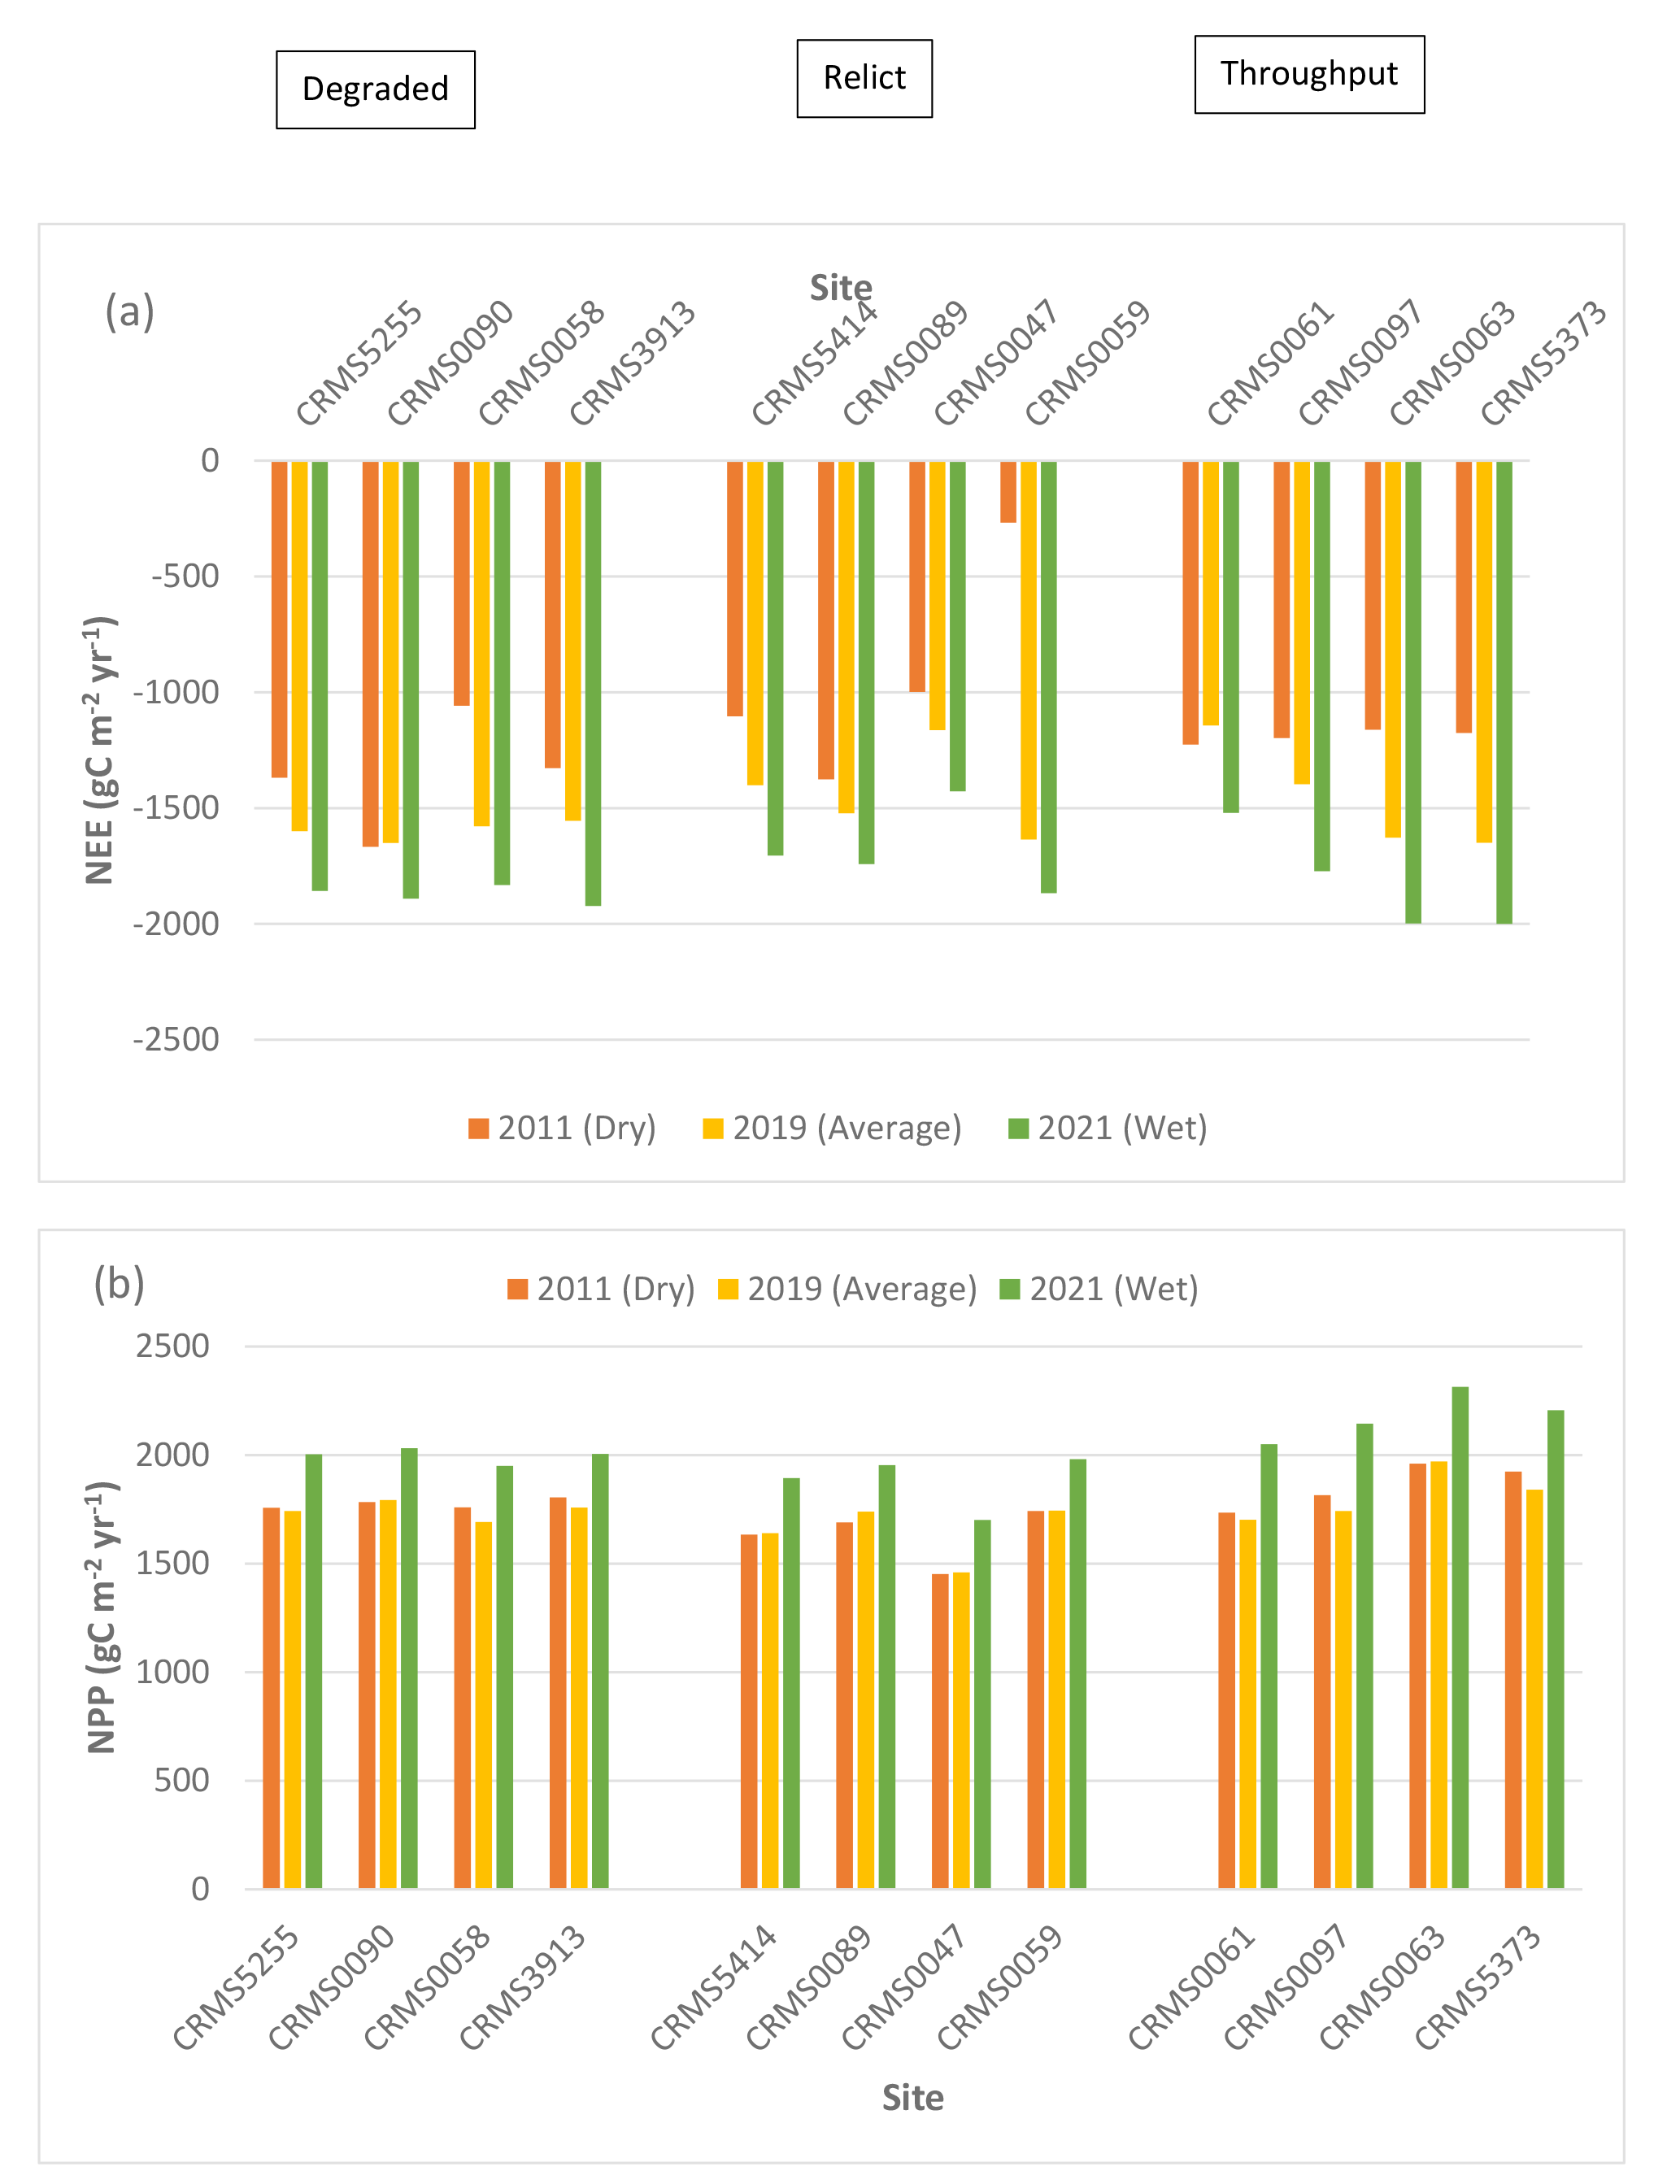
Simulated net ecosystem exchange (NEE) (a), net primary productivity (NPP) (b), ecosystem respiration (ER) (c), methane (CH4) (d), and nitrous oxide (N2O) (e) emissions under the average, dry and wet conditions in the Lake Maurepas swamp forest sites (degraded, relict, and throughput).
Table 3.
Simulated net ecosystem exchange (NEE), net primary productivity (NPP), and ecosystem respiration (ER) under the average year (represented by 2019) and change (%) under scenarios of dry, wet, sea-level rise (low: SLR1, high: SLR2), and the diversion compared to the average year in Lake Maurepas swamp forests (sd = standard deviation).Impacts of SLR
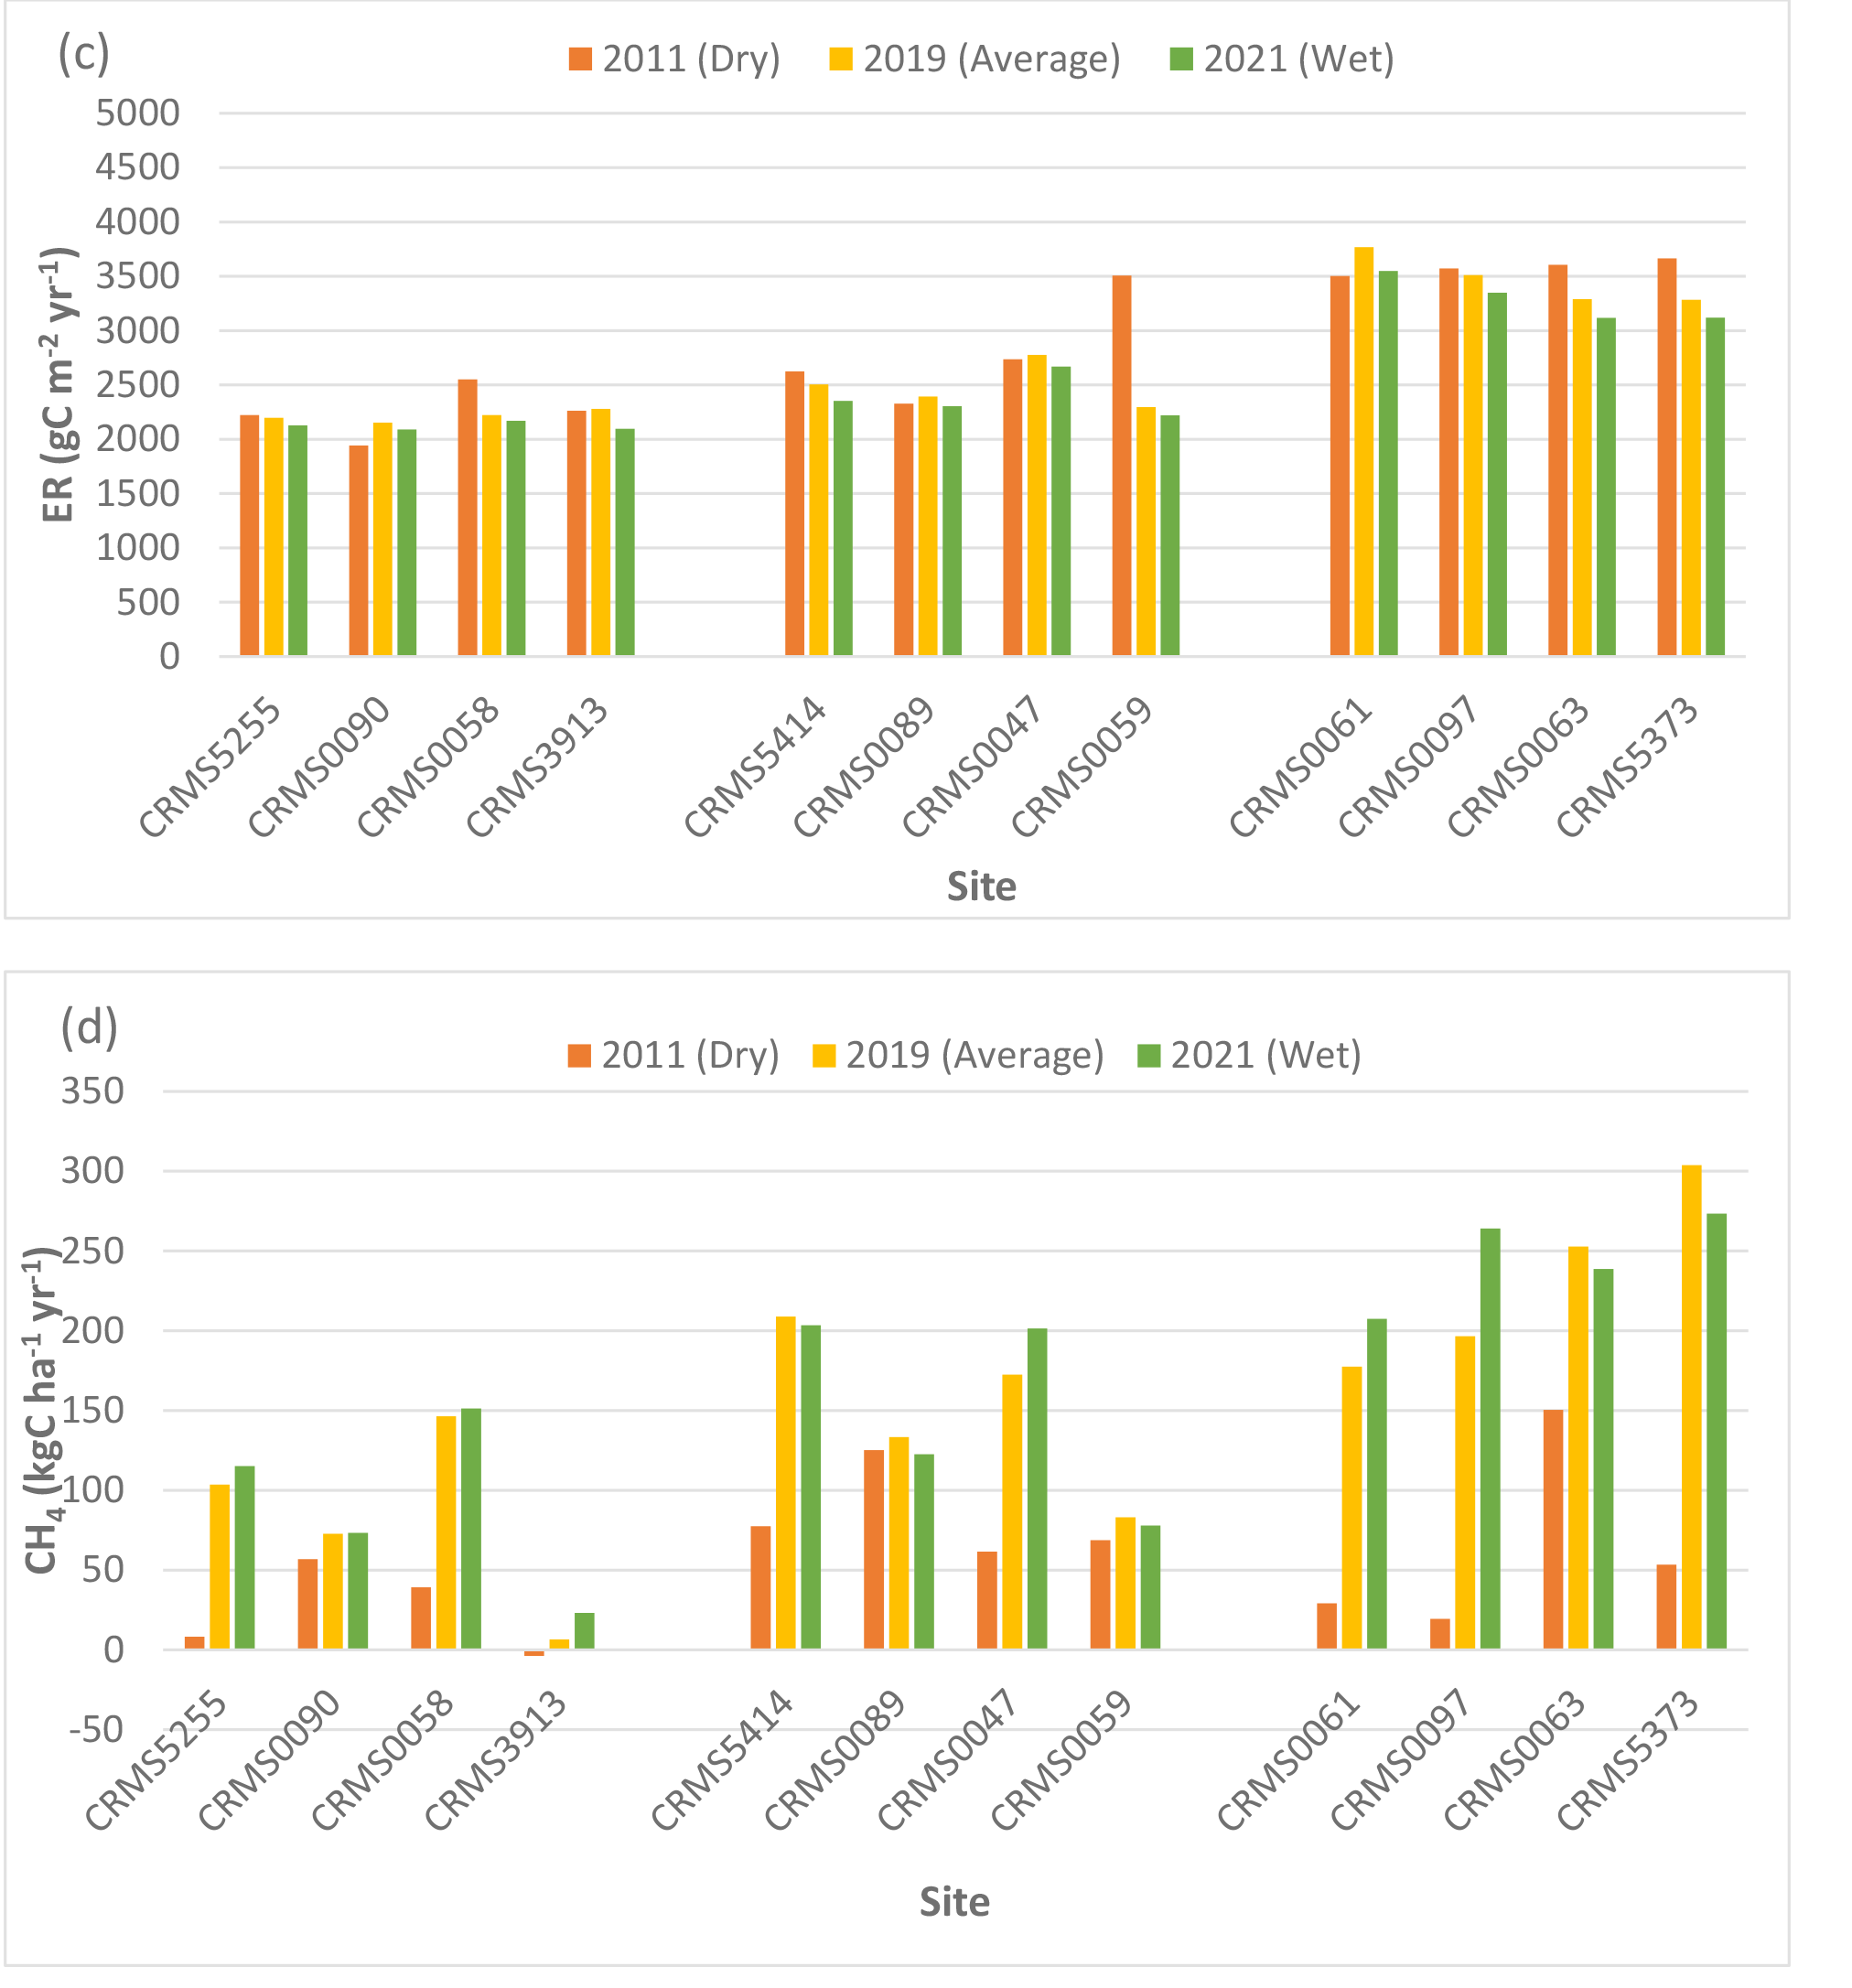
Two-way ANOVA tests of SLR scenarios showed that there were significant “scenario” (p < 0.0001) and “site × scenario” effects (p < 0.05) for NEE, NPP, ER, CH4 fluxes, and N2O fluxes, indicating that rising sea level and associated increase in salinity especially the high SLR scenario would affect carbon fluxes across the Lake Maurepas swamp forests. Simulated NEE showed that high SLR (SLR2: +0.5m, salinity = 3x dry year’s salinity) significantly reduced the capability of the swamp forests to maintain their sink capacity for atmospheric CO2 in the degraded and relict sites (averaged reduction by -29% ranging from -14 to -56%), but high SLR enhanced the carbon sink capacity in throughput sites (by an average of 14.3% ranging from approximate 2 – 36%) compared to the average year without increases in sea level and salinity (Table 3, Fig. 5). NPP increased at the throughput sites under both SLR scenarios (average: 7%, range: 0.2 to 12%) but declined at the degraded and relict sites (e.g. -58% decrease at CRMS3913) under the high SLR scenario (Table 3, Fig. 5). ER generally decreased at all sites especially under the high SLR scenario by -22.7% (range: -9 to -57%, sd: 13.2%) compared to the low SLR (SLR1) scenario by -3.2% (range: -0.5 to -12%, sd: 4.1%, Table 3, Fig. 5).
CH4 emissions decreased at all sites under the high SLR scenario by -68% (range: -7 to -100%, sd: 26.7%); whereas CH4 emissions either increased under the low SLR scenario by 33 – 56% or decreased by -9 to -32% depending on site (Table 4, Fig. 5). In contrast to CH4, N2O emissions decreased by an average of -71% (range: -15 to -93%) at all sites under both SLR scenarios (Table 4, Fig. 5). Overall, compared to the average year, site-averaged NEE and NPP increased (average: 10.5% and 3.9%; sd: 13.3% and 5.9%) under the low SLR scenario, indicating greater net carbon uptake, but decreased (average: -15% and -19%; sd: 25% and 19%) under the high SLR scenario, indicating less net carbon uptake (Table 3, Fig. 5). ER and N2O emissions declined (average: -3.2% and -63%; sd: 4.1% and 20.4%) under the low SLR scenario and decreased even more (average: -22.7% and -79%; sd: 13.2% and 16.7%) under the high SLR scenario; CH4 emissions slightly increased (< 1.6%; sd: 33%) under the low SLR but decreased substantially (-68%; sd: 26.7%) under the high SLR scenario (Tables 3, 4, Fig. 5).
Influences of a Mississippi River Water Re-introduction (Diversion)
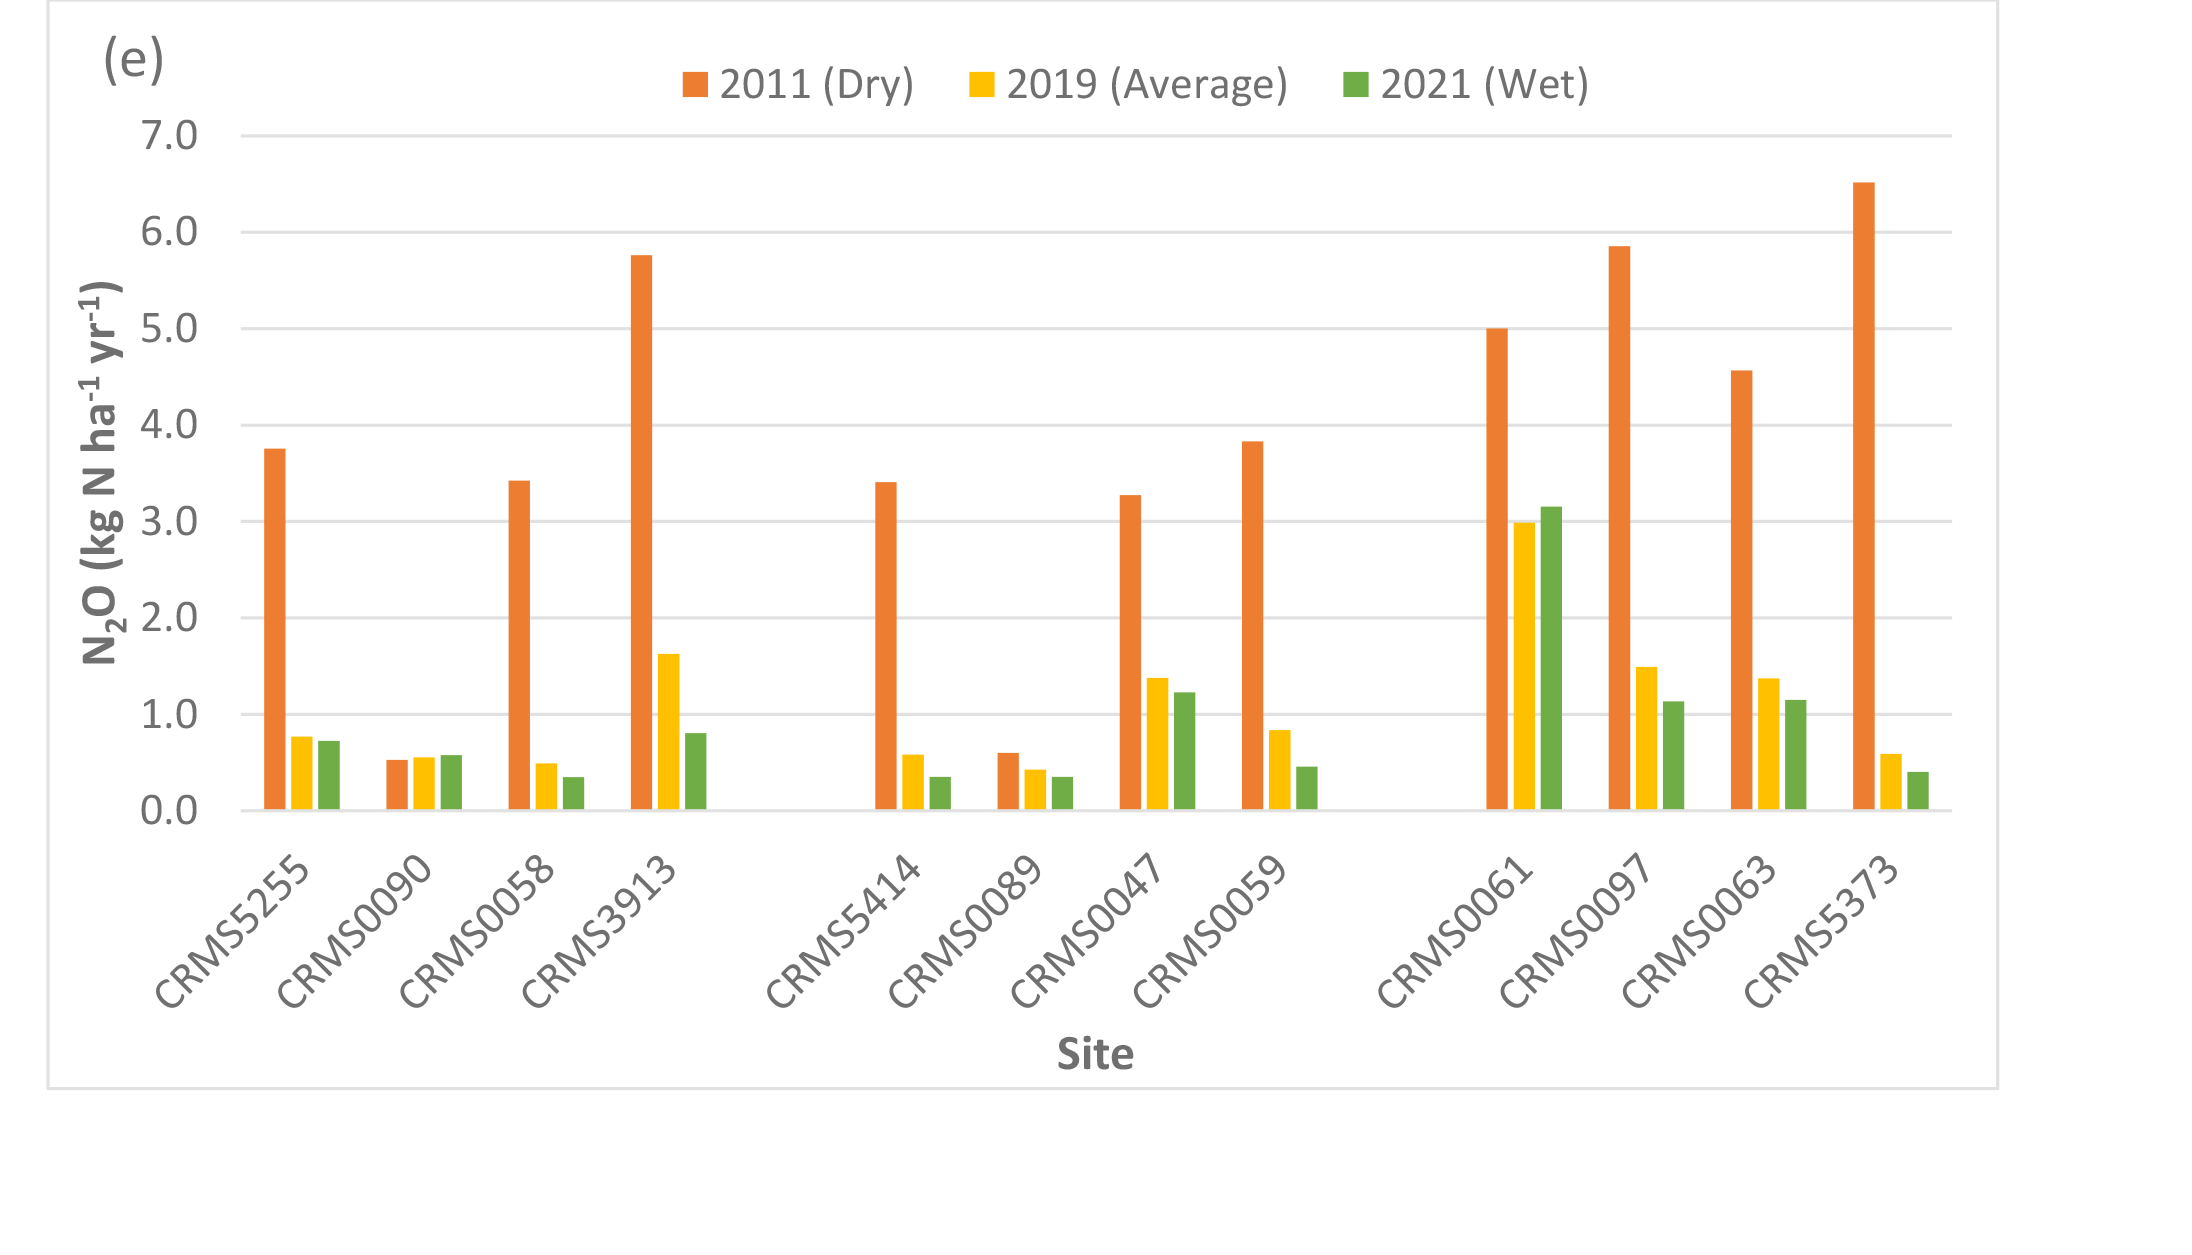
The two-way ANOVA for the river diversion influences showed that there were significant “scenario” (p < 0.05) effects for NEE, NPP, CH4 fluxes, and N2O fluxes, and significant “site × scenario” effects (p < 0.001) for both CH4 and N2O fluxes. The characteristics of specific swamp forest sites in the Maurepas basin affected the diversion influence on carbon fluxes. Simulation results showed that NEE at 9 out of the 12 sites simulated greater carbon uptake by an average of 8.8% (range: 4 to 19%; sd: 4.6%) but simulated reduced carbon uptake at the remaining 3 sites by an average of -16% (range: 9 to 22%; sd: 5.5%) compared to the average year (Table 3, Fig. 6a). In contrast, NPP increased at all sites under the river diversion compared to the average year by approximately 13.4% (range: 6 to 26%, sd: 7.0%). A large increase in NPP (>17%) occurred at the throughput sites, followed by smaller NPP increases at the relict sites (1.3%) and the degraded sites (7.5%) (Table 3, Fig. 6b). ER increased by 9.2% at all sites with river diversion (range: 1.3 to 26%, sd: 6.2%, Table 3, Fig. 6c).
CH4 emissions decreased at 9 out of the 12 sites under the river diversion (average: -7.5%, range: -1 to -16%, sd: 5.9%) but increased at the remaining 3 sites (average: 56.8%, range: 6.7 to 149%, sd: 65.4%, Table 4, Fig. 6d). Highest increases in CH4 emissions (149%) with river diversion occurred at CRMS3913, a degraded site near the lake. Unlike CH4, N2O emissions declined by an average of -34% (range: -5.0 to -70.5%, sd: 21.2%) across 11 of our 12 sites (increased by 2.8% at CRMS0090) (Fig. 6e). Overall, site-averaged NEE, NPP, ER, and CH4 fluxes with the river diversion scenario indicated greater carbon uptake by +2.5%, +13.5%, +9.2%, and +8.6%, respectively, and reduced N2O uptake by -34%.
Simulated net ecosystem exchange (NEE) (a), net primary productivity (NPP) (b), ecosystem respiration (ER) (c), methane (CH4), (d) and nitrous oxide (N2O) (e) emissions under various sea-level rise conditions (2019 average: no SLR, SLR1: +0.27 m, dry year salinity, SLR2: +0.50 m, 3× dry year salinity) in the Lake Maurepas swamp forest sites (degraded, relict, and throughput).
Table 4.
Simulated methane (CH4) and nitrous oxide (N2O) under the average year (represented by 2019) and change (%) under scenarios of dry, wet, sea-level rise (low: SLR1, high: SLR2) and the diversion compared to the average year in Lake Maurepas swamp forests (sd= standard deviation).Drivers of Carbon Fluxes
We found significant inverse relationships between soil salinity and NPP, ER, and CH4 emissions (p < 0.0001; Figs. 7a, c, e), but not for N2O emissions (p = 0.2101; Fig. 7g), suggesting that soil salinity would reduce NPP and ER, and inhibit CH4 emissions in the Lake Maurepas swamp forests. In contrast, there was a weak relationship between water table depth and NPP (p = 0.2482; Fig. 7b), but significant inverse relationship between water table depth and ER (p = 0.001; Fig. 7d), polynomial relationship between water table depth and CH4 emissions (p < 0.0001; Fig. 7f), and exponential relationship between water table depth and N2O emissions (p < 0.0001; Fig. 7h). As water table depth increased, ER and N2O decreased. Maximum CH4 emissions occurred at 20 – 30 cm above the soil surface, and N2O emissions were exponentially reduced with water table depth in the range of 20 cm below the soil surface and 20 cm above the soil surface. In summary, NPP was inversely affected much more by soil salinity than soil water level, ER and CH4 emissions tended to be affected by both salinity and soil water level, and N2O emissions were largely affected by soil water level rather than soil salinity for the Lake Maurepas swamp forests.
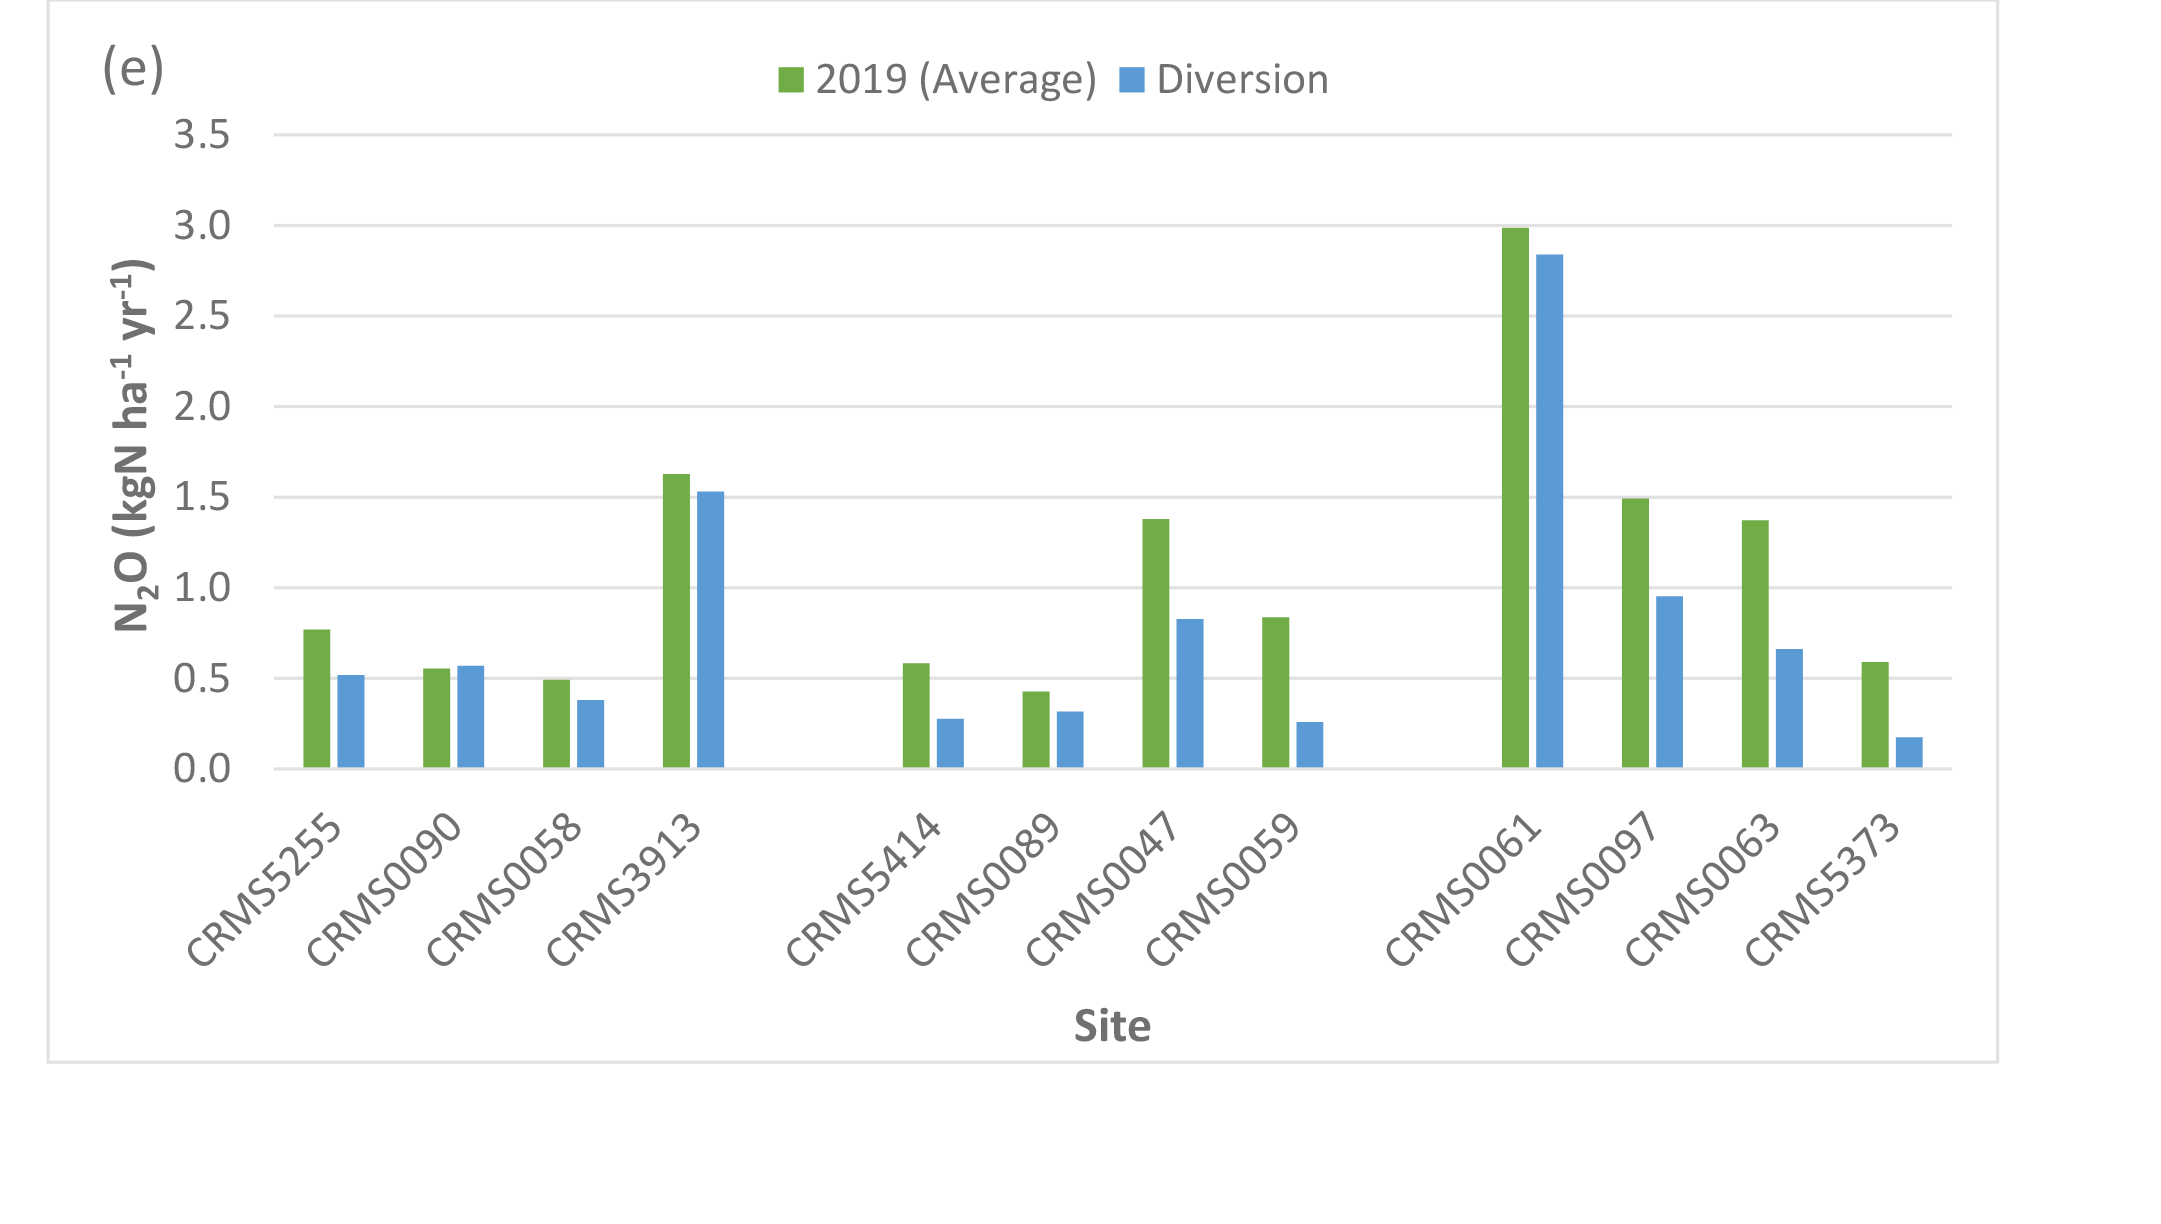
Simulated net ecosystem exchange (NEE) (a), net primary productivity (NPP) (b), ecosystem respiration (ER) (c), methane (CH4) (d), and nitrous oxide (N2O) (c) emissions under the river diversion in the Lake Maurepas swamp forest sites (degraded, relict, and throughput).
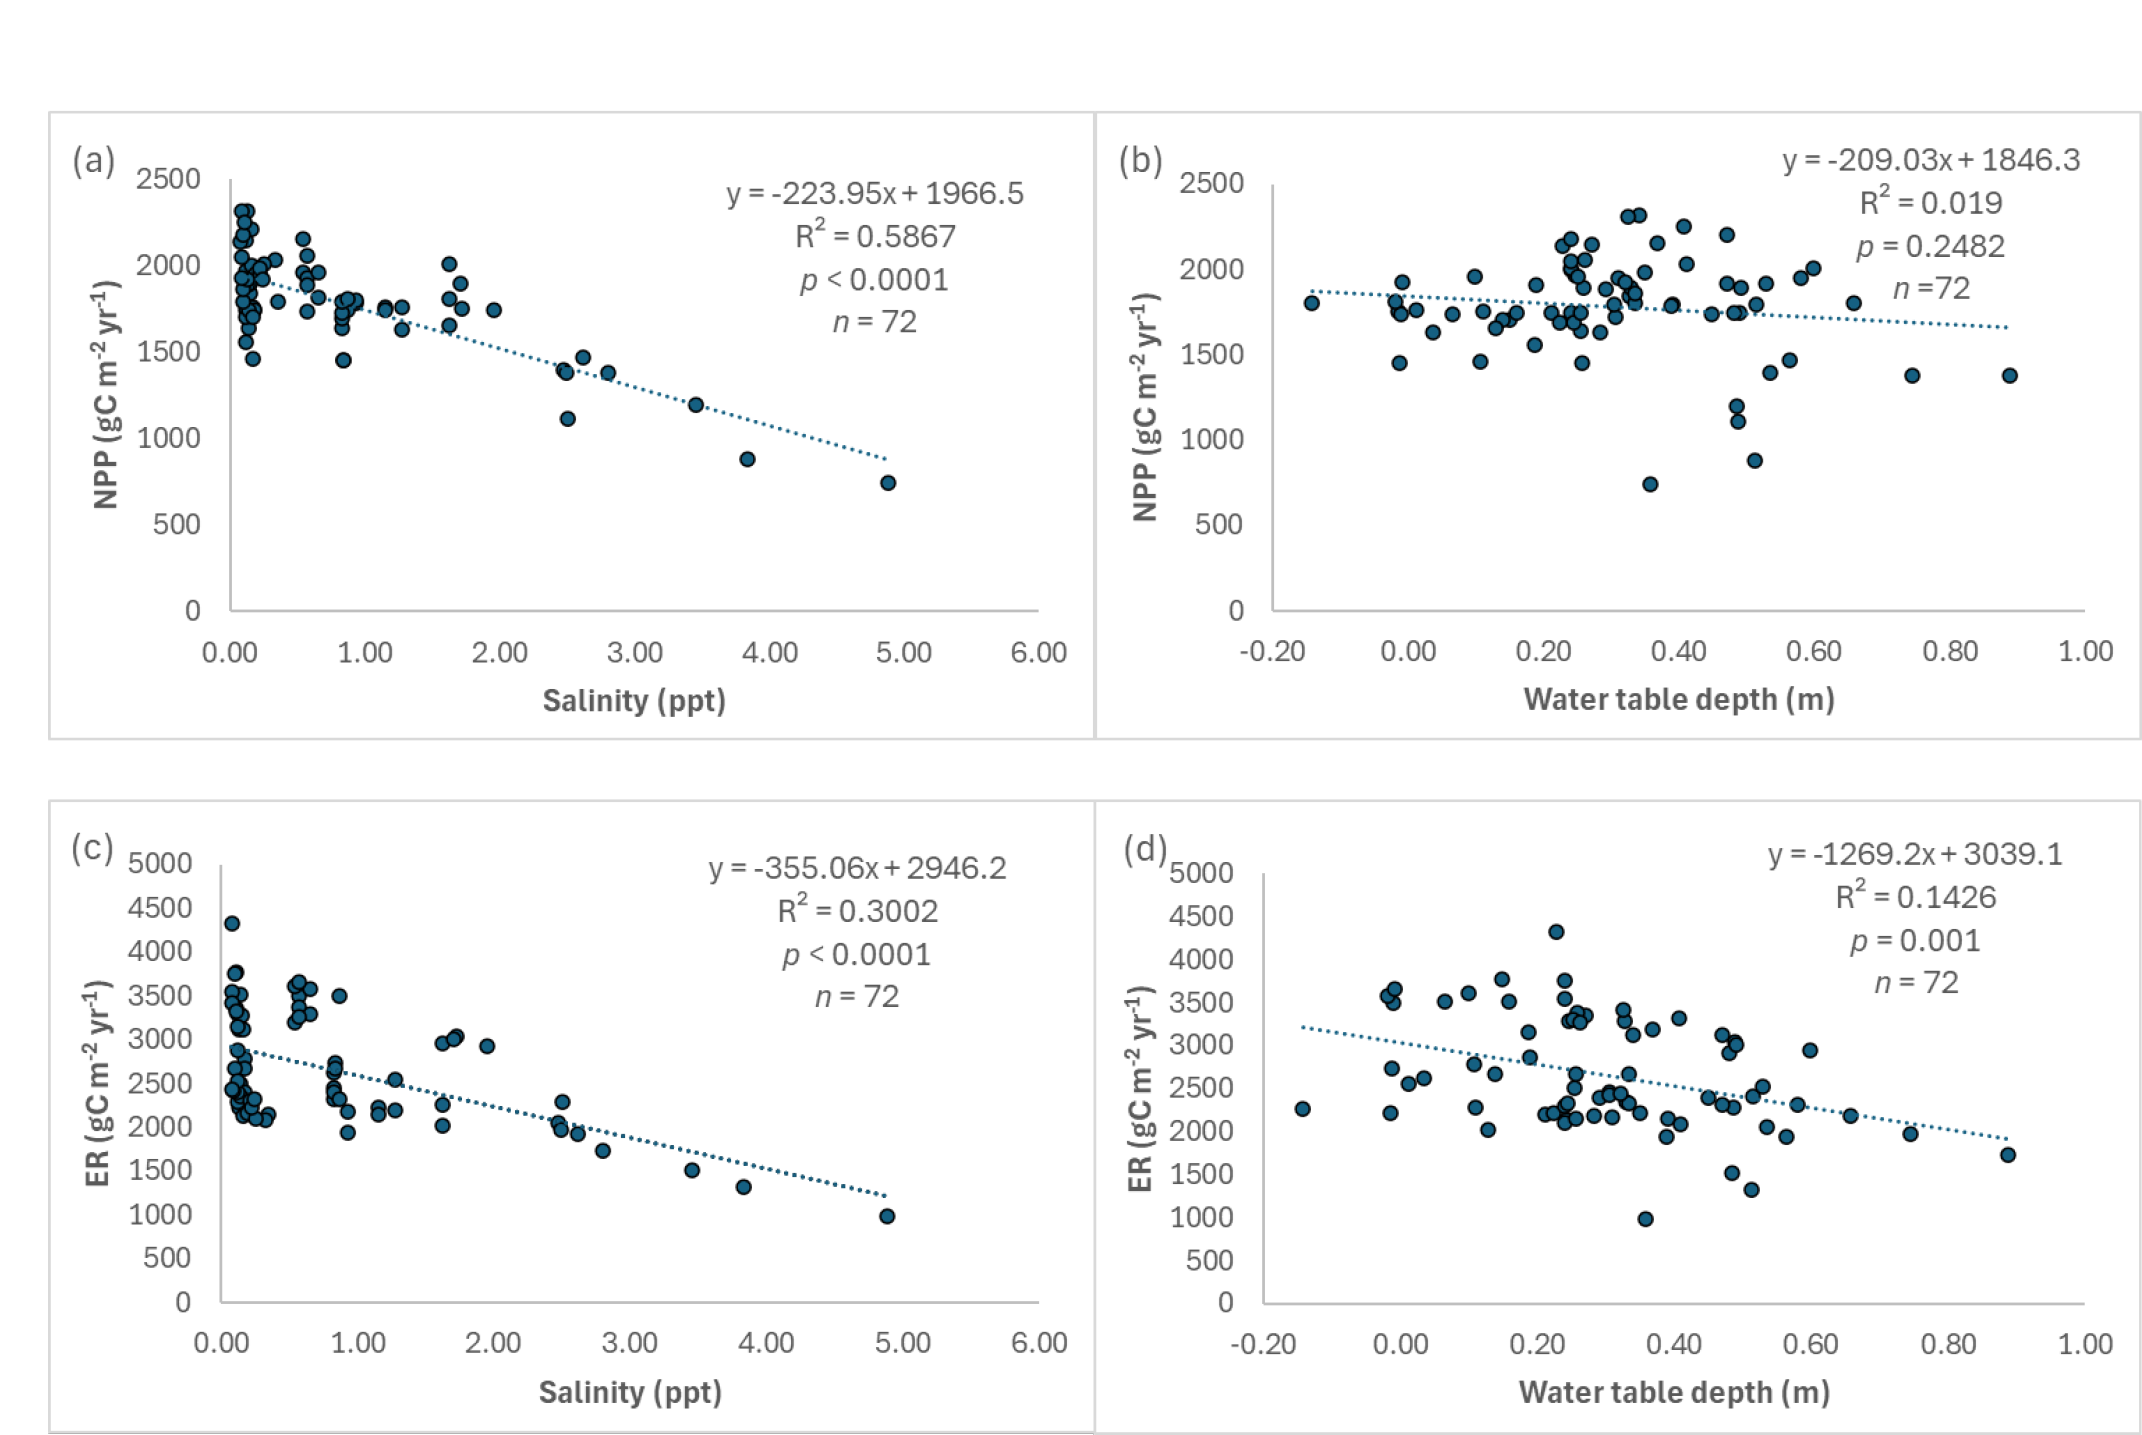
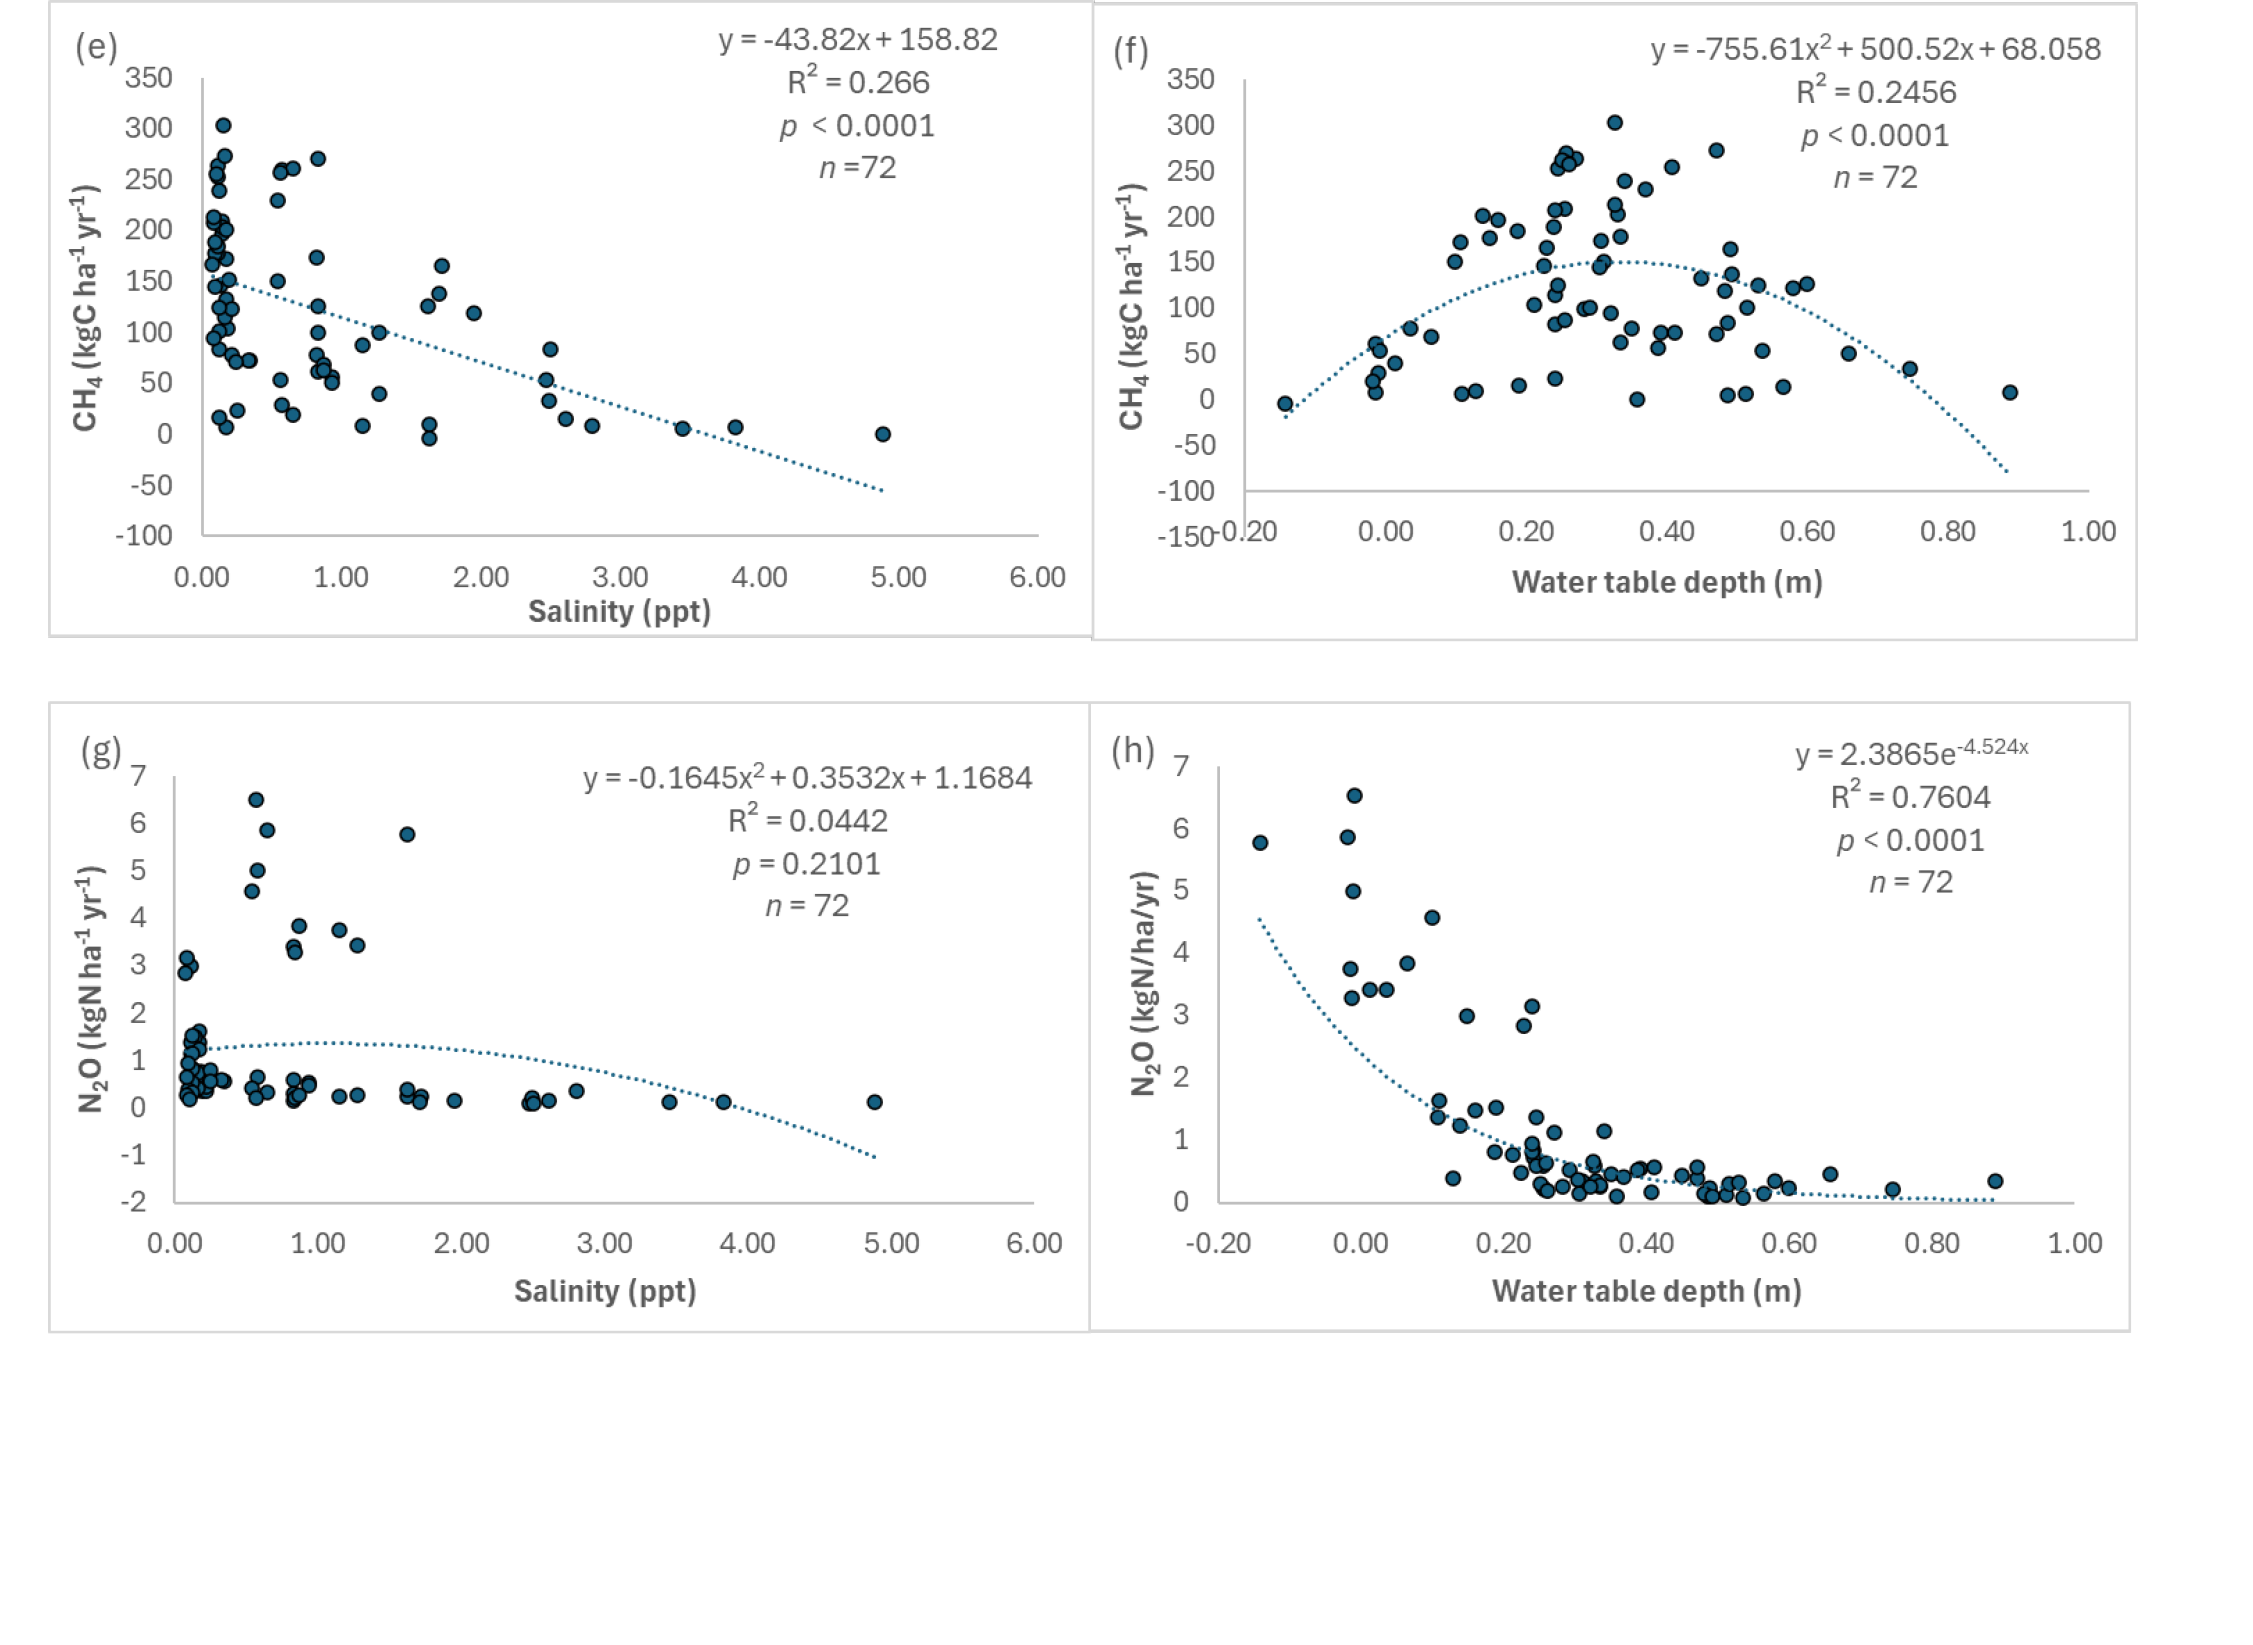
Relationships between simulated net primary productivity (NPP) (a, b), ecosystem respiration (ER) (c, d), methane (CH4) (e, f) and nitrous oxide (N2O) (g, h) emissions and soil salinity and water table depth in the Lake Maurepas swamp forest sites (degraded, relict, and throughput) under the environmental change scenarios.
Discussion
Our first discovery is that Lake Maurepas swamp forests have high net carbon uptake capacity, reflected through large net ecosystem exchange (NEE) of CO2 and moderate CH4 fluxes. NEE in the Lake Maurepas swamp forests ranged from -1,143 to -1,650 g C m-2 yr-1 across the twelve CRMS sites under average hydrologic conditions. NPP in the Lake Maurepas swamp forests from this study were at the high end of a previously reported range of 886.7 to 1,779.9 g C m-2 yr-1 for cypress and tupelo dominated swamp forests of Louisiana (Rivera-Monroy et al. 2019). These large and varying carbon fluxes indicate that Lake Maurepas swamp forests are hotspots of carbon cycling, our modeling revealed that biogeochemical processes among sites drive quite a lot of variability among specific sites. In order to quantify carbon processes properly with traditional study plots, many would be required, offering modeling as perhaps the most reasonable approach.
Measurements of NEE for tidal forested wetlands are uncommon. Modeled NEE was in the range of -630 to -1,929 g C m-2 yr-1 for tidal freshwater forests (salinity < 0.5 ppt) along the floodplains of the Waccamaw River, South Carolina and the Savannah River, Georgia (Wang et al. 2022). Simulated NEE values in Lake Maurepas swamp forests were in the middle to high end of this NEE range. Our NEE values were even higher than the measured NEE values (-900 to -1,000 g C m-2 yr-1) of the cypress swamp in the Big Cypress National Preserve in southern Florida (Shoemaker et al. 2015). Thus, Lake Maurepas swamp forests are potentially among the larger sinks of atmospheric CO2 in the southeastern United States. Furthermore, NEE in Lake Maurepas swamp forests were higher than that of other tidal wetland types (e.g. NEE from -45.6 to -337.2 g C m-2 yr-1 for tidal marshes, Windham-Myers et al. 2018), suggesting that the swamp forests play a more critical role than other tidal wetland types in taking up atmospheric CO2 and storing large amounts of carbon in vegetation and soils along the Gulf coast. A large area of tidal wetlands along the Gulf coast has been lost or degraded due to climate change, SLR, land use change, and disruption of freshwater flow and sediment supply, resulting in losses of sequestered and stored blue carbon and degradation of what remains (e.g. Lane et al. 2016; Wang et al. 2024). Because of this degradation, coastal wetland restoration is positioned to facilitate uptake of CO2 on broad scales.
Our second discovery is that the high net carbon uptake capability in the Lake Maurepas swamp forests could be significantly affected by climate change induced drought, flooding, and SLR depending on the direction and magnitude of hydrologic regime and salinity changes. Simulated NEE declined under drought conditions for all sites as well as under high SLR conditions for the degraded and relict sites. However, the capacity to take up CO2 increased under the wet conditions for all sites and under both SLR scenarios for the throughput sites because of the higher elevation at the throughput sies to handle more SLR. Although both drought and high SLR resulted in the decreases in NEE, the major driving factors could be different. Under the drought condition, the reduction in NEE is mainly attributed to the increased ER rather than the decrease in GPP and NPP. Soil respiration with drought increased by an average of 232% (range: 45 to 1,259%) whereas plant respiration decreased slightly by -8.4% (range: -4.8 to -14%) compared to the average condition. The increase in soil respiration reflected the increase in soil organic matter decomposition and mineralization from the lower soil water table depth under the drought condition (Wang et al. 2022). Wang et al. (2023b) found that the water table depth threshold for CO2 emissions was about 5 cm above soil surface for tidal forested wetlands and CO2 emissions declined dramatically once that threshold was exceeded.
Water table depths at the swamp forest sites under the drought condition were reduced from 11 to 45 cm above soil surface to < 5 cm, except CRMS0090, CRMS0089, and CRMS0063. In contrast, the decrease in NEE under the high SLR for the degraded and relict sites is due to the larger reduction in GPP and NPP than in ER. The decline in NPP under high SLR is due to the salinity stress from the increased soil salinity (mean soil salinity as high as 5.0 ppt at the degraded sites). Wood growth and litterfall were found to decline in Lake Maurepas swamp forests during drought years (2000 – 2002) when soil salinity increased from < 0.5, < 1.0, and < 2.5 ppt under non-drought years to 1 – 2, 2 – 3, and 3 – 5 ppt during drought year 2000 for the throughput, relict, and degraded forests, respectively (Shaffer et al. 2003; 2016). Declines in wood growth and litter fall were also observed in tidal forested wetlands along the Waccamaw and Savannah rivers in South Carolina and Georgia (Cormier et al. 2013; Pierfelice et al. 2015). The precipitous decrease in NPP in forest sites with soil salinity in exceedance of the 2 – 3 ppt thresholds (Wang et al. 2023b) can be explained by reduction in photosynthesis as reflected by reduction of sapflow under salinity stress (Krauss and Duberstein 2010) and nutrient stress particularly of P, resulting in inhibition of nutrient uptake (e.g. Zhai et al. 2018).
On the other hand, NEE increased under the wet year for all sites and under high SLR at the throughput sites. Such increases in NEE can be explained by the decreased ER and increased NPP. Under the high SLR, ER decreased by -13.7% (range: -8.6 to -19.3%) while NPP increased slightly by approximately 2% (range: 0.2 to 3.1%) for the throughput sites. Tidal wetlands respond to rising sea levels by increasing belowground productivity and altering root characteristics to influence the elevation of the soil surface, thus sequestering additional carbon consequently (Rogers et al. 2019). Throughput sites had a greater capacity for this response with higher SLR than degraded and relict sites with higher NEE from increased NPP especially belowground productivity, suggesting that throughout sites may be more responsive to potential management (e.g. river diversion) under high SLR. However, NPP in tidal forested wetlands is impacted more by soil salinity than water table depth, confounding hydrology-only conclusions, and NPP is reduced when salinity is in exceedance of the 2 – 3 ppt threshold (Wang et al. 2023b). Under the wet condition, NPP increased by approximately 16.4% (range: 12.3 to 23.1%) while ER decreased by -4.5% (range: -2.5 to -8%). Soil salinity under the wet condition was less than 0.5 ppt, well under the 2 – 3 ppt threshold. Under the high SLR condition, soil salinity at the throughput sites was around 1.5 ppt, still less than the 2 – 3 ppt threshold (Wang et al. 2023b), thus still in favor of plant growth for carbon sequestration over soil respiration. Under the wet condition, tidal swamp forests could experience frequent inundation, resulting in waterlogged soils with low oxygen availability. Nevertheless, baldcypress and water tupelo are species tolerant of flooding (Hook 1984), and nutrients may even partially offset flood stress by increasing growth potential, as documented for water tupelo (Effler and Goyer 2006). With reductions in soil oxygen, the efficiency of aerobic microbial activity will be suppressed in favor of a greater capacity to lose carbon through methanogenesis.
The Lake Maurepas swamp forests are net sources of CH4 and N2O emissions at all sites under all hydrologic conditions (except CRMS3913 under the dry year), but carbon release from methane emissions is small compared to release of CO2 into the atmosphere. CH4 and N2O emissions in Lake Maurepas swamp forest were relatively small compared to NEE. For example, CH4 emissions ranged from 10 to 30 g C m-2 yr-1 excluding CRMS3913 and N2O emissions ranged from 0.05 to 0.3 g N m-2 yr-1 under the average condition. CH4 was less than 2.8% of simulated NEE, ranging from -2,154 to -3,769 g C m-2 yr-1. Therefore, CH4 emissions played a less important role in the simulated carbon budgeting within Maurepas’ swamp forests. However, when converting CH4 and N2O fluxes into CO2 equivalents for understanding global warming potential (GWP), CH4 and N2O were amplified 25 to 298 times based on a 100-year period from 2007 IPCC Fourth Assessment Report. In this way, we discovered that flux of both molecules equal approximately 5 to 29% of net ecosystem exchange of CO2, which is not insignificant to climate change. This study confirmed the observation that CH4 emissions declined along an increasing soil salinity gradient (up to 30 ppt) in tidal wetlands (e.g. Poffenbarger et al. 2011), which we also applied to Lake Maurepas swamp forests under the high SLR condition. Most CH4 emissions would be suppressed when soil salinity exceeds 3 ppt for Lake Maurepas swamp forests (Fig. 7). Reduction of CH4 emissions under the high SLR scenario may be attributed to the inhibition of methanogenesis due to the increased activities of sulfate-reducing bacteria with saltwater intrusion (Wang et al. 2023a), creating a trade-off between greater CH4 emissions with intensified flooding and reduced CH4 emissions with salinity in swamp forests (Krauss and Whitbeck 2012). The presence of sulfate in soils allow sulfate-reducing bacteria to outcompete methanogens for energy, resulting in inhibition of methane production by sulfate-reducing bacteria (Poffenbarger et al. 2011; Holm et al. 2016; Krauss et al. 2016). Furthermore, soil water level was a critical limiting factor for N2O emissions. Increased N2O emissions in the Lake Maurepas swamp forests under the drought condition reflected the larger role of soil water level than soil salinity on redox potential and on nitrification and denitrification (Fig. 7). Soil redox potential increased under the drought conditions and nitrification was dramatically enhanced, leading to the large increase in N2O production because nitrification can also produce N2O during the NH4+ oxidation (Murray et al. 2015). Nitrification of NH4+ is a relatively unstudied pathway for N2O production in swamp forests, possibly even surpassing denitrification as an N2O and NO source in some settings (Krauss and Whitbeck 2012). In this study, the incomplete nitrification and incomplete denitrification could be attributed to increased N2O production under drought conditions with insufficient oxygen supply (Rassamee et al. 2011). Increased N2O emissions under drought conditions may also be attributed to stimulated organic carbon decomposition because labile organic carbon is significantly correlated with N2O emission rates because denitrification, in lieu of just nitrification, is favored to occur with high availability of organic matter (Swarzenski et al. 2008).
Our third discovery is that the response of net carbon uptake capacity of the Lake Maurepas swamp forests to a MR diversion is bi-directional, triggering both increases and decreases in net carbon uptake capacity related to site characteristics. However, uptake of carbon from CO2 was consistent with diversion scenario, suggesting that a MR diversion into the Lake Maurepas swamp forests may be beneficial to carbon sequestration and storage. Specific site characteristics control the magnitude of enhanced carbon uptake. In this study, NEE increased by an average of ~9% (range: 4 to 19%) at 9 out of the 12 swamp sites under MR diversion compared to the average condition. Due to the decrease in NEE at three sites (average: -16%, range: -6 to -26%), the site-averaged NEE across all the swamp forests under MR diversion only increased about 3% compared to the average condition. The increase in NEE at the 9 sites is the result of the larger increase in NPP (14%), particularly from throughput sites, than the increase in ER (6%). There are no field measurements on tree productivity under river diversions per se, but Middleton et al. (2015) found that aboveground growth of baldcypress was enhanced in a year with higher river water loading into Louisiana’s coastal wetlands as a mitigation tool to prevent oiling after the Deepwater Horizon oil spill. Furthermore, the MR diversion at Caernarvon, south of New Orleans, promoted the growth of marshes by enabling high belowground biomass production (Day et al. 2009b). For the Lake Maurepas swamp forests, woody and herbaceous vegetation are nutrient limited (Lane et al. 2003; Shaffer et al. 2003). Therefore, diversion of freshwater associated with mineral sediments and nutrients will likely stimulate wetland productivity (Martin 2002; Hoeppner et al. 2008; Day et al. 2009b). For example, Day et al. (2009b) found that the high marsh productivity at the site in the diversion outfall area was likely the result of increased nutrient availability, decreased porewater salinity, higher redox potential, and lower porewater sulfide concentrations. Soil salinity in the Lake Maurepas swamp forests under the MR diversion scenarios is still less than 0.5 ppt, so the increase in NPP is unlikely due to the lowering of salinity, which would directly suppress forest productivity through osmotic stress and ion toxicity (e.g. DeLaune et al. 2003; Swarzenski et al. 2008; Wang et al. 2022). Thus, the increase in NPP under river diversion is most likely attributed to increased soil carbon and nutrient (e.g. N and P) availability from diverted river water. In fact, soil organic carbon and soil nitrogen fluxes increased under river diversion compared to the average condition (Wang et al. 2024). On the other hand, the decreased NEE with MR diversion at the three sites (CRMS3913, CRMS0047, CRMS0061) could be explained by the relatively larger increase in ER (>18%) than the increase in NPP (~15%). The large increase in ER under river diversion could be attributed to increased soil organic matter decomposition under diversion similar to the findings of Swarzenski et al. (2008) where chronic riverine input led to enhanced soil organic matter decomposition in highly organic freshwater marshes. The three sites (CRMS3913, CRMS0047, CRMS0061) with decreased NEE under the diversion scenario are located far away from diversion outfall area (Fig. 1) and at relatively high elevation (0.24 – 0.32 m NAVD88) compared to other sites (0.05 – 0.14 m NAVD88) (CRMS 2025). With the 0.08 m increase to their water level under the average condition from the diversion design, their water table depths ranged 0.19 to 0.23 m, resulting in higher ER, CH4 and N2O emissions (Figs. 7d, f, h), thus lower NEE, compared to other sites. The lowest NEE at CRMS0061 (-1,143 g C m-2 yr-1, a throughput site, Table 3) under the average condition and reduction in NEE (net carbon uptake capacity) could be attributed to the high ER that would offset the contribution of high NPP and also be attributed to the lower soil organic matter content (18%, CRMS data) with insufficient nutrient availability for vegetation growth. The implication of this study for MR diversion is that delivery of diverted freshwater to forest stands at high elevation and/or far away from diversion outfall area via increased discharge or length of channel can help to increase nutrient availability and mitigate drought stress.
CH4 emissions varied greatly by site and were reduced substantially by diversion, especially at the throughput sites. These results are consistent with previous diversion studies. For example, Holm et al. (2016) found that CH4 emissions in receiving marshes was inversely related with MR diversion discharge at Davis Pond although the relationship was weak because the marsh location was outside of the dominant flow paths. Furthermore, Holm et al. (2016) pointed out that near-field, localized areas and/or higher discharge conditions would be required to stimulate a detectable effect on methane efflux. Methane emissions would be suppressed by increased river discharge, given the potential for increased loading of river-borne alternate electron acceptors, such as nitrate, sulfate, and iron-oxides (Holm et al. 2016). There tend to be critical inundation levels for methane emissions due to the interplay between methanogenesis, methanotrophy, and plant-mediated transport (Calabrese et al. 2021; Wang et al. 2023b). This global critical water table level is about 0.5 m above soil surface for wetlands including swamp forests (Calabrese et al. 2021). Higher than the threshold inundation level, methanogenesis could be decreased due to the declined vegetation productivity and diluted organic substrate concentration. Below this threshold, CH4 oxidation by methanotrophic bacteria occurs in unsaturated zones of the soil column and the saturated zone and the water column (Calabrese et al. 2021). For this study, the critical water table depth is about 0.35 m (Fig. 7f), providing evidence for the observation of Calabrese et al. (2021) that “the specific location of the critical water level above the soil surface may differ depending on wetland characteristics”. Additionally, N2O emissions were reduced under diversion in the Lake Maurepas swamp forests. This reduction in N2O emissions could be attributed to the increased uptake of by plant growth, leading to reduced , therefore, less N2O emissions by denitrification (e.g. White et al. 2019). Overall, our modeling results demonstrate that MR diversion could promote plant productivity more than increased ecosystem respiration (e.g. soil respiration from organic matter decomposition), inhibit CH4 at most of the sites and N2O emissions at all sites, leading to an increase of the net carbon uptake capacity. This finding can have management implications. River diversions into degraded tidal swamp forests that have stagnant, standing water and mineral sediment and nutrient deprivation can be an effective solution to enhancing carbon storage and restoring important energy transformations, perhaps even serving as a tool for helping to mitigate climate change if implemented over large scales. This approach can not only promote land building and vertical accretion through enhanced sediment deposition and SOC production (e.g., Couvillion et al. 2013; Wang et al. 2017) but also facilitate the net carbon uptake capacity via increasing plant productivity to outpace soil organic matter decomposition, and as we show here, reduce CH4 and N2O emissions.
In this study, only wood growth and litterfall data were available and field data on NEE, ER, CH4 flux, and N2O flux were not available, so we were unable to validate NEE, ER, CH4 and N2O emissions for the Lake Maurepas swamp forests. Nevertheless, the WCAT-DNDC model was previously validated for CH4 and N2O emissions at the Savannah River swamp forest sites along the Georgia Coast using static chamber methods (Wang et al. 2023a) and for NEE, GPP, ER and CH4 at the brackish marsh sites in Terrebonne Basin along the Louisiana Coast using the eddy covariance technique (Wang et al. 2024). When it was applied to Lake Maurepas swamp forest sites, the model structure (e.g., impact of soil salinity on litterfall and wood growth, SOM decomposition, methane emissions, Wang et al. 2022) was not changed. The model tended to overestimate CH4 emissions (bias = 0.004, RMSE = 0.026 kg C ha-1 day-1) whereas it tended to underestimate fluxes of N2O (bias = -0.84, RMSE = 1.74 g N ha-1 day-1) in swamp forests (Figs 3 and 4 in Wang et al. 2023a). The model tended to underestimate NEE (bias = −0.03 g C m−2 day−1), and slightly overestimate GPP, ER and CH4 fluxes (biases = 0.08 g C m−2 day−1, 0.23 g C m−2 day−1, and 0.03 kg C ha−1 day−1, respectively) in brackish marshes (Wang et al. 2024). Continuous and high-frequency field monitoring and measurements of NEE, ER, CH4 flux, and N2O flux could be beneficial for model improvement to reduce uncertainty in simulating the biogeochemical processes in the Lake Maurepas swamp forests. In addition, field studies on carbon exchange between swamp forests and river tributaries (mostly as carbon sink), Lake Maurepas, Lake Pontchartrain, as well as downstream estuaries (as carbon source) in the form of lateral flux of dissolved organic carbon (DOC), dissolved inorganic carbon (DIC), and particulate organic carbon (POC) could enable the calibration and validation of WCAT-DNDC model. In lieu of field studies, the model has been shown to be capable of simulating these fluxes for producing new insight from future modeling exercises. Lateral carbon fluxes are the most understudied component of tidal wetland carbon fluxes and can be large in magnitude but difficult to measure directly (Maher et al. 2018). Furthermore, soil salinity amplification by a factor of 3 in the dry year was used for the high SLR scenario based on the observed large increase in soil salinity at Lake Maurepas swamp under a severe drought condition discovered back in 2000. This assumption is one of the sources of uncertainty on simulation results. A more accurate magnitude and distribution of soil salinity under the low and high SLR scenarios would require hydrodynamic modeling with incorporation of the mixing of freshwater and saltwater across the landscape from sea to swamp, while incorporating the interactions of geomorphology, soil, vegetation, wind, and wave conditions for improvement. Finally, it has been argued that a large diversion (e.g. 1,416 m3 s-1of river flow) is needed to deliver sufficient sediments to achieve high accretion rates and stimulate organic soil formation in Lake Maurepas swamp forests (Shaffer et al. 2016). This study simulated a river diversion currently under construction with a much lower discharge rate (up to 71 m3 s-1) under specific operational timing and durations of water delivery from a very specific location along the Mississippi River. Changes in carbon fluxes and GHG emissions in the Lake Maurepas swamp forests under a larger river diversion could be further studied with hydrological and biogeochemistry monitoring, but models such as WCAT-DNDC could support river diversion management both in advance of project design and as adaptive management once a diversion project is implemented. Future plans include monitoring the Maurepas Swamp forest response after the current 71 m3 s-1 diversion is completed, using new empirical data to improve the WCAT-DNDC model, and applying the model to larger diversion scenarios.
References
Coastal Protection and Restoration Authority (CPRA) of Louisiana (2025) Coastwide Reference Monitoring System-Wetlands Monitoring Data. Retrieved from Coastal Information Management System (CIMS) database. http://cims.coastal.louisiana.gov.
CormierN, KraussKW, ConnerWH (2013) Periodicity in stem growth and litterfall in tidal freshwater forested wetlands: influence of salinity and drought on nitrogen recycling. Estuaries Coasts 36(3):533–546. https://doi.org/10.1007/s12237-012-9505-z
Day J, Lane R, Moerschbaecher M, DeLaune R, Twilley R, Mendelssohn I, Baustian J (2009b) The impact of the Caernarvon diversion on above and belowground marsh biomass in the Breton Sound estuary after Hurricane Katrina. Final Report submitted to the Louisiana Department of Natural Resources. Project. 2009(2512-07):01.
KraussKW, ChambersJL, CreechD (2007). Selection for Salt Tolerance in Tidal Freshwater Swamp Species: Advances Using Baldcypress as a Model for Restoration. In: Ecology of Tidal Freshwater Forested Wetlands of the Southeastern United States. Springer, Dordrecht. https://doi.org/10.1007/978-1-4020-5095-4_14.
KraussKW, HolmJrGO, PerezBC, McWhorterDE, CormierN, MossRF, JohnsonDJ, NeubauerSC, RaynieRC (2016) Component greenhouse gas fluxes and radiative balance from two deltaic marshes in Louisiana: Pairing chamber techniques and eddy covariance. Journal of Geophysical Research: Biogeosciences 121(6):1503-21.
Krauss KW, Shaffer GP, Keim RF, Chambers JL, Wood WB, Hartley SB (2017) Performance measures for a Mississippi River reintroduction into the forested wetlands of Maurepas Swamp. Scientific Investigations Report 2017-5036 56 U.S. Geological Survey, Reston, Virginia. https://doi.org/10.3133/sir20175036.
Murray RH, Erler DV, Eyre BD (2015) Nitrous oxide fluxes in estuarine environments: response to global change. Glob Change Biol 21(9):3219–3245. https://doi.org/10.1111/gcb.2015.21.issue-910.1111/gcb.12923
Rassamee V, Sattayatewa C, Pagilla K, Chandran K (2011) Effect of oxic and anoxic conditions on nitrous oxide emissions from nitrification and denitrification processes. Biotechnol Bioeng 108(9):2036–2045. https://doi.org/10.1002/bit.v108.910.1002/bit.23147
Rivera-MonroyVH, EllitonC, NarraS, MeselheE, ZhaoX, WhiteE, SasserCE, VisserJM, MengX, WangH, XueZ (2019) Wetland biomass and productivity in coastal Louisiana: Base line data (1976–2015) and knowledge gaps for the development of spatially explicit models for ecosystem restoration and rehabilitation initiatives. Water. 2019 Oct 1;11(10):2054.
WangH, DaiZ, KraussKW, TrettinCC, NoeG, BurtonAJ, WardEJ (2023a) Simulated methane and nitrous oxide emissions under drought-induced saltwater intrusion in tidal freshwater forested wetlands. Ecol. Appl. https://doi.org/10.1002/eap.2858.
Windham-Myers L, Cai WJ, Alin S, Andersson A, Crosswell J, Dunton KH, Hernandez-Ayon JM, Herrmann M, Hinson AL, Hopkinson CS, Howard J (2018) Chapter 15: Tidal Wetlands and Estuaries. In Second State of the Carbon Cycle Report (SOCCR2): A Sustained Assessment Report, edited by N. G. Cavallaro, R. Shrestha, M. A. Birdsey, R. G. Mayes, S. C. Najjar, P. R. Reed, and Z. Zhu, 596–648. Washington: U.S. Global Change Research Program. URS (2014) 95% Design Report: Mississippi River Diversion into Maurepas Swamp (PO-29 CONTRACT NO. 2503-11-63). State of Louisiana Coastal Protection & Research Authority and U.S. Environmental Protection Agency. U.S. Army Corps of Engineers, New Orleans District (2022) Mississippi Valley Division, Regional Planning and Environment Division South, Draft Supplemental Environmental Impact Statement to West Shore Lake Pontchartrain Hurricane and Storm Damage Risk Reduction Study. APPENDIX N: OPERATIONS AND MAINTENANCE PLANS I. Maurepas Swamp Project Operations Plan II. Maurepas Swamp Project Maintenance Plan.
Additional Information
Statements and Declarations
Funding: This work was supported by the U.S. Geological Survey (USGS) Ecosystems Land Change Science Program, USGS Ecosystems Mission Area, U.S. Army Corps of Engineers (USACE), National Aeronautics and Space Administration (NASA) Carbon Monitoring Systems Program, National Oceanic and Atmospheric Administration (NOAA), Environmental Protection Agency (EPA), and Louisiana Coastal Protection and Restoration Authority (CPRA).
Competing Interests: The authors have no relevant financial or non-financial interests to disclose.
Author Contributions: H.W: Study design, data analysis, modeling, and manuscript writing. K.K: Field data collection, data analysis, manuscript writing. G.S: Field data collection, data analysis, manuscript writing. B. P: Field data collection, data analysis, manuscript writing. D. K: Field data collection, data analysis, manuscript writing. G.N: Field data collection, data analysis, manuscript writing. Z.D: Modeling, data analysis, and manuscript writing. L. D: Field data collection and data analysis. C.T: Modeling, data analysis, and manuscript writing.
Data Availability: The datasets generated during the current study are available from the corresponding author on reasonable request.
Acknowledgments
This research was supported by the U.S. Geological Survey (USGS) Ecosystems Land Change Science Program, USGS Ecosystems Mission Area, U.S. Army Corps of Engineers (USACE), National Aeronautics and Space Administration (NASA) Carbon Monitoring Systems Program, National Oceanic and Atmospheric Administration (NOAA), Environmental Protection Agency (EPA), and Louisiana Coastal Protection and Restoration Authority (CPRA). We thank the Coastwide Reference Monitoring System (CRMS) of the U.S. Congress enacted the Coastal Wetlands Planning, Protection, and Restoration Act (CWPPRA) for providing hydrology, soil, and vegetation data for the Lake Maurepas swamp forest sites. Climate data were provided by the Oak Ridge National Laboratory’s Daily Surface Weather and Climatological Summaries (Daymet) database. We thank Melissa Baustian and three anonymous reviewers for their constructive review for improving this manuscript. Any use of trade, firm, or product names is for descriptive purposes only and does not imply endorsement by the U.S. Government.
Authors
Disclaimers
Any use of trade, firm, or product names is for descriptive purposes only and does not imply endorsement by the U.S. Government.
Although this information product, for the most part, is in the public domain, it also may contain copyrighted materials as noted in the text. Permission to reproduce copyrighted items must be secured from the copyright owner.
Suggested Citation
Wang, H., Krauss, K.W., Shaffer, G.P., Patton, B., Kroes, D., Noe, G.E., Dai, Z., Dettwiller, L., and Trettin, C.C., 2026, Modeling carbon fluxes in tidal forested wetlands in the Mississippi river deltaic plain under various hydrologic conditions: Implications for river diversions: Wetlands Ecology and Management, v. 34, no. 1, 11, 27 p., https://doi.org/10.1007/s11273-026-10111-5.
Study Area
| Publication type | Article |
|---|---|
| Publication Subtype | Journal Article |
| Title | Modeling carbon fluxes in tidal forested wetlands in the Mississippi river deltaic plain under various hydrologic conditions: Implications for river diversions |
| Series title | Wetlands Ecology and Management |
| DOI | 10.1007/s11273-026-10111-5 |
| Volume | 34 |
| Issue | 1 |
| Publication Date | January 24, 2026 |
| Year Published | 2026 |
| Language | English |
| Publisher | Springer Nature |
| Contributing office(s) | Wetland and Aquatic Research Center |
| Description | 11, 27 p. |
| Country | United States |
| State | Louisiana |
| Other Geospatial | Lake Maurepas swamp forests |