

Widespread occurrence of Magnéli phases in wildland-urban interface fire ashes
Links
- More information: Publisher Index Page (via DOI)
- Document: XML
- Open Access Version: USGS Accepted Manuscript
- Download citation as: RIS | Dublin Core
Graphical Abstract
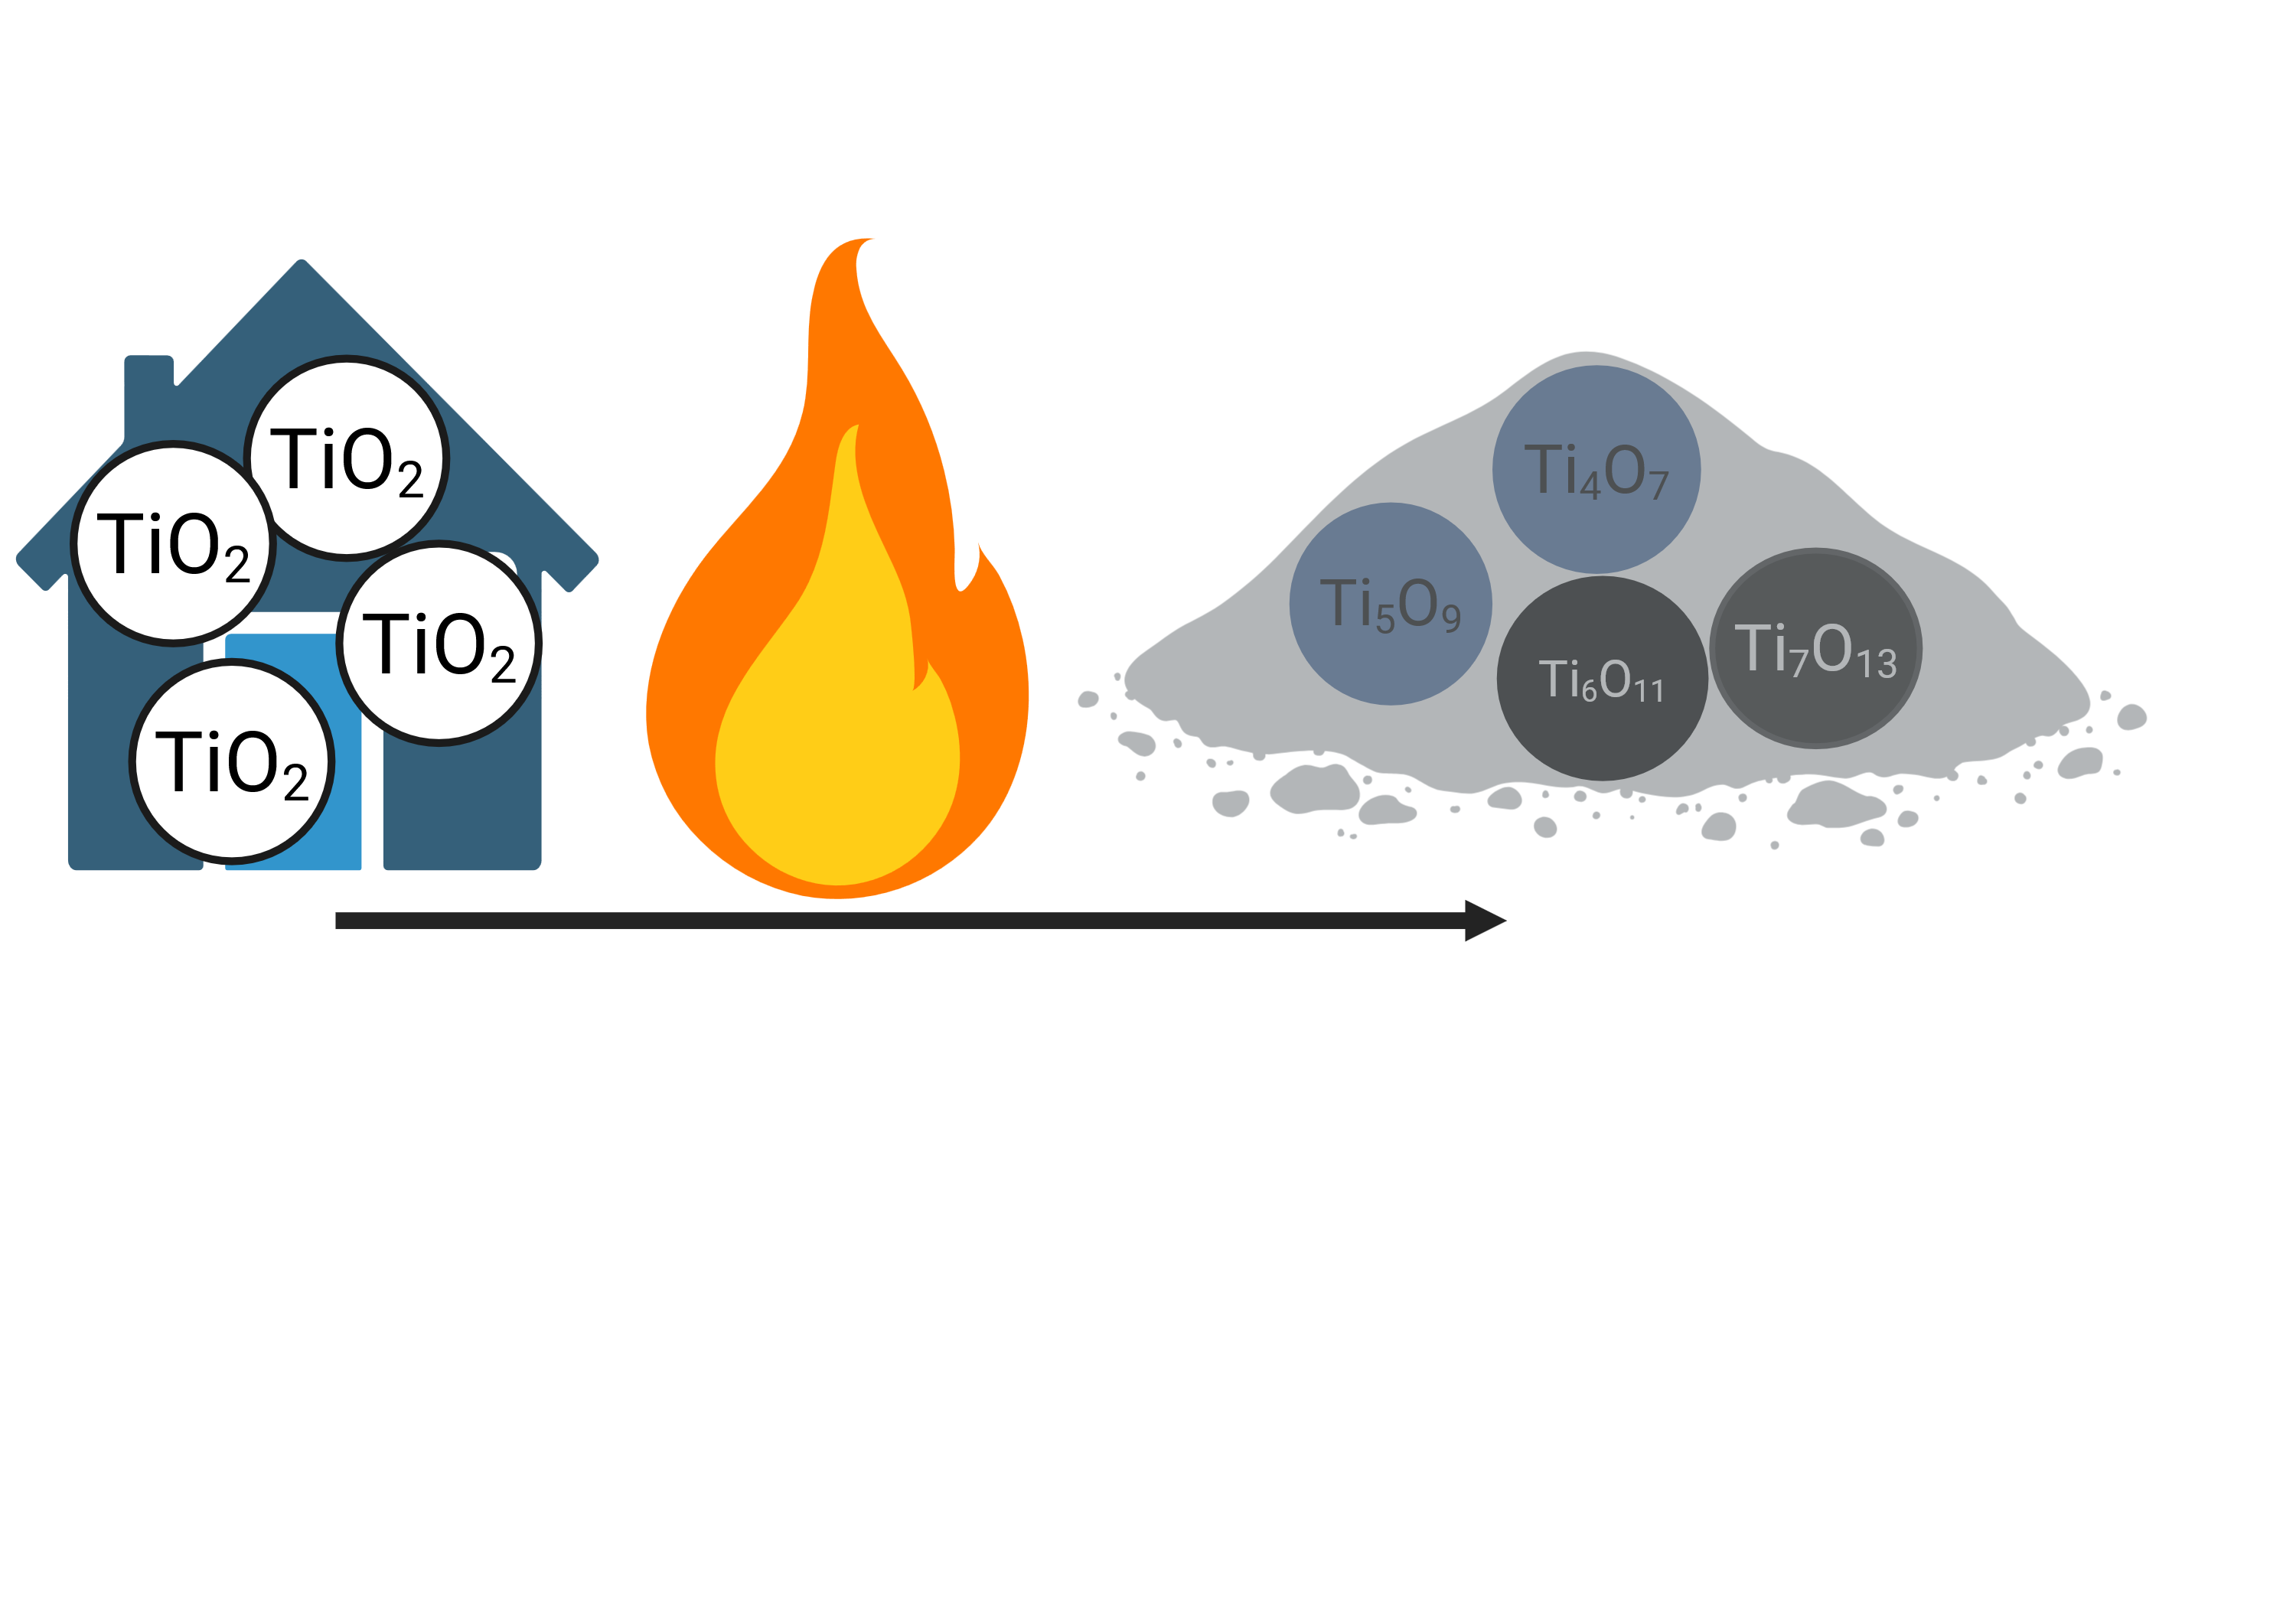
Fires at the wildland-urban interface transform titanium dioxide to Magnéli phases. Created in BioRender. BioRender User (2026) https://BioRender.com/r9f3dtq
Introduction
Fire is a natural and integral process in many ecosystems worldwide 1. However, in recent years there has been a rapid increase in frequency, size, severity, and spread of fires into the built environment (i.e., fires at the wildland-urban interface, WUI), leading to increased emissions of contaminants of emerging concern 2, 3, many of which remain poorly characterized or yet to be discovered. This trend has been observed across multiple regions globally, including California, United States4. The emission of fire contaminants poses a significant threat to ecosystems with implications for air and water pollution that adversely affect environmental and human health 5, 6. For instance, particulate matter from wildfires has been shown to be more toxic than equivalent doses of particulate matter from other sources such as ambient pollution 7, 8. Similarly, structural and vehicle ashes have been shown to be more toxic to phytoplankton and bacteria than vegetation ashes 9, 10. Thus, it is crucial to gain a better understanding of the constituents of particulate matter emitted by WUI fires.
The combustion of structures and vehicles has been shown to alter the speciation of iron oxides and to favor the formation of reduced iron oxides such as magnetite, wüstite, and zero valent iron 11. The heat and emissions (e.g., black carbon, methane, carbon monoxide) generated during combustion processes render the surrounding environment highly reductive 12, 13, reducing metal oxides to suboxides 11, 14, 15. However, little is known about the speciation and transformations of metal oxides such as titanium oxide-bearing particles, which are widely used in structures and vehicles, and have been shown to occur in high concentrations in WUI fire ashes 16. Production of titanium dioxide (TiO2) pigments in the United States averaged 1.0 million metric tons per year during 2020 to 2024; global production capacity in 2024 was 9.8 million metric tons 17. Titanium dioxide, primarily rutile (α-TiO2) and anatase (β-TiO2) polymorphs, is the most widely used white pigment owing to its high brightness and strong light scattering efficiency. The theoretical optimal average particle diameter for TiO2 pigments in coatings ranges from approximately 100 to 300 nm. Yet, commercially used TiO2 pigments typically exhibit broad particle size distributions extending from the nanoscale to several hundred nanometers 18, 19. Thus, most TiO2 pigments contain a fraction of TiO2 engineered nanomaterials (ENMs) 20. The primary applications of TiO2 include architectural and industrial paints and coatings (52.5%), plastic (23%), paper (5%), and other applications (7%) 20. Other applications of TiO2 include catalysts, ceramics, coated fabrics, floor covering, printing ink, and roofing granules 20. Titanium dioxide is also widely used in food products, cosmetics, toothpaste, and sun blocks. Current applications of TiO2 ENMs fall within the other applications category, which has historically represented a small percentage (e.g., 7% or approximately 0.4 million metric tons) of global TiO2 use 20.
We hypothesized that titanium dioxides undergo reduction during combustion of structures and vehicles leading to the formation of titanium suboxides (e.g., Magnéli phases). The reduction of TiO2 to Magnéli phases has been observed in coal burning power plants 14, 15. However, whether such transformations of TiO2 occur in WUI fires remains unknown. Therefore, this study aims to assess the speciation of titanium in residual WUI fire ash. Notably, as an emerging class of particulate pollutants, there have been no previous reports on the speciation of titanium-bearing particles in WUI fire emissions.
Materials and Methods
Study site and sample collection
Forty-two fire ash samples were collected from two areas affected by WUI fires that burned during the 2020 California fire season: the North Complex (NC) Fire and the Sonoma-Lake-Napa Unit (LNU) Lightning Complex Fire (Figure S1). The ash samples were collected from burned structures and vehicles and were classified into black, gray, white, and green ash (Table S1). Detailed description of the WUI fire sites, ash description, and sample collection is provided in the supporting information and elswhere11.
X-ray absorption near edge structure spectroscopy
X-ray Absorption Near Edge Structure (XANES) analyses at the Ti K-edge (4966 eV) were conducted on 20 WUI fire ash samples with Ti concentrations > 10 g kg-1. XANES analyses were conducted at the Deutsches Elektronen-Synchrotron (HASYLAB/DESY PetraIII, Hamburg, Germany) on the P65 undulator beamline 21. The incident photon energy was modulated with a Si(111) double crystal monochromator, yielding an energy resolution of ~0.5 eV at the Ti K-edge and a beam size of 0.5 x 1.5 mm2. Higher-order harmonics were effectively suppressed using Si-plane mirrors. Approximately 100 mg of each ash was ground, mixed with cellulose, and pressed into a 2 mm thick pellet. Energy calibration was performed before ash samples analysis because the high absorption of the pelletized samples precluded simultaneous transmission measurement of the reference Ti foil and the samples. Energy calibration and alignment were performed by setting the first inflection point of the first derivative of the Ti foil absorption edge to 4966 eV. Spectra were collected at room temperature over an energy range extending from 150 eV below to 900 eV above the absorption edge, with an energy increment of ~0.4 eV in continuous mode21. Each spectrum was acquired with 180 seconds collection time, and 3 to 5 spectra were averaged for each sample. Ti K-edge XANES spectra were collected in fluorescence mode using a Passivated Implanted Planer Silicon (PIPS) detector. Ti K-edge XANES spectra were processed (e.g., calibrated, averaged, normalized, analyzed, fitted, and plotted) using Athena 22.
Only Ti XANESs data were analyzed and presented in this study. Extended X-Ray Absorption Fine Structure (EXAFS) data are not presented due to the occurrence of multiple edges at energies > 5200 eV because of the complex nature of the investigated WUI fire ash samples 16. Least-squares linear combination fitting (LCF) of the XANES region was performed over the energy range 4960 to 5020 eV. The goodness of the LCF was evaluated using the r-factor and the chi-square metrics. Reference compounds were included in the fit when their relative abundance exceeded 10% and improved the goddess of the fit (i.e., reduced r-factor) by at least 20%. Spectra of model reference compounds, including anatase, rutile, brookite, and Ti2O3 (Figure S4) were provided by Li et al. (2023) 23. The details of the reference compounds and acquisition are described elsewhere 23. A reference spectrum for ilmenite was obtained from the Canadian Light Source database 24. Five reference compounds were used to fit the ash Ti-spectra, including anatase, rutile, brookite, ilmenite, and Ti2O3, with a maximum of four reference compounds used to fit any given Ti spectrum of WUI fire ash. These reference materials were selected based on TEM observations that demonstrated the presence of Ti-bearing particles in structural and vehicle ash as anatase, rutile, and Magnéli phases (e.g., Ti6O11, Ti7O13, Ti8O15, and Ti9O17, see Results and Discussion sections).
The relative abundance of trivalent titanium (Ti3+) in the WUI ashes was quantified based on the pre-edge peak shifts. The pre-edge feature was fitted using non-linear least square best fit using Larch to determine the centroid of the pre-edge peak 25. First, a baseline was defined as a linear + Lorentzian function to cover the entire sloping area below the pre-edge peaks (e.g., 4950 to 4980 eV). Then, three Gaussian functions were used to perform the non-linear least square fits to each individual spectrum in the pre-edge peak selected range (e.g., 4950 to 4980 eV). Gaussian function produced better fit results compared to Pseudo Voigt and Lorentzian. To determine the relative abundance of Ti3+ in the ashes, the lever rule (Eq. 1) between standard representatives of each of the endmembers was used. For each sample, the lever rule was applied using Ti2O3 vs. anatase and Ti2O3 vs. rutile as end members.
Following Ti speciation analysis in the WUI fire ash by bulk Ti K-edge XANES, we added higher spatial resolution with micro-focused X-ray fluorescence (µXRF) elemental maps and Ti K-edge microscale X-ray Absorption Near-Edge Structure (μXANES) spot analyses. X-ray microprobe measurements were collected to identify Ti phases present in the WUI fire ash samples at the microscale and to investigate at a finer resolution the spatial distribution of Ti as a function of its speciation. In contrast with bulk XANES, μXRF and μXANES are not representative of the whole sample but help to identify patterns in microscale distribution. µXRF maps and µXANES spectra at the Ti K-edge in sample A96 (with an intermediate relative abundance of Ti3+ selected as a representative WUI fire ash sample) were collected at the GeoSoilEnviro Center for Advanced Radiation Sources (GSECARS) X-ray microprobe beamline 13-ID-E at the Advanced Photon Source in Argonne National Laboratory (Argonne, IL, USA)26. A cryo-cooled Si(111) double-crystal monochromator, which allows up to an energy resolution of ~ 0.1 eV/step on the region of interest, was used for these experiments. Photon energy for µXRF elemental mapping was fixed at 7000 eV, covering a large area of 1 mm × 1 mm using a dwell time of 5 ms per pixel. Data were collected in fluorescence mode using a Canberra/Mirion SX7 7-elements Si drift detector (Mirion Technologies, Atlanta, GA, USA) coupled with an Xspress3 electronics. Ti Kα final signal was summed over the 7-elements. Incident beam flux was ∼ 8.0 x 10¹² photons per second. The Ti K-edge µXANES were collected in continuous fluorescence mode with a beam diameter of ∼ 2 µm and energy step of that varied as follows: 2 eV/step for the region of ~ 60 eV to ~ 10 eV below the edge, ~ 0.1 eV/step for the region of 10 eV below the edge to ~ 10 eV above the edge, and 4 eV/step for the region of ~ 10 eV to ~ 450 eV above the edge. The detector deadtime was corrected, data were normalized to incident intensity, and Ti foil was used for calibration purposes. Ti foil µXANES spectra were collected at the beginning and at end of the run, obtaining same value of E0, discarding any monochromator drift. The μXRF maps were processed using the Larch 0.9.64 GSE Map XRM Viewer software25. The µXANES data were visualized using the Larch XAS Viewer software followed by energy calibration, background subtraction, and normalization standard procedures. The Ti K-edge µXANES spectra of the different microspots were fitted using the same LCF protocol and reference spectra used for the XANES measurements using Athena22. The sample for µXRF and μXANES analysis was prepared by dusting a few milligrams of the sample onto Kapton double tape.
Transmission Electron Microscopy
Five of the 42 ash samples, including vehicle ash A13, structural ashes A122 and A124, and vehicle/structure ashes A131 and A132, were characterized by TEM using a JEOL JEM 2100 S/TEM (JEOL USA, Peabody, MA, USA) to determine the morphology, size, and crystalline structures of Ti-bearing particles present in the WUI fire ash. Detailed description of TEM operating conditions and sample preparation is provided in the supporting information.
Results
Titanium concentration in WUI fire ash
Total Ti concentrations in the ash samples ranged from 0.5 to 80 g kg-1, with a median concentration of 9.6 g kg-1 (Figure S5a). Median Ti concentrations decreased in the following order: vehicle ash 36 g kg-1 (range: 7.9 to 43.5 g kg-1) > structural/vehicle ash 9.5 g kg-1 (range: 3.2 to 50.3 g kg-1) > structural ash 8.0 g kg-1 (range: 0.5 to 80.0 g kg-1). The elemental ratio of Ti/Nb in ash samples varied between 371 and 12,780 with a median of 1,549 (Figure S5b), which is higher than the average crustal ratio of 320. This increase in Ti/Nb elemental ratio in WUI fire ash is attributed to the presence of engineered/anthropogenic Ti-rich materials, which do not contain Nb (i.e., Ti/Nb → ∞). The median concentration of anthropogenic Ti in WUI ashes decreased in the following order: vehicle ash 32 g kg-1 (range: 5.7 to 41.8 g kg-1) > structural/vehicle ash 7.0 g kg-1 (range: 1.6 to 43.0 g kg-1) > structural ash 6.5 g kg-1 (range: 0.1 to 78.0 mg g-1, Figure S5c).
Titanium phase identification using transmission electron microscopy
Numerous Ti-bearing particles were observed in vehicle ash A13, structure ashes A122 and A124, and vehicle/structure ashes A131 and A132. The diameter of the Ti-bearing particles varied between 40 and 490 nm (Table S2). Detailed crystallographic structure analysis was performed on Ti-bearing particles in samples A13, A124, and A131 (Table S3). An example of Ti-bearing particles present in structural ash A124 is shown in Figure 1. The d-spacing values from electron diffraction data matched rutile (α-TiO2), anatase (β-TiO2), and/or Magnéli phases (e.g., Ti6O11, Ti7O13, Ti8O15, or Ti9O17, Table S3). Of the 10 Ti-bearing particles analyzed for their diffraction data, five particles matched Magnéli phases only, four particles matched rutile or Magnéli, and one particle matched anatase or Magnéli, meaning that all 10 Ti-bearing particles could contain Magnéli phases (Table S3). The interatomic distances of some atomic planes of rutile, anatase, and Magnéli phases had similar values (Table S3), and thus, it is often difficult to categorically distinguish rutile and anatase from Magnéli phases in all particles by electron diffraction. Additionally, TEM inherently suffers from low statistical power because a limited number of particles can be imaged and analyzed within a reasonable time and cost constraints. Therefore, TEM was used pragmatically to provide complementary data to the more statistical XANES analysis, which supports the determination and quantification of the relative abundance of Magnéli phases in the WUI fire ash samples. TEM was also used to support the choice of reference spectra used in the fitting procedure of XANES and µXANES data.
Titanium solid phase speciation using XANES
The near K-edge XANES spectra of Ti in a suite of reference compounds (Figure S6a) and WUI fire ashes comprise electronic excitations in the pre-edge region and multiple scattering resonances along the rising edge and at the white line. XANES spectra of the WUI fire ash samples exhibit a consistent shift to lower energies compared to those of the standard reference materials (rutile and anatase), which contain exclusively tetravalent titanium (Ti4+; Figure S6a). Such energy shifts in the XANES spectra reflect variation in the oxidation state and coordination chemistry, with higher energies generally associated with higher valence states and greater coordination numbers 27-30. Below, we discuss the pre-edge and the post-edge portions of the XANES spectra to determine the overall Ti valence, relative abundance of Ti3+, and the relative abundance of Ti-bearing phases in the WUI ashes.
The pre-edge for the rutile, anatase, and Ti2O3 reference compounds consists of three peaks (A1, A2, and A3; Figure S6a) with a split second peak for anatase because anatase exhibits a small distortion of the TiO6 and overlapping peaks for Ti2O3 resulting in overall smooth pre-edge features 31. The occurrence of the three peaks is more evident in the first and second derivatives of the absorption coefficient μ(E) (Figure S6b and c). The pre-edge and main-edge features of the XANES Ti spectra are a function of electronic transitions between bound states 29. The height and position of the pre-edge features are direct functions of the degree of P-d mixing and oxidation state 32. Peak A1, present in both rutile and anatase, is assigned to an excitonic transition within the forbidden band gap (Frenkel core exciton) 33. Peaks A2 and A3 are attributed to the transition from the 1s energy levels to bound 3d electron orbitals in Ti 32, 34, 35. Based on LCF discussed below, in all the samples examined in the present study, the Ti occupies mainly octahedral coordinated sites (e.g., rutile, anatase, ilmenite, and Ti2O3). Thus, differences in pre-edge position are mainly due to variations in Ti valence in the WUI fire ash. Among the three pre-edge peaks, the second peak (A2) at about 4969–4972 eV undergoes the largest intensity and energy position changes from compound to compound 32. Several studies have shown that the most prominent pre-edge peak of the Ti K-edge XANES spectra, A2, can be used to determine Ti valence and the relative abundance of Ti3+ 27, 28, 32, 36.
The position of the second peak (A2) of the Ti reference compounds, determined by the pre-edge peak fitting, is listed in Table S4, which indicates an energy shift between the Ti3+ in Ti2O3 and Ti4+ of 2.2 and 2.6 for rutile and anatase, respectively, consistent with those reported in previous studies 32, 35, 36. The A2 pre-edge peak position of all WUI fire ash samples is shifted toward lower energies (e.g., 4970.4–4971.1; Table S5) compared to those for reference TiO2 minerals such as rutile and anatase (4971.4 and 4971.7, respectively; Table S4). This is attributed to the presence of a mixture of Ti-phases including those with valence states of 3+ and 4+ 36. Given the presence of a mixture of Ti-phases in the WUI fire (as discussed below in the LCF section), we estimated Ti valence and the relative abundance of Ti3+ fraction in the WUI fire ash based on energy shifts between Ti2O3 and rutile, and Ti2O3 and anatase endmembers. Thus, the reported values provide lower and upper bounds of Ti valence and Ti3+ fraction in the WUI fire ashes. The position of A2 peak of ilmenite is below that of most of the WUI fire ashes, and thus it was not possible to determine Ti3+ fraction based on ilmenite endmember. The valence of Ti in all WUI fire ash samples ranged from 3.55 to 3.86 and 3.49 to 3.76, based on energy position shifts of rutile and anatase, respectively. The relative abundance of Ti3+ in all WUI ash samples varied from 0.14 to 0.45 and from 0.24 to 0.51 of the total Ti, based on energy position shifts of rutile and anatase, respectively (Figure 2a).
Linear combination fits of the Ti K-edge XANES spectra are shown in Figure S7. The relative abundance of the Ti oxide phases, and the r-factor are presented in Table S6. Overall, the r-factor was < 0.02, indicating good quality of fit, suggesting that the spectra of the selected model compounds reasonably fit the measured WUI fire ash Ti spectra. The LCF indicates that the relative abundance of Ti-bearing phases varies from 0.26 to 0.83 rutile, 0.19 to 0.83 anatase, 0.33 ilmenite, and 0.17 to 0.72 Ti2O3 (Figure 2b and Table S6).
Microscale phase analyses of Ti-bearing species using combined μXRF and μXANES
Large scale μXRF mapping shows that the Ti-bearing particles were widespread throughout the studied area and their size varied between 10 and 100 μm (Figure S8). The intensity of the Ti fluorescence signal, which is related to Ti concentration in a specific area within the map, varied from low to high (in the color code blue to yellow) in terms of Ti-normalized fluorescence intensity (Kα/I0, where Kα is the measured fluorescence intensity and I0 is the incident beam intensity). Most likely these Ti features consist of aggregates of nanometric Ti-rich particles, as observed by TEM, which cannot be resolved individually by μXRF due to their small size (50-500 nm; Table S2) compared to the μXRF resolution used in this study (approximately 1 μm). Representative higher resolution μXRF maps of Ti-rich particle aggregates (~20-50 μm; Figure 3a-d), together with Ti K-edge μXANES data (Figure 3f) and LCF results (Figure 3e) using the same set of references as macro-scale XANES LCF are shown in Figure 3. Ti K-edge µXANES were collected at 75 different spots within the large-scale μXRF maps. It is important to note that the sample area probed using μXANES is significantly smaller than the one probed by macro-scale XANES, and that LCF procedure does not allow for the detection of phases present at less than 0.15 relative abundance in a macro-scale sample. Thus, it is not possible to quantitatively compare macro- and microscale LCF results. Among the 75 spectra measured by μXANES, 11 spectra were not usable due to absence of white line measurement. Additionally, it was not possible to obtain a good LCF for 12 spectra due to the length of the spectra, important glitches in the XANES, and other limitation inherent to μXANES analysis. For the other 52 collected μXANES spectra, Ti2O3, rutile, anatase, and ilmenite were detected in 8, 39, 27, and 14 spectra, respectively. Rutile and anatase were detected as a pure phase in 5 and 3 spectra, respectively (Table S7). More importantly, Ti2O3 was never detected as a pure phase, suggesting its occurrence as a component of Magnéli phases in those samples.
Discussion
The relatively high concentration (0.5 to 80 g kg-1) of titanium in WUI fire ashes compared with typical soil and ashes formed from burned vegetation (0.1 to 6 g kg-1)16 is because of the widespread use of TiO2 in the urban environment. Titanium dioxide is commonly used as a paint pigment (e.g.,100-300 nm particles) and as nanosized particles (e.g.,1-100 nm) in self-cleaning and photocatalytic surfaces18-20. TiO2 particles are widely used in structures as a white pigment in paints, coatings, and finishes for buildings and vehicles, a catalyst in self-cleaning surfaces or catalytic converters, or as an additive in roofing material to reflect ultra-violet light and heat18-20. For instance, based on a house size of 300 m2 with a painted surface area of 250 m2, 80 to 110 grams of paint per 1 m2 painted surface, and 15% content of TiO2 in paint, it is estimated that each house could contain up to 3 to 4 kg of TiO2 from paint only. Considering other uses of TiO2 in homes, it is estimated that each home could contain up to 5 to 10 kg TiO2. With the number of homes burned in the LNU Lightning Complex Fire (2,450) and North Complex Fire (1,491), it can be estimated that these two fires resulted in the release of 12,250 to 24,500 kg and 7,455 to 14,910 kg of TiO2, respectively. For a typical vehicle, the amount of paint could range from 5 to 10 kg, with 10 to 25% of TiO2 in the paint; it is estimated that a typical vehicle could contain 0.8 to 2 kg of TiO2. Additionally, TiO2 is often used in small quantities (e.g., 1–3% by weight) as a white pigment or stabilizer in different plastic components of vehicles. Assuming a total amount of plastic in vehicles to be 150 to 200 kg, TiO2 in vehicle plastics is estimated at 1.5 to 6 kg.
The observed sizes of the Ti-bearing particles (40 to 490 nm) in WUI fire ashes (Table S2) are consistent with those of TiO2 pigments 18. The detection of nano-sized Ti-bearing particles is also consistent with the presence of nano-sized TiO2 in pigments where up to 36% of particles occur in the nano-size range 18. The high abundance of rutile (0.20 to 0.74) and anatase (0.16 to 0.84) in the WUI fire ashes is consistent with the widely used TiO2 phases in the construction and automobile industry. Of the three TiO2 polymorphs, rutile and anatase are widely used as pigments, whereas brookite has no technical importance as a pigment 37. Rutile is preferred over anatase as a pigment because it scatters light more efficiently and exhibits greater stability and durablility20.
Macroscale XANES and μXANES analysis suggest that all the studied WUI fire ash samples contain a mixture of anatase, rutile, ilmenite, and Ti2O3. Ti2O3 is never present as a pure phase, which is attributed to its occurrence as a component of the Magnéli phases (i.e., a mixture of TiO2 and Ti2O3). This is consistent with the TEM analysis of ashes illustrating the occurrence of Ti in the form of rutile, anatase, and Magnéli phases (e.g., Ti6O11, Ti7O13, Ti8O15, and Ti9O17; Table S3). Natural TiO2 particles occur in different minerals, including rutile, anatase, and brookite, which are typically purified and used for industrial applications. However, the Magnéli titania phases have not been reported to occur naturally (e.g., in soil, sediments, or vegetation) but have been detected in coal power plant ashes, where they have been attributed to the reduction of anatase and rutile 14. Thus, the presence of Magnéli phases in WUI fire ash is attributed to the reduction of TiO2 during the combustion. Magnéli phases typically form as a result of reducing TiO2 at high temperatures in the presence of reducing agents such as C, H2, CO, and CH4, metal, and metal hydrides 38, leading to the formation of oxygen vacancies and the formation of layered structure with varying ratios of TiO2 and Ti2O3-like planes. The TiO2 reduction temperature varies between 400 and 1100 °C depending on the reducing agent, and occurs at approximately 900–1000 °C for reducing agents such as C and H2 38. The reduction sequence is: TiO2 → TinO2n-1 (n >10) → TinO2n-1 (4 < n < 10) → Ti3O5 → TiO → Ti2O 39.
A Magnéli phase is a type of titanium oxide that can be considered as a mixture of TiO2 and Ti2O3, essentially acting as a sub-stoichiometric titanium oxide where some oxygen atoms are missing, creating a structure with repeated layers of TiO2 and Ti2O3-like planes. The general formula of the Magnéli phase is TinO2n-1 (n = 4 to 9), where the number of TiO2 layers between the Ti2O3 layers = n-1. Thus, the relative abundance of Ti2O3 (0.11 to 0.33) and Ti3+ (0.22 to 0.67) in Magnéli phases (=1/n and 2/n, respectively) can be determined as summarized in Table S8. Based on the relative abundance of Ti2O3 in the WUI fire ash samples measured by macro XANES (ca. 0.17 to 0.34 with the exception of A92 with 0.72 relative abundance of Ti2O3) and the relative abundance of Ti2O3 in Magnéli phases (Table S9), we estimated that the majority of TiO2 was reduced to Magnéli phases with a formula of Ti6O11 or more reduced phases such as Ti5O9, Ti4O7, or Ti3O5 (Table S9). The Ti6O11 alone does not explain the relative abundance of Ti2O3 in the ashes with relative abundance of Ti2O3 > 0.20 (Table S9). These observations are consistent with identification of Ti6O11, Ti7O13, Ti8O15, or Ti9O17 Magnéli phases in WUI fire ash by HR-TEM (Figure 1 and Table S3). These observations are also consistent with the μXANES analysis of sample A96 (Figure 3), where a mixture of rutile, ilmenite, and Ti2O3 phases was observed by Ti μXANES containing Ti2O3 with none showing pure Ti2O3 phases, suggesting that Magnéli phases (e.g., mixed TiO2 and Ti2O3) are the dominant Ti phases in the WUI fire ash samples. The high relative abundance (0.72) of Ti2O3 in sample A92 suggests that the extent of TiO2 reduction in A92 was much higher than in all other ash samples, with the potential formation of a pure Ti2O3 phase.
The relative abundance of Ti3+ (pre-edge, Figure 4a) and Ti2O3 (LCF; Figure 4b) increases following the order black ash < gray ash < white ash; that is, they increase with combustion completeness. This is because oxygen defect formation and its concentration depend on the fire conditions and increase with combustion temperature. The extent of TiO2 reduction also depends on the C/TiO2 ratio and reaction time, with higher ratios and longer reaction times leading to the formation of the more reduced Magnéli phases 40. The higher abundance of Ti3+ obtained by the pre-peak method (Figure 4a) relative to the relative abundance of Ti2O3 by LCF (Figure 4b) is due to the difference in the analysis procedures. In the pre-edge analysis, the relative abundance of Ti3+ is proportional to the position of the pre-peak that is reconstructed though non-linear least square best fit. In contrast, in LCF procedure, the relative abundance of Ti2O3, which contains two Ti3+, is determined through the reconstruction of one spectrum based on reference spectra.
The transformation of TiO2 during combustion processes to Magnéli phases and their release into the environment may pose public health risks to individuals (e.g., fire recovery workers and residents) and communities through direct and indirect ingestion, inhalation, and absorption. Exposure is likely to occur through disturbance of residual WUI fire ash (e.g., from walking, cleaning, and wind), leading to resuspension and inhalation of particulate matter 41. Exposure to fire ash has been associated with adverse health outcomes ranging from acute symptoms, including coughing, sneezing, and throat and eye irritation, to chronic disease and elevated cancer risk. Such effects might be exacerbated by the phase transformations during combustion processes. For instance, Magnéli phases have been shown to be more toxic than anatase and rutile TiO2 phases. Acute exposure to Magnéli phases reduced zebrafish embryo survival even in the absence of simulated solar radiation 14. In contrast, adverse effects of TiO2 (type P25) occurred exclusively under simulated solar radiation and were primarily attributed to the photo-induced toxicity associated with the production of reactive oxygen species (ROS) 14. Another study demonstrated that Magnéli phases are toxic to the mammalian airway, where they accumulate in macrophages, resulting in increased oxidative stress, mitochondrial dysfunction, cell death, and initiation of gene expression profiles consistent with lung injury within six weeks of exposure 15. The study also demonstrated that chronic exposure to and accumulation of Magnéli phases results in reduced lung function 15.
Figures
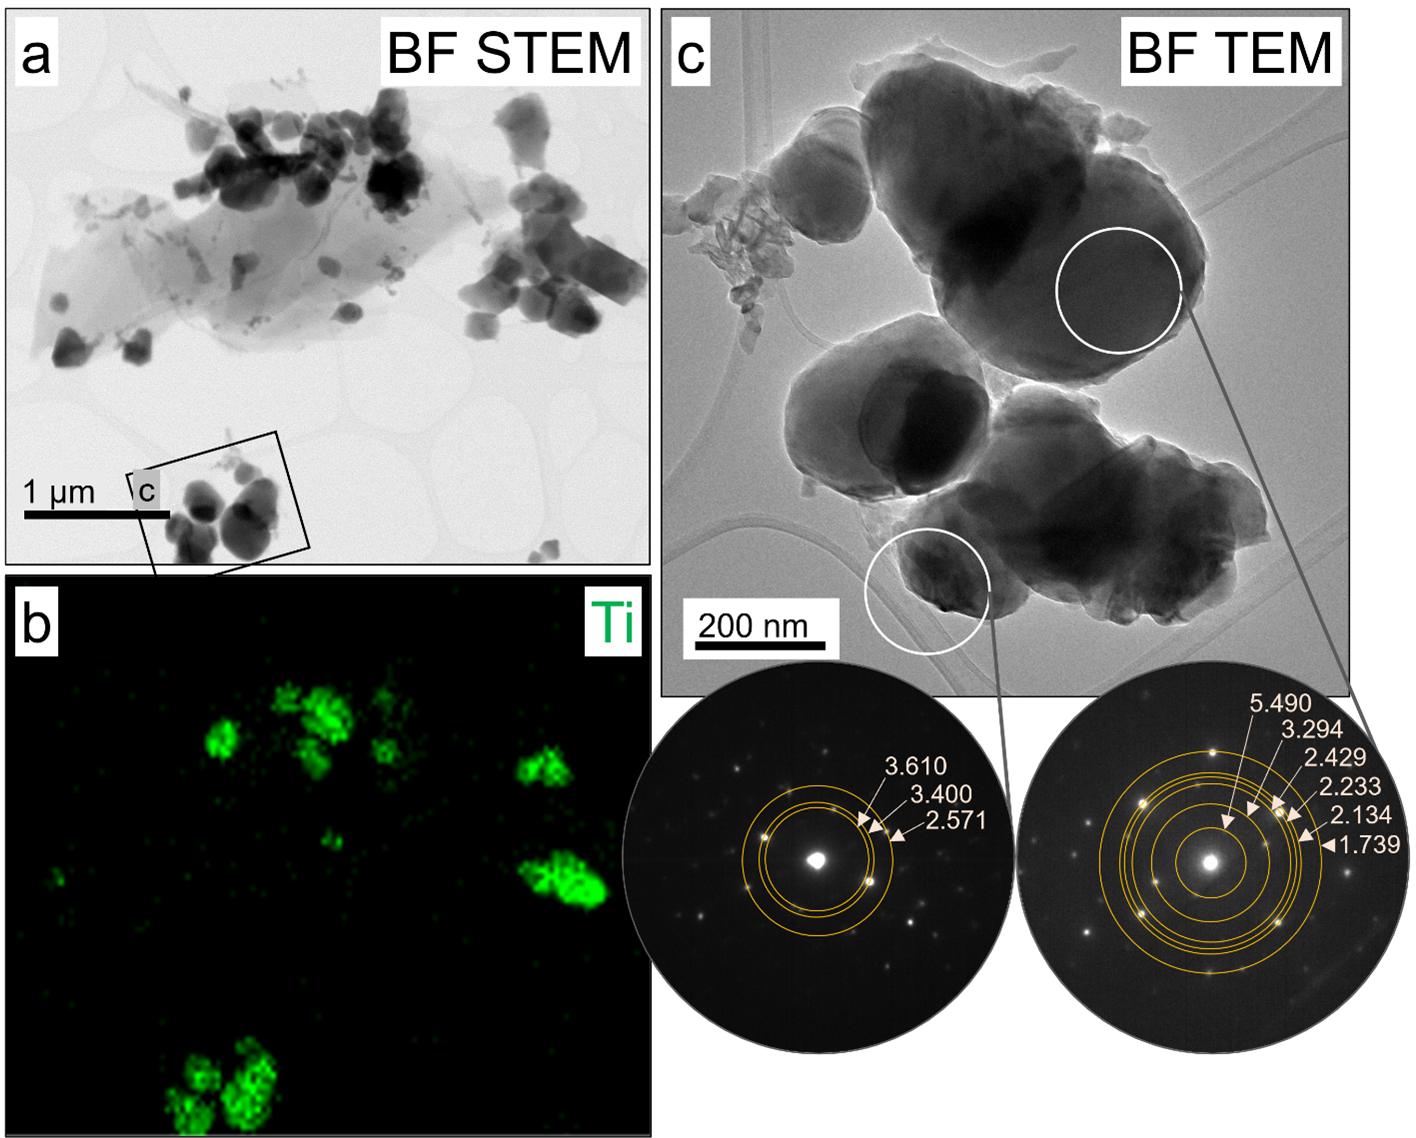
Bright field (BF) scanning transmission electron microscope (STEM) images, an energy dispersive X-ray spectroscopy (EDS) Ti map, and electron diffraction patterns of Ti-bearing nanomaterials from structure ash A124 aggregate 1. (a) shows the aggregate’s overall morphology, whereas (b) illustrates the presence of Ti-bearing materials for the same field of view. In (c), a higher magnification image of a cluster of Ti nanomaterials is shown along with the locations where two electron diffraction patterns were collected. The associated electron diffraction patterns are included with the d-spacing values (in Å) of the overlaid rings, which best matched Magnéli phases.
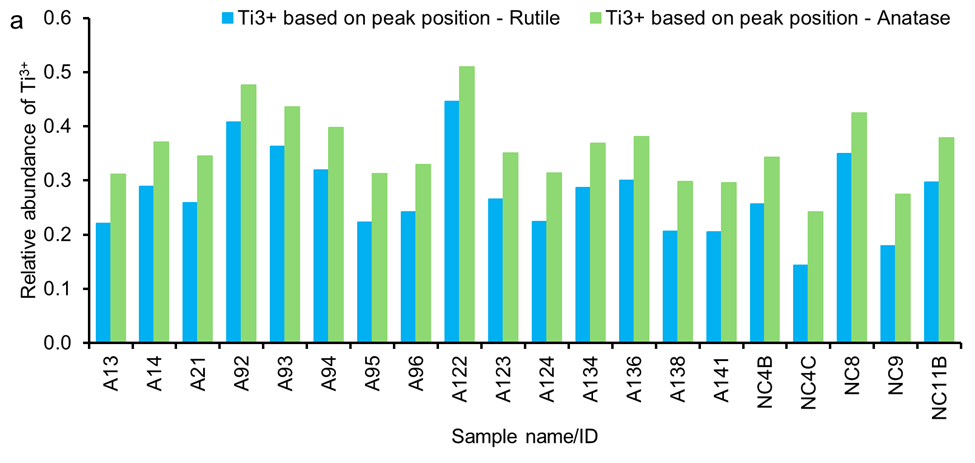
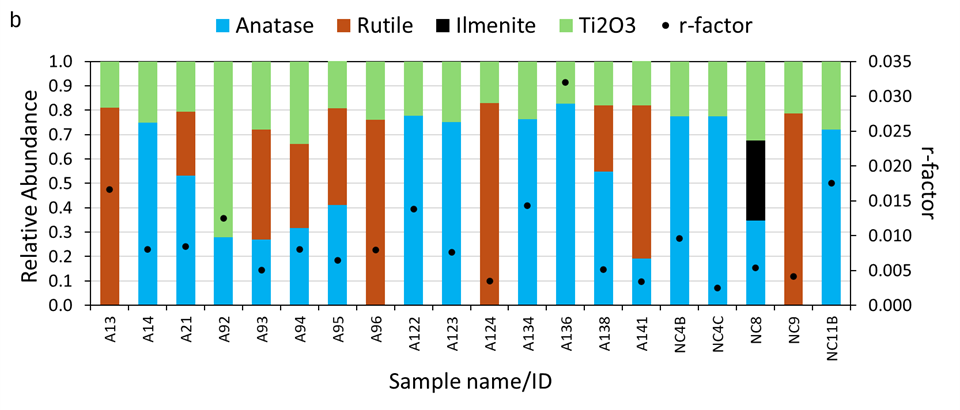
Relative abundance of (a) Ti3+ estimated determined from pre-edge peak position of anatase and rutile phases and (b) Ti-bearing phases determined based on Least-square linear combination fitting (LCF) using spectra of reference compounds, including anatase, rutile, ilmenite, and Ti2O3.
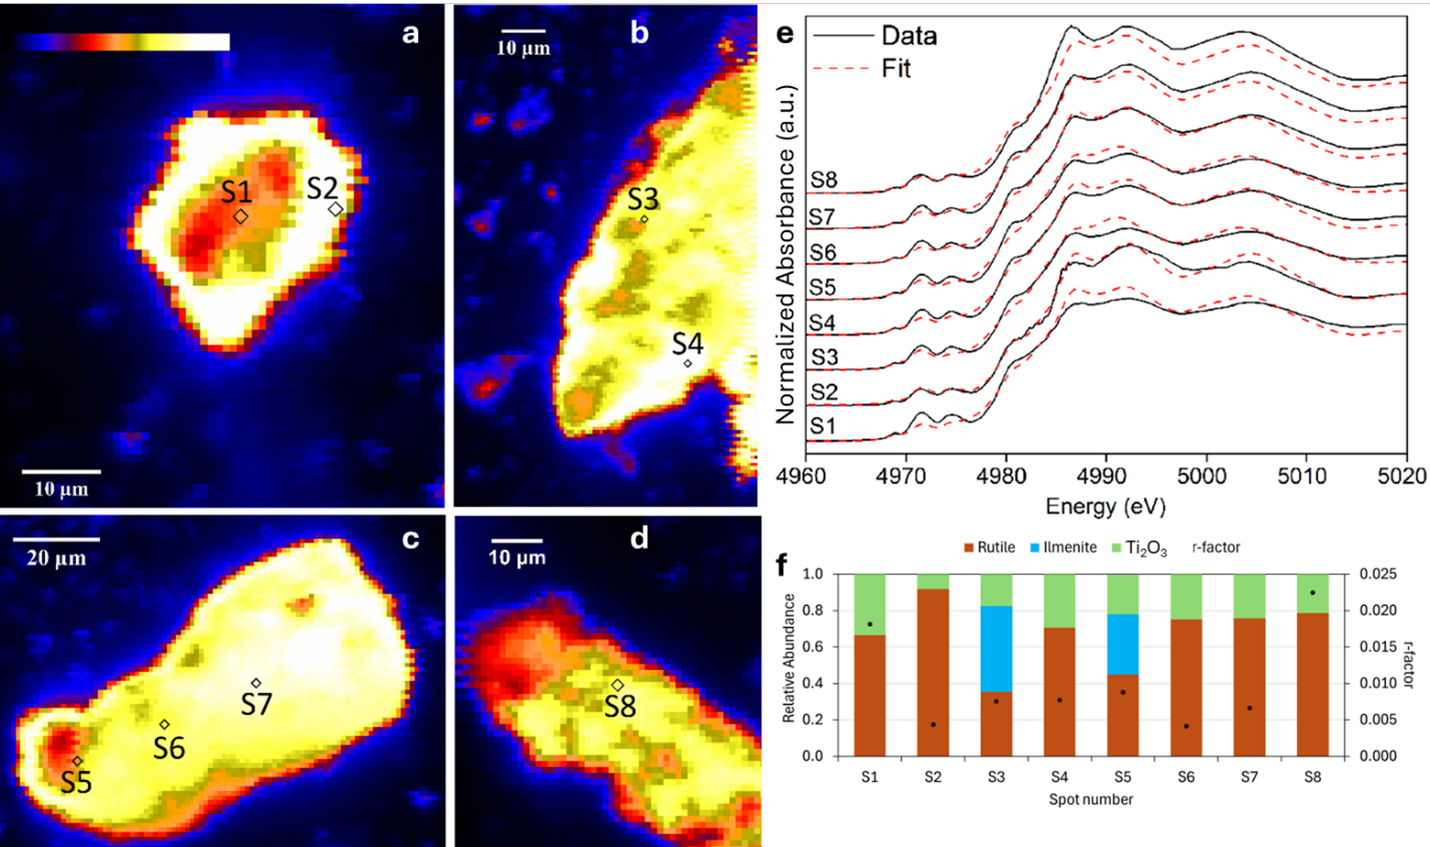
(a-d) Micro-focused X-ray fluorescence (μXRF) maps of representative Ti-bearing grains (<100 μm size) in ash A96 with a series of microspots (S1 to S8) used for Ti K-edge microscale X-ray Absorption Near-Edge Structure (μXANES); (e) linear combination fits (LCF) of Ti K-edge μXANES spectra data of the selected microspots, and (f) the relative abundance of the identified Ti-phases in the analyzed microspot using the reference spectra (rutile, ilmenite and Ti2O3).
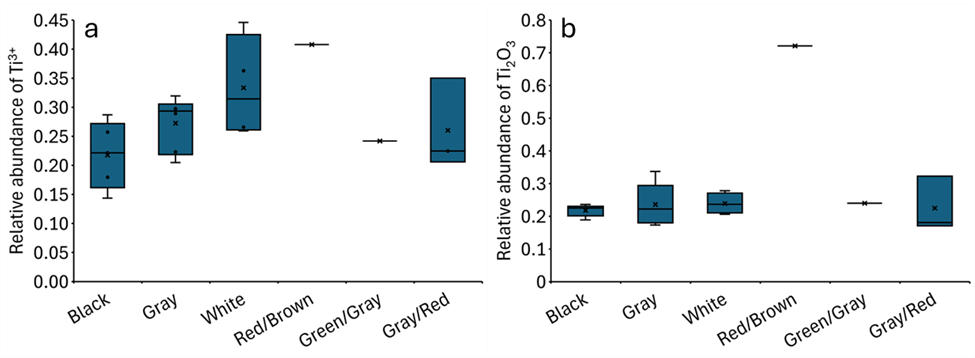
Relative abundance as a function of ash color of (a) Ti3+ determined based on pre-edge peak position and (b) Ti2O3 in the bulk ash samples based on bulk XANES measurements. Ti2O3 was determined based on least-square linear combination fitting (LCF). Black (n=5), gray (n=6), white (n=4), red/brown (n=1), green/gray (n=1), and gray/red (n=3).
References
[8] Kim, Y. H.; Warren, S. H.; Krantz, Q. T.; King, C.; Jaskot, R.; Preston, W. T.; George, B. J.; Hays, M. D.; Landis, M. S.; Higuchi, M., Mutagenicity and lung toxicity of smoldering vs. Flaming emissions from various biomass fuels: Implications for health effects from wildland fires. Environmental Health Perspectives 2018, 126, (1), 017011.
[11] Baalousha, M.; Desmau, M.; Singerling, S.; Webster, J. P.; Matiasek, S.; Stern, M. A.; Alpers, C. N., Discovery and potential ramifications of reduced iron-bearing nanomaterials—magnetite, wüstite, and zero valent iron—in wildland-urban interface fire ashes. Environmental Science Nano 2022, 9, (4136), 4149.
[14] Yang, Y.; Chen, B.; Hower, J.; Schindler, M.; Winkler, C.; Brandt, J.; Di Giulio, R.; Ge, J.; Liu, M.; Fu, Y.; Zhang, L.; Chen, Y.; Priya, S.; Hochella, M. F., Discovery and ramifications of incidental Magnéli phase generation and release from industrial coal-burning. Nature Communications 2017, 8, (1), 194.
[15] McDaniel, D. K.; Ringel-Scaia, V. M.; Morrison, H. A.; Coutermarsh-Ott, S.; Council-Troche, M.; Angle, J. W.; Perry, J. B.; Davis, G.; Leng, W.; Minarchick, V., Pulmonary exposure to Magnéli phase titanium suboxides results in significant macrophage abnormalities and decreased lung function. Frontiers in Immunology 2019, 10, 2714.
[17] U.S. Geological Survey. Titanium and Titanium Dioxide. In: Mineral Commodity Summaries 2025; 2025, 186-187. https://doi.org/10.3133/mcs2025.
[20] Fortune Business Insights. Titanium dioxide market size, share & industry analysis, by grade (anatase and rutile), by process (sulphate and chloride), by application (paints & coatings, plastic, inks, paper & pulp, food & beverages, cosmetics, pharmaceuticals, and others), and regional forecast, 2025-2032. https://www.fortunebusinessinsights.com/titanium-dioxide-tio2-market-102390. Accessed 2026-01-15; 2025.
[26] Sutton, S. R.; Rivers, M. L.; Chariton, S.; Eng, P. J.; Lanzirotti, A.; Newville, M.; Officer, T.; Prakapenka, V. B.; Ryu, Y. J.; Stubbs, J. E.; Tkachev, S.; Wang, Y.; Wanhala, A.; Xu, J.; Xu, M.; Yu, T.; Zhang, D., GeoSoilEnviroCARS (sector 13) at the Advanced Photon Source: A comprehensive synchrotron radiation facility for Earth science research at ambient and extreme conditions. Physics and Chemistry of Minerals 2022, 49, (8), 32.
[36] Leitzke, F.; Fonseca, R.; Göttlicher, J.; Steininger, R.; Jahn, S.; Prescher, C.; Lagos, M., Ti K-edge XANES study on the coordination number and oxidation state of titanium in pyroxene, olivine, armalcolite, ilmenite, and silicate glass during mare basalt petrogenesis. Contributions to Mineralogy and Petrology 2018, 173, 1-17.
Additional Information
Competing interest statement: The authors declare no competing interest.
Author contribution: Dr. Mohammed Baalousha contributed to research conceptualization, project coordination, data analysis, and writing of the first draft. Dr. Charles N. Alpers contributed to field sampling, site and sample description, and edited the manuscript. Dr. Michelle A. Stern prepared land use and fire severity maps. Dr. Morgane Desmau performed data analysis, contributed to data interpretation, and edited the manuscript. Dr. Roberto Colina-Ruiz and Dr. Antonio Lanzirotti conducted microprobe experiments (μXRF elemental mapping and Ti K-edge μXANES spectroscopy) and analysis. Dr. Sheryl A. Singerling conducted nanomaterial characterization using transmission electron microscopy and performed associated data analysis.
Acknowledgements
This work was supported by grants from the National Science Foundation (NSF, 2101983 and 2347694) and National Institute of Health (NIH, 1R21ES037105-01). This work was also supported by the Nanoscale Characterization and Fabrication Laboratory and the Virginia Tech National Center for Earth and Environmental Nanotechnology Infrastructure (NanoEarth), a member of the National Nanotechnology Coordinated Infrastructure (NNCI), supported by NSF (ECCS 1542100 and ECCS 2025151). We acknowledge DESY, a member of the Helmholtz Association HGF, for the provision of experimental facilities. Parts of this research were carried out at PETRA III, and we would like to thank Edmund Welter for measuring the Ti XANES spectra at beamline P65. We would like to thank Dr. Nicholas Marcella (Joint Photon Sciences Institute, State University of New York at Stony Brook) for providing some of the Ti references spectra. μXRF maps and μXANES spectroscopy data were collected at GeoSoilEnviroCARS (GSECARS) beamline 13-ID-E, sector 13 at Advanced Photon Source (APS) in Argonne National Laboratory. GSECARS is supported by the National Science Foundation, Earth Sciences (EAR-1128799) and the Department of Energy, Geosciences (DE-FG02-94ER14466). Use of the Advanced Photon Source was supported by the U.S. Department of Energy, Office of Science, Office of Basic Energy Sciences, under contract no. DE-AC02-06CH11357. Support was also provided by the U.S. Geological Survey through the Environmental Health Program of the Ecosystems Mission Area. Any use of trade, firm, or product names is for descriptive purposes only and does not imply endorsement by the U.S. Government. We thank Drs. Jackson P. Webster and Sandrine J. Matiasek (California State University, Chico) for performing field sampling campaigns and providing information on the sampling sites and the collected samples. Data are not publicly available but can be made available to interested parties upon request.
Supporting information
Study Site and sample collection
Two wildland-urban interface fire sites that burned during the 2020 California fire season were examined in this study including the North Complex (NC) Fire, also known as the Bear Fire or the Claremont-Bear Fire, and the Sonoma-Lake-Napa Unit (LNU) Lightning Complex Fire (Figure S1).
The North Complex (NC) Fire, the seventh largest in California history and the second largest recorded in the northern Sierra Nevada, burned 1,290 km2 and destroyed 2,455 structures in the Feather River watershed northeast of Lake Oroville, California, between August 17 and December 3, 2020. The West Zone of the fire consisted of 342 km2 located primarily within the Plumas National Forest. Within the fire perimeter, the distribution of burn severity was 2% low, 8% moderate, and 89% high based on a composite burn index using multiple satellite-based spectral indices (Figure S1a) 1, 2. The land use within the burned area was 84% evergreen forest, and 12% shrub/scrub. The elevation averaged 1,153 m and ranged from 260 to 2,132 m (Figure S2). Fire ash samples were collected in the Berry Creek community, where most of the structures were destroyed (Table S1, Figure S2).
The LNU Lightning Complex Fire, the sixth largest in California history, burned 1,470 km2 and destroyed 1,491 structures in Colusa, Lake, Napa, Sonoma, Solano, and Yolo Counties, approximately 60 km west of Sacramento, between August 17 and October 2, 2020 3. Within the fire perimeter, the distribution of burn severity was 12% low, 39% moderate, and 49% high (Figure S1b). Land use in the fire perimeter comprised of 57% shrub/scrub, 19% herbaceous, 12% evergreen forest, and 1.4% developed (Figure S3). Elevation within the fire footprint was on average 370 m and ranged between 40 and 930 m. Fire ash samples were collected from the built environment in Napa and Solano Counties in the vicinity of Lake Berryessa (Table S1, Figure S3)
Sample collection
Forty-two ash samples, including 32 from the LNU Lightning Complex Fire and 10 from the North Complex Fire, were collected from burned structures, vehicles, and garages during October-November 2020 (Figures S2 and S3, Table S1). The burned structures included residences, a convenience store, and storage sheds; burned vehicles included automobiles, tractors, and a boat on a trailer. Within the LNU Lightning Complex Fire area, undisturbed ash samples were collected from burned structures to represent specific location sources. Ash samples were collected from multiple locations (e.g., kitchen, living room, bedroom, garage, foundation, etc.) within each residential structure; detached structures adjacent to residences (e.g., sheds, barns, and trailers) and a commercial structure (convenience store) were also sampled (Table S1). Ash samples (50 to 500 g) were collected with disposable plastic scoops and placed into zippered plastic bags. Within the NC Fire area, ash samples (Table S1) were collected from around Madrone Lake in the Berry Creek Census Designated Place. In burned structures from the NC Fire area, ash collected from multiple locations within the footprint of the structure was combined to form a representative composite sample (Figure S2).
Transmission Electron Microscopy
Five of the 42 ash samples, including vehicle ash A13, structural ashes A122 and A124, and vehicle/structure ashes A131 and A132, were characterized by TEM to determine the morphology, size, and crystalline structures of Ti-bearing particles present in the WUI fire ash. The samples were prepared for TEM analyses by the drop-casting method using suspensions of sieved (<2 mm) WUI fire ash dispersed in methanol. The suspensions were shaken, allowed to sit for several minutes, and then dropped onto LC300-Cu-150 TEM grids (Electron Microscopy Sciences, Hatfield, PA, USA), which consist of a lacey C support layer attached to a 300-mesh Cu grid. The TEM samples were stored in a vacuum desiccator for at least 24 hours before being analyzed. The TEM data were collected on a JEOL JEM 2100 S/TEM (JEOL USA, Peabody, MA, USA), operated at 200 kV. TEM bright field images were acquired with a Gatan Ultrascan 1000XP CCD camera (Gatan, Pleasanton, CA, USA), whereas selected area electron diffraction patterns were collected with a Gatan Orius 833 slow scan CCD camera (Gatan, Pleasanton, CA, USA). Energy dispersive X-ray spectroscopy (EDS) elemental maps were obtained using a JEOL genuine 60 mm2 Silicon Drift Detector (JEOL USA, Peabody, MA, USA). For phase identification, we used a combination of compositional information from EDS analyses and electron diffraction data. For particles > 200 nm, we used selected area electron diffraction, but for smaller particles or those overlapping with adjacent material to a significant extent, we ran fast-Fourier-transforms (FFTs) on high-resolution TEM bright field images, a technique which generates diffractograms.
The differences in the electron orbital 1s-3d centroid peak (peak A2 in Figure S6) position of Ti2O3 is attributed to the fitting procedure used in the different studies. Whereas all studies fitted TiO2 pre-edge feature as three peaks, the two studies by Waychunas (1987) and Leitzke et al. (2018) fitted Ti2O3 pre-edge feature as one broad peak. In contrast, in our analysis, we fitted both TiO2 and Ti2O3 pre-edge features as three peaks (see Figure S6).
Oxidation state and relative abundance of Ti3+ and Ti2O3 in a Magnéli phases
Oxidation state of Ti. Magnéli phases (TinO2n−1) are characterized by mixed oxidation states (e.g., Ti4+ and Ti3+) due to oxygen vacancies. Based on charge neutrality, Ti ions balance the charge of oxygen ions. In TinO2n−1, there are n Ti ions and 2n−1 oxygen ions. Total charge from oxygen = −2(2n−1)= -4n + 2. The average oxidation state of Ti is the total oxygen charge divided by the number of Ti atoms (n). Thus, the average oxidation state of Ti=−(−4n+2)/n=4−2/n.
Fraction of Ti3+. The relative abundance of Ti3+ in Magnéli phases can be calculated based on the oxidation states of Ti in the structure. Assuming that the fraction of Ti3+ in Magnéli phases is x, then: x⋅3+(1−x)⋅4=4−2/n. Solving for x, then, x=4−(4−2/n) =2/n.
Fraction of Ti2O3. Each Ti2O3 contains two Ti3+ ions. Thus, the relative abundance of Ti2O3 = the relative abundance of Ti3+ ions divided by 2 = 1/n.
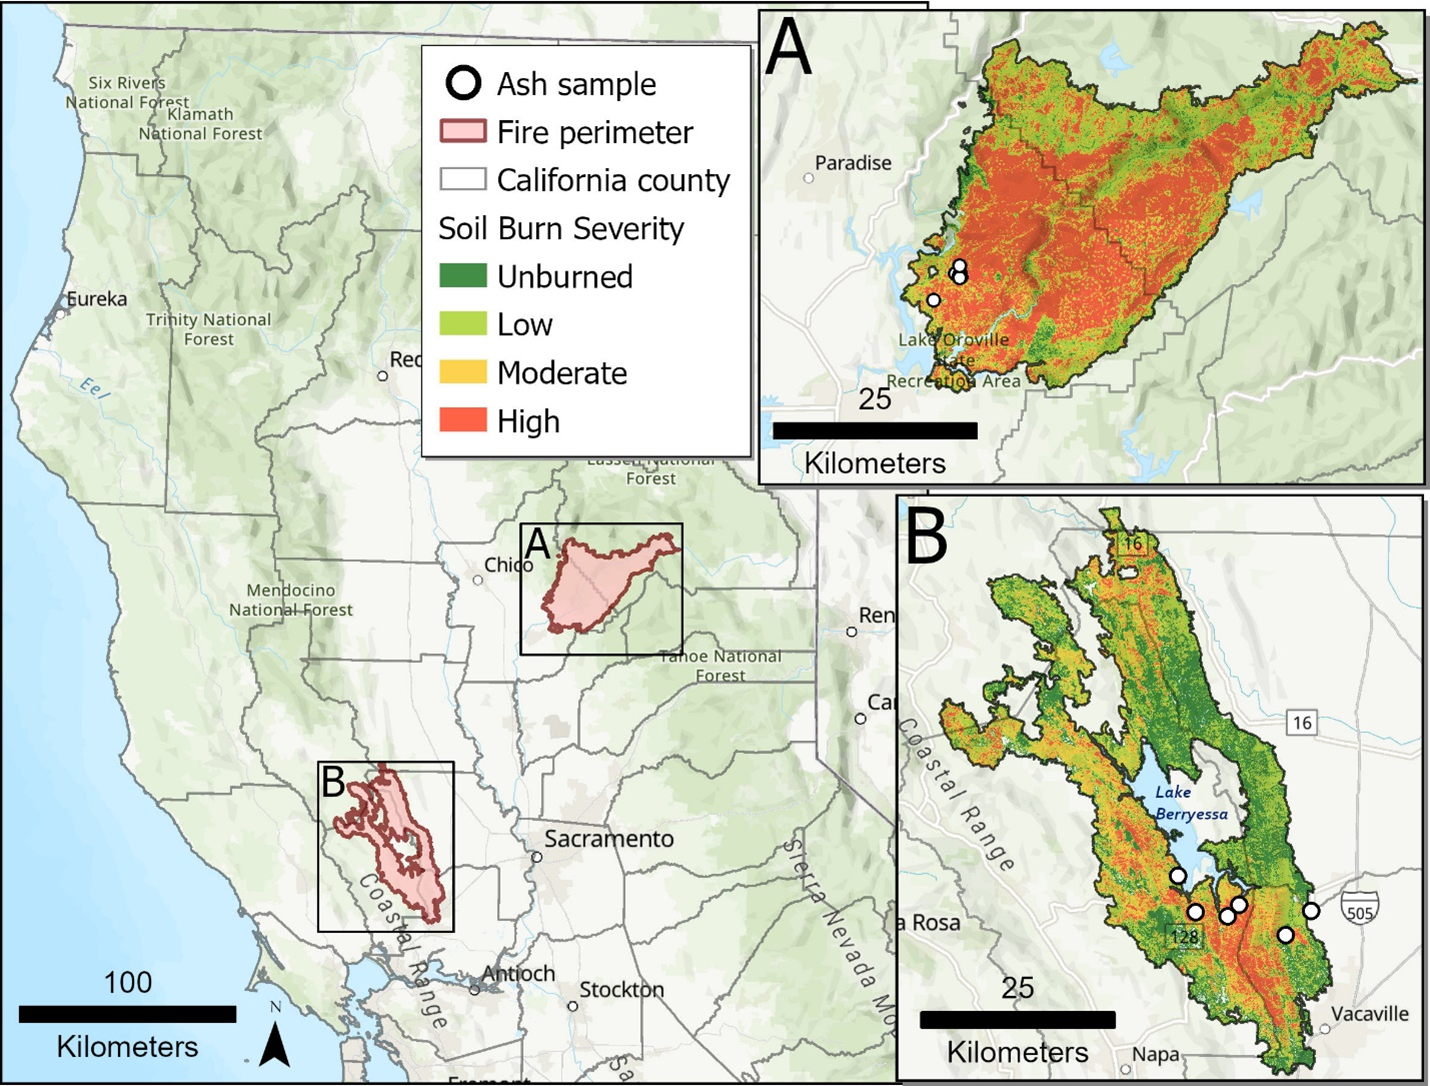
Map of soil burn severity in the two fires investigated in this study (A) the North Complex (NC) and (B) the Sonoma-Lake-Napa Unit (LNU) Lightning Complex. Base map from Esri and its licensors, copyright 2025. Burn severity data from the Forest Service, U.S. Department of Agriculture: https://apps.fs.usda.gov/arcx/rest/services/RDW_Wildfire/MTBS_CONUS/MapServer
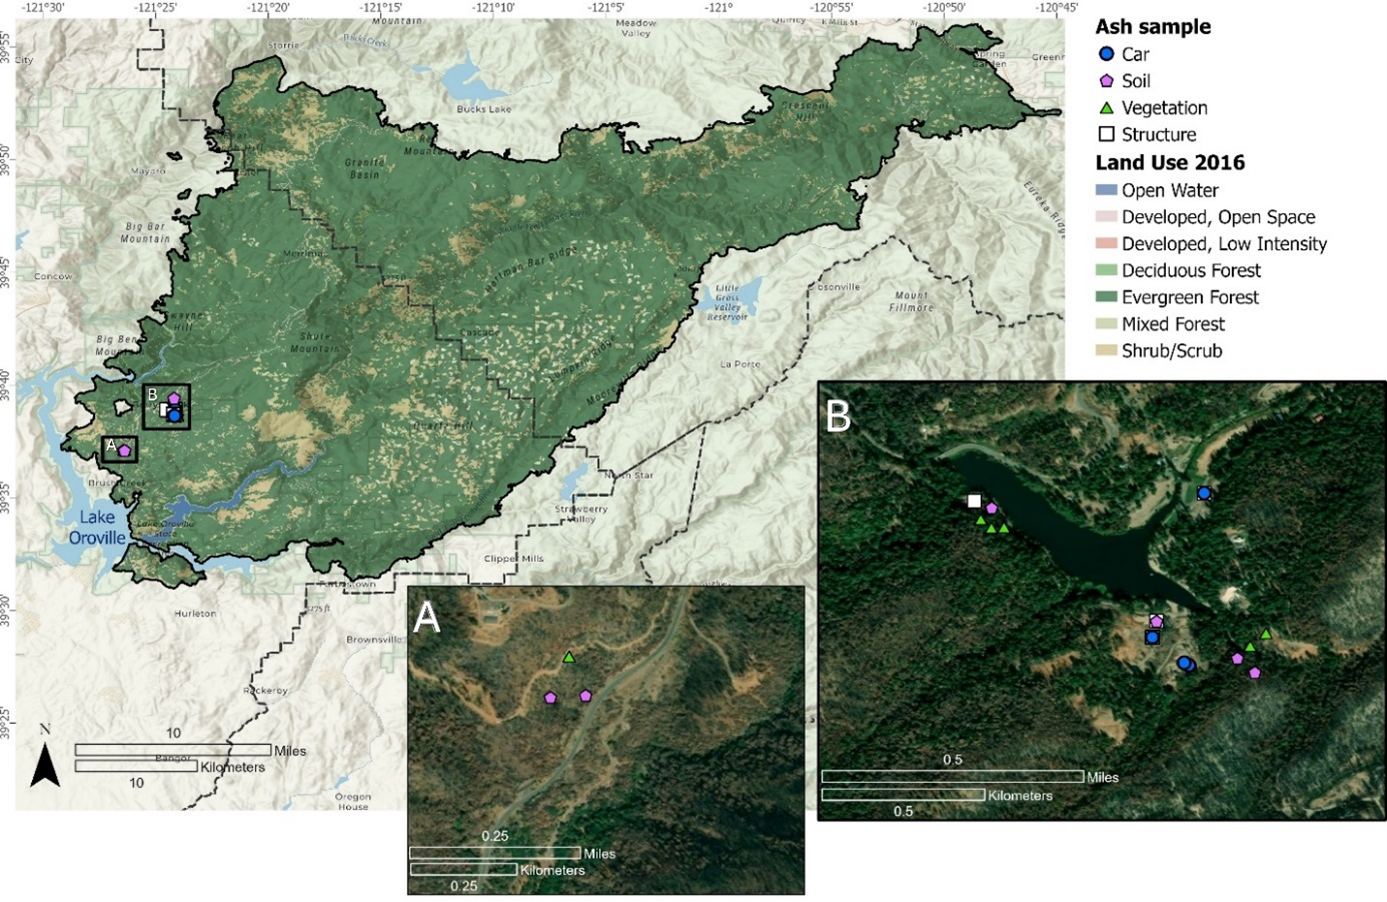
Pre-fire land use classification for the North Complex fire area and approximate locations of ash samples. (A) Inset map within the Berry Creek Census Designated Place in Butte County, California, showing locations of soil and vegetation samples; (B) inset map within the Berry Creek Census Designated Place, showing locations of Madrone Lake and soil, structure, vegetation, and vehicle (car) related ash samples. Base map from Esri and its licensors, copyright 2025. Land use data from National Land Cover Database (NLCD, https://www.mrlc.gov/, accessed Feb. 1, 2021).
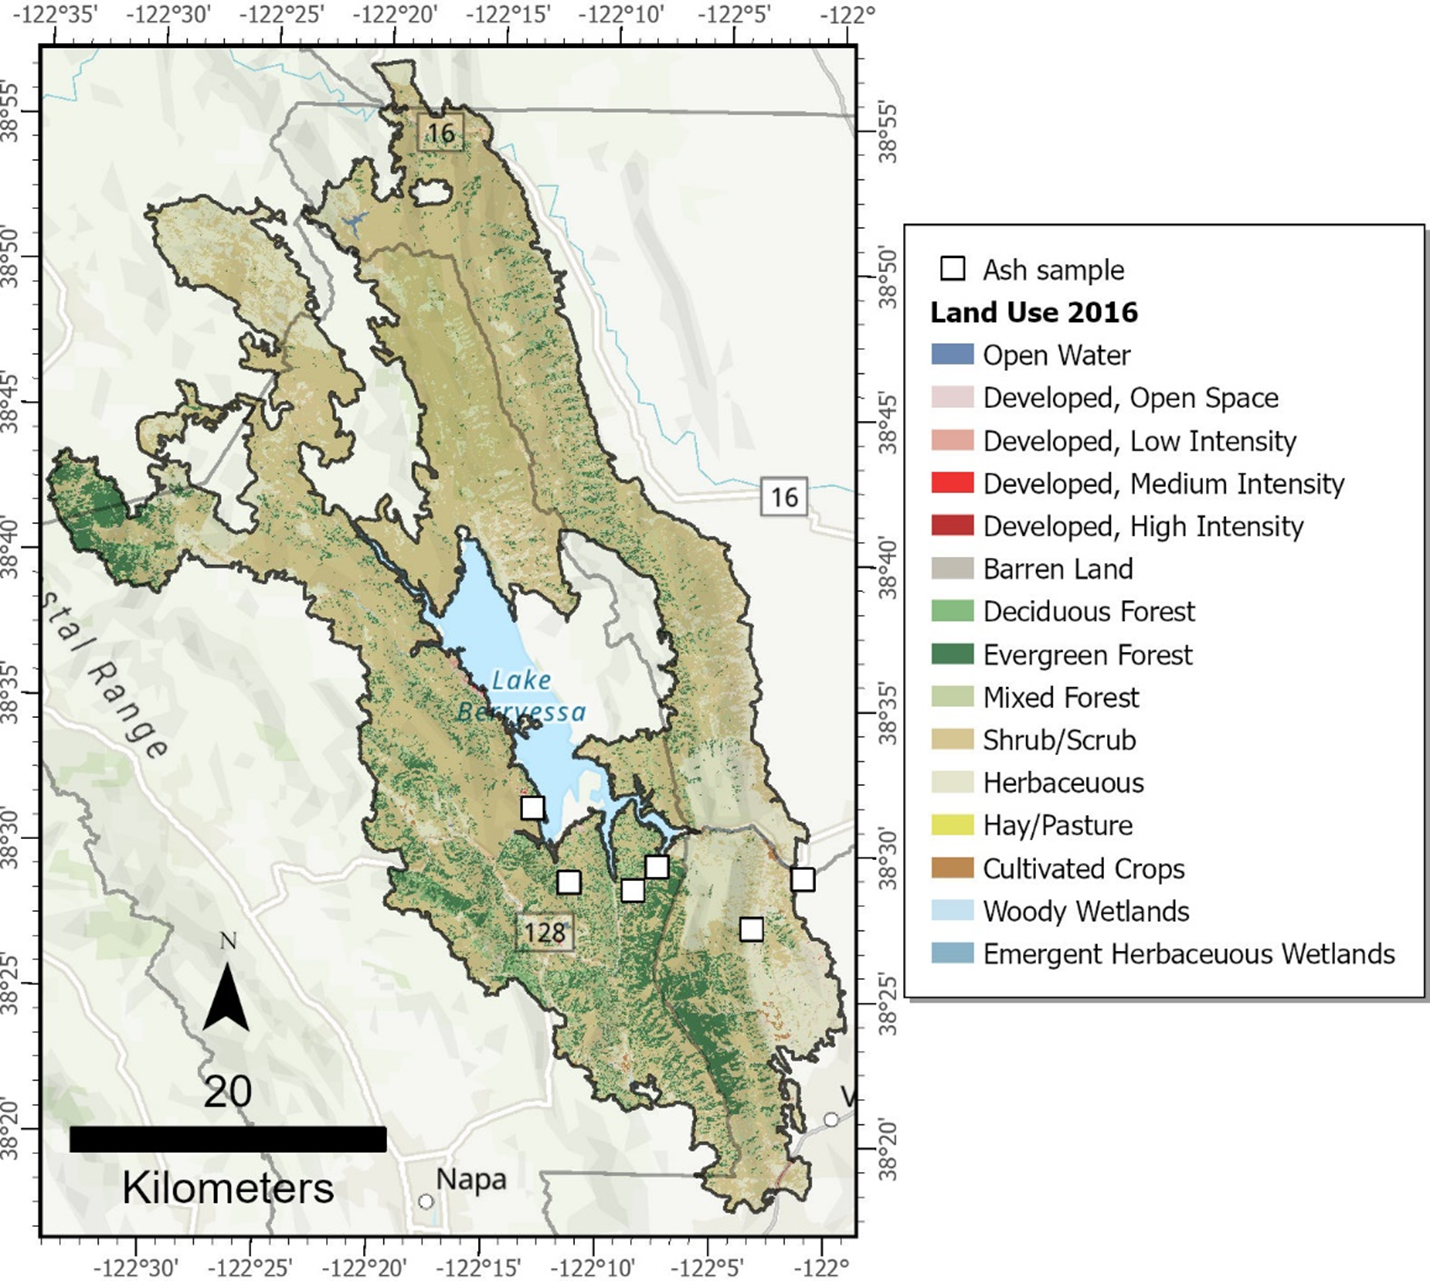
Pre-fire land use classification for the LNU Lightning Complex fire and approximate locations of ash samples in Napa and Solano Counties, California. Base map from Esri and its licensors, copyright 2025. Land use data from National Land Cover Database (NLCD, https://www.mrlc.gov/, accessed Feb. 1, 2021).
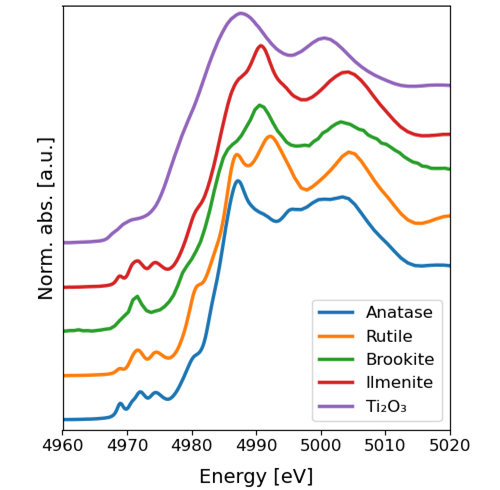
Titanium K-edge X-ray Absorption Near-Edge Structure (XANES) spectra of the model compounds used to fit the titanium K-edge XANES spectra of the fire ashes. Norm. abs: noralized absorption; a.u., arbitrary units; eV, electron-volt.
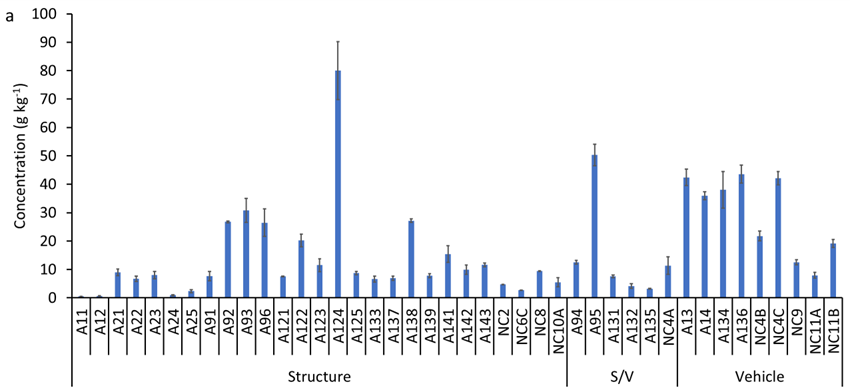
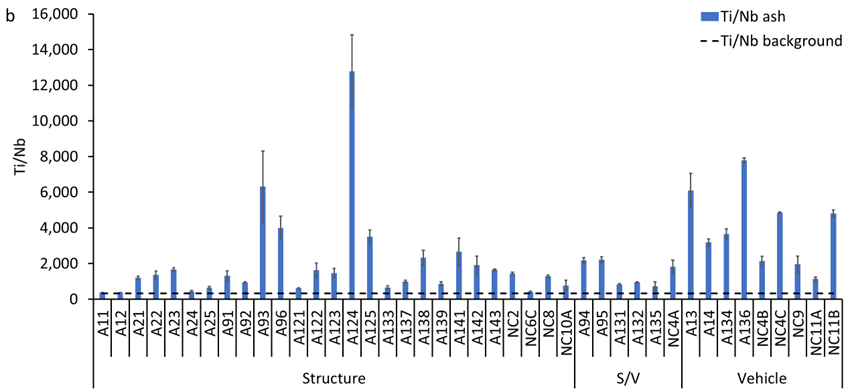
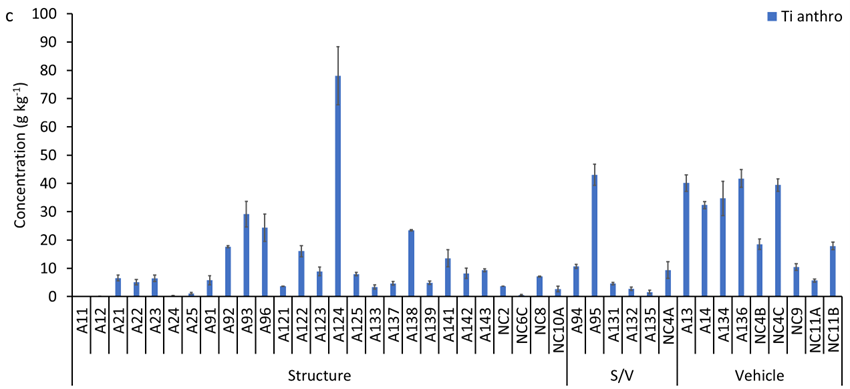
(a) Concentration of total titanium (Ti), (b) Ti/Nb ratio, and (c) concentration of anthropogenic Ti in the studied wildland-urban interface (WUI) fire ashes. A refers to Sonoma-Lake-Napa Unit (LNU) Lightning Complex Fire samples and NC refers to North Complex Fire samples. S/V refers to structure/vehicle.
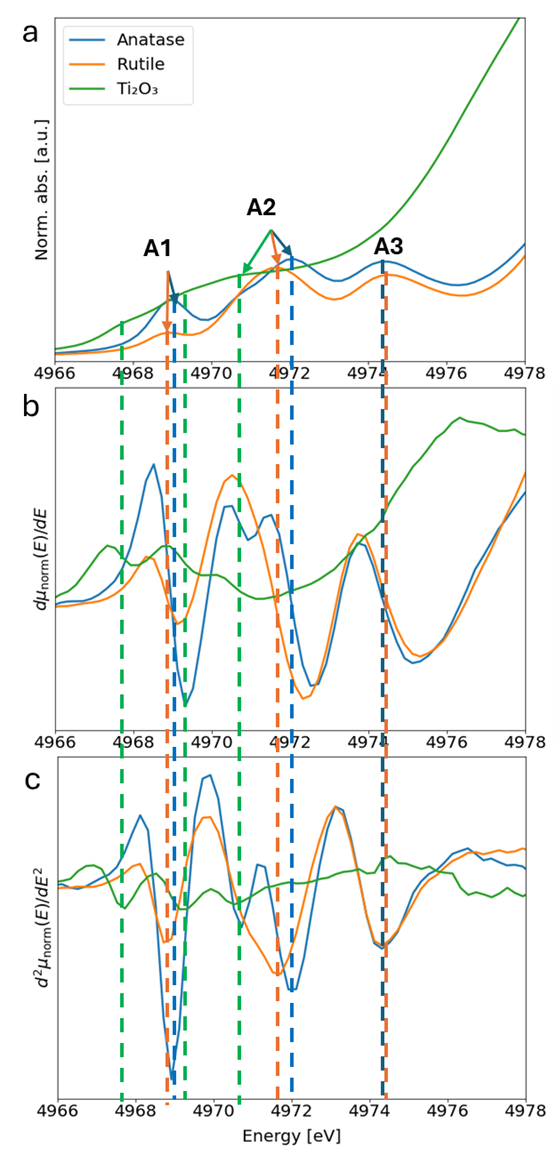
Pre-edge peak position, (a) normalized absorption (µ(E)), (b) first derivative of normalized absorption (dµnorm(E)/dE), and (c) second derivative of (d2normµ(E)/dE2). Indicators indicate the centroid of 1st to 3rd peak position for Ti2O3 and TiO2 (rutile, brookite, and anatase). Together these three panels illustrate that the pre-edge feature of all reference material consists of three peaks with split second peak for anatase and overlapping peaks for Ti2O3. The position of the 1st to 3rd peak position for the three reference spectra is listed in Table S4. Norm. abs., normalized absoprtion; a.u., arbitrary units; eV, electron-volt.
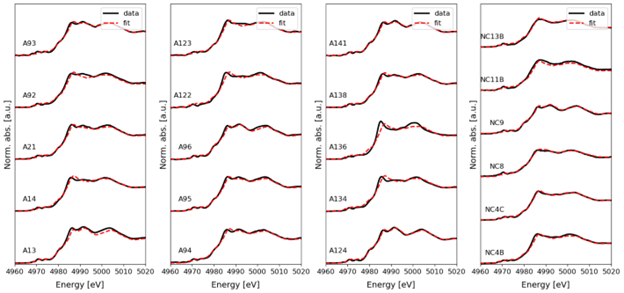
Linear combination fitting of Ti k-edge X-ray Absorption Near-Edge Structure (XANES) spectra from the different ashes. Norm. abs: normalized absorption; a.u., arbitrary units; eV, electron-volt.
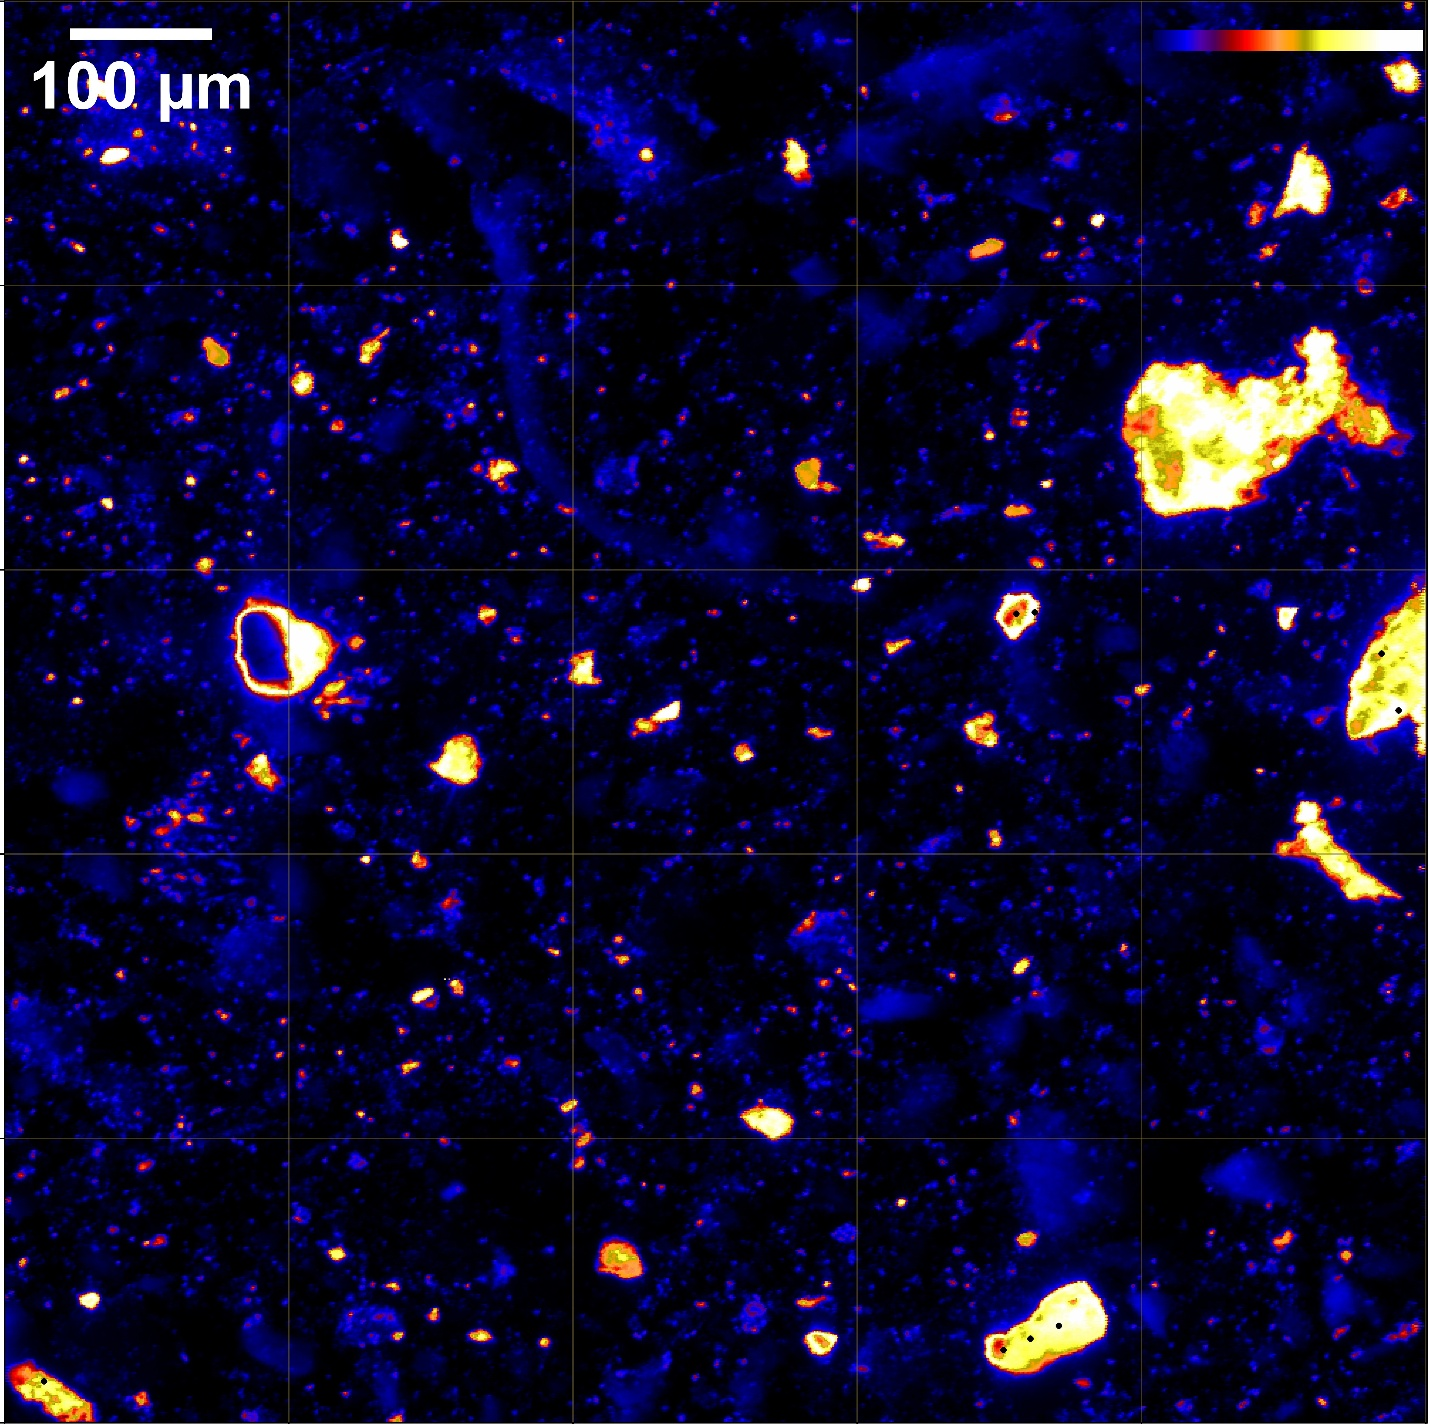
A representative 1 mm x 1 mm micro-focused X-ray fluorescence (μXRF) elemental map on sample A96 showing the microscale spatial distribution of Ti. The color scale in the upper right corner indicates the normalized flourescence intensity (Kα/I0, where Kα is the measured fluorescence intensity and I0 is the incident beam intensity) from high in yellow to low in blue. The normalized fluorescence intensity is corrleated with Ti cocnentration.
Table S1.
Description of ashes collected following the 2020 fire season. Samples analyzed by Scanning Transmission Electron Microscopy (STEM) are highlighted in gray. Samples analyzed by XAFS are highlighted by *. Sample A96 was analyzed by micro-focused X-ray fluorescence (μ-XRF) and microscale X-ray Absorption Near-Edge Structure (μXANES).Table S3.
Transmission electron microscopy (TEM) electron diffraction data for Ti-bearing nanomaterials (NMs) in vehicle ash A13, structural ash A24, and vehicle/structure ashes A131.[ROI, region of interest; measured d, measured interatomic distance; phase, crystalline phase; theoretical d, theoretical interatomic distance; hkl, crystallographic planes; %diff, the percentage difference between the measured d and the theoretical d; HR, high resolution; DP, diffraction pattern]
Table S4.
Position of the pre-edge peak for the Ti-mineral reference materials. The data in this study was determined based on pre-edge peak fitting using Larch.Table S5.
Position of the electron orbital 1s-3d pre-edge peak (peak A2 in Figure S6) position for ash samples. The 1s-3d pre-edge peak position was determined based on pre-edge peak fitting using Larch.Table S6.
Relative abundance (RA) of titanium (Ti) phases in the bulk ash samples determined by linear combination fit (LCF, fitting window = -20 to 30) performed on the measured bulk X-ray Absorption Near-Edge Structure (XANES) spectra. Sample A96, shaded by gray color, was analyzed by micro-focused X-ray fluorescence (μXRF) and microscale X-ray Absorption Near-Edge Structure (μXANES) and results of μXANES fits are presented in Table S7. Blank cells indicate that phase is not present in the LCF.Table S7.
Relative abundance (RA) of titanium (Ti) phase in micro-spots determined by linear combination fit (LCF, fitting window = -20 to 30) performed on measured microscale X-ray Absorption Near-Edge Structure (μXANES) spectra in ash A96. Blank cells indicate that phase is not present in the LCF.Table S9.
Estimation of the concentration of Magnéli phases in wildland-urban interface (WUI) fire ashes assuming all Magnéli phases occur as Ti6O11, Ti7O13, Ti8O15, and Ti9O17. Highlighted in gray are the phases that could explain the fraction of Ti2O3 in the WUI fire ashesReferences
[1] CALFire. 2020 Incident Archive. https://www.fire.ca.gov/incidents/2020/. Accessed 2025-05-10.
[3] CALFire. LNU Lightning Complex (includes Hennessey, Gamble, 15-10, Spanish, Markley, 13-4, 11-16, Walbridge) Incident. https://www.fire.ca.gov/incidents/2020/8/17/lnu-lightning-complex-includes-hennessey-gamble-15-10-spanish-markley-13-4-11-16-walbridge/; 2022.
[4] Leitzke, F.; Fonseca, R.; Göttlicher, J.; Steininger, R.; Jahn, S.; Prescher, C.; Lagos, M. Ti K-edge XANES study on the coordination number and oxidation state of Titanium in pyroxene, olivine, armalcolite, ilmenite, and silicate glass during mare basalt petrogenesis. Contributions to Mineralogy and Petrology 2018, 173, 1-17.
Authors
Disclaimers
Any use of trade, firm, or product names is for descriptive purposes only and does not imply endorsement by the U.S. Government.
Although this information product, for the most part, is in the public domain, it also may contain copyrighted materials as noted in the text. Permission to reproduce copyrighted items must be secured from the copyright owner.
Suggested Citation
Baalousha, M., Desmau, M., Colina-Ruiz, R.A., Lanzirotti, A., Singerling, S., Stern, M.A., and Alpers, C.N., 2026, Widespread occurrence of Magnéli phases in wildland-urban interface fire ashes: Environmental Science and Technology., v. 60, no. 14, p. 10982-10990, https://doi.org/10.1021/acs.est.5c09885.
Study Area
| Publication type | Article |
|---|---|
| Publication Subtype | Journal Article |
| Title | Widespread occurrence of Magnéli phases in wildland-urban interface fire ashes |
| Series title | Environmental Science and Technology. |
| DOI | 10.1021/acs.est.5c09885 |
| Volume | 60 |
| Issue | 14 |
| Publication Date | March 29, 2026 |
| Year Published | 2026 |
| Language | English |
| Publisher | American Chemical Society |
| Contributing office(s) | California Water Science Center |
| Description | 9 p. |
| First page | 10982 |
| Last page | 10990 |
| Country | United States |
| State | California |
| Other Geospatial | North Complex Fire, Sonoma-Lake-Napa Unit Lightning Complex Fire |