

Abundance and movement patterns of fish accessing a reconnected Lake Erie coastal wetland: Insights from high-resolution sonar data
Links
- More information: Publisher Index Page (via DOI)
- Document: XML
- Data Release: USGS data release - Fish activity and movement information derived from acoustic monitoring of a restored Lake Erie coastal wetland from 2011-2014
- Open Access Version: USGS Accepted Manuscript
- Download citation as: RIS | Dublin Core
Introduction
Coastal wetlands of the Laurentian Great Lakes (hereafter “Great Lakes”) are key sources of ecosystem services including flood mitigation, water filtration, and carbon sequestration (Bernal and Mitsch, 2012; Rea et al., 2015; Allan et al 2017; Loder et al., 2023). In addition, these habitats provide essential support for numerous fish and wildlife species of conservation or economic concern (Raphael and Jaworski, 1979; Maynard and Wilcox, 1996; Sierszen et al., 2012; Grand et al., 2020). Despite their immense ecological, cultural, and economic value, most of the coastal wetlands of the Great Lakes were considerably diminished or entirely eliminated by the early 20th century. This loss was driven by the agricultural, industrial, and residential demands of a rapidly growing population (Bosley, 1978; Wilcox, 1995; Gottgens et al., 1998). In particular, the shoreline of Lake Erie’s western basin experienced an exceptionally high rate of wetland loss since 1850, with current wetland areas comprising less than 5% of their historic extent (Herdendorf, 1992; Allinger and Reavie, 2013).
The wetland areas that persist are often hydrologically isolated from the wider lake system by earthen dikes, which are intended to protect coastal areas from erosion and facilitate control of water levels by management organizations. While these diked pools may superficially resemble intact coastal wetlands in terms of hydrologic characteristics, they are typically of lower biological quality, harbor different biotic communities, and provide fewer or impaired beneficial functions compared to their more natural counterparts (Johnson et al., 1997; Frieswyk and Zedler, 2007; Cvetkovic and Chow-Fraser, 2011; though see Sherman et al., 1996 for relationship between hydrological connection and floral diversity). This degradation is due, in part, to the biotic and abiotic effects of hydrological isolation from the primary lake system (Mitsch and Wang, 2000; Bouvier et al., 2009; Sierszen et al., 2019; O’Reilly et al., 2023). For instance, although Lake Erie’s coastal wetlands can serve as breeding, foraging, nursery, and refuge grounds for dozens of fish species, diked wetlands are typically inaccessible for these uses (Jude and Pappas, 1992; Randall et al., 1996; Trebitz and Hoffman, 2015; Schoen et al., 2016). These changes in landscape function likely contribute to differences between historic and contemporary accounts of wetland utilization by fish (Smith, 1972).
However, the construction of water-control structures that restore connection between diked wetlands and wider lacustrine systems can preserve the advantages of diked wetlands while simultaneously promoting functions and services that have been degraded or inhibited (Kowalski et al., 2014; Hartig et al., 2018). Implementing such structures facilitates fish passage between nearshore and wetland zones, resulting in maintenance of ecological processes. For instance, enhanced access to spawning and nursery grounds could assist in stabilizing Great Lakes fish populations, while enhanced energy transfer between coastal and offshore areas could bolster food web resiliency (Fracz and Chow-Fraser, 2012; Gorman et al., 2012; Montgomery et al., 2020).
Decades of heightened awareness surrounding these benefits have led to intensified interest, funding, and implementation of Great Lakes wetland restoration and connectivity efforts (Steinhart et al., 2017; United States Environmental Protection Agency, 2023). As these restoration projects proliferate, the need for techniques to describe and quantify their success, outcomes, and long-term effects is increasingly urgent. Such characterizations could enhance current management and guide future restoration efforts (Whillans, 1996; Zhao et al., 2016).
A crucial aspect of assessing the success of wetland restoration is evaluating fish use of reconnected wetland habitats (Landsman, et al., 2011; Uzarski et al., 2017; Rummell et al., 2023). Changes in community structure may be a desired restoration goal itself, but it also may be an indicator of a system’s biological quality (Uzarski et al., 2005). Although it is generally recognized that fishes utilize restored wetland areas, the exact temporal dynamics and environmental factors influencing their use remain unclear despite their significance for management agencies (though see Stott and Miner, 2022). Moreover, while seasonal fluctuations have been documented and are likely present in restored Great Lakes coastal wetlands, the short-term variability in fish use of these systems is not well understood (Schoen et al., 2016; Langer et al., 2018; Diller et al., 2022; Stott and Miner 2022).
These environments are generally difficult to access and work in, which makes continuous or frequent monitoring with traditional survey techniques challenging (Kaller et al., 2013). Recently, however, high-resolution acoustic sonar has emerged as a method for digitally observing fish activity in wetlands (Boswell, et al., 2008; Chizinski, et al., 2016; Budnik and Miner, 2017, Eggleston et al., 2020). This unobtrusive technology emits and receives sound waves to detect and visualize underwater objects. By utilizing sound waves, sonar offers superior performance in turbid or low-light situations compared to video imaging. The resulting images can be stored and processed ex situ using a growing array of software tools to derive size and directional heading information for observed fish (Eggleston et al., 2020). The use of this technology creates new opportunities for research and monitoring of coastal restoration projects at much greater temporal scales and resolutions than previously possible. Traditional methods of sampling fish communities, such as fyke nets, are often deployed over many hours or even entire days. In contrast, continuous acoustic monitoring allows for the description of much more fine-scale dynamics. In this study, we describe the application of acoustic sonar technology to monitor fish utilization of recently reconnected wetland habitats, focusing on daily, seasonal, and annual changes. The patterns of use that we identify could help management agencies time certain interventions more strategically, thereby enhancing effectiveness or reducing undesirable impacts arising from restoration or management activities.
Methods
Study Area
Data were collected within Ottawa National Wildlife Refuge in Oak Harbor, Ohio, USA (41° 37' 22.6”N, 83°12' 37.5”W). This federal conservation area is managed by the U.S. Fish and Wildlife Service (USFWS) and located on the southwest shore of Lake Erie (Figure 1). The refuge encompasses a large complex of Great Lakes coastal wetlands that have been extensively altered by human activity. As such, it contains many wetland pools that are isolated from the neighboring riverine and lacustrine systems by earthen dikes. Although these wetland, creek, and lake environments are spatially close, they differ in their chemical and physical characteristics. Consequently, they support similar, but not identical, communities of large-bodied fish. Common Carp (Cyprinus carpio) and Bowfin (Amia calva) are common throughout, while Northern Pike (Esox lucius) and Yellow Bullhead (Ameiurus natalis) predominate in wetlands, and Gizzard Shad (Dorosoma cepedianum) and Smallmouth Buffalo (Ictiobus bubalus) are more common in the creek environment (Kowalski et al., 2014). These species differ in size, physiology, habitat preferences, and life history dynamics, contributing to a complex landscape-scale fish assemblage that requires a diversity of habitat types over time (Jude and Pappas, 1992).
In March 2011, a water-control structure with two 1.2 m diameter culverts was opened between a 40 ha diked wetland pool and the drowned mouth of Crane Creek, restoring hydrological connection to Lake Erie for the first time in over 50 years (Figure 1). This structure allows short and long-term water-level changes in Lake Erie (e.g., seiches, annual fluctuations) to propagate into the wetland. It also enables new patterns of fish emigration and immigration between the wetland, creek, and lake, expanding the spatial resources available for foraging, reproduction, predator avoidance, and milling behaviors. While the water-control structure remained open for the duration of the project discussed here, carp grates with a 7 cm horizontal spacing between vertical bars were installed for a variable number of weeks during carp spawning season each spring (Table 1). These grates are designed to limit Common Carp immigration into the wetland pool but may also affect large non-target species unable to pass through the grates.
Table 1.
Date ranges that carp exclusion grates were installed in and removed from a water-control structure located in the U.S. Fish and Wildlife Service Ottawa National Wildlife Refuge, Oak Harbor, Ohio, USA. Ranges of time periods indicate the earliest and latest possible date of installation or removal.Sonar Deployment
Acoustic observations were made following methods detailed in Eggleston et al. (2020). Briefly: a Dual-frequency Identification Sonar unit (DIDSON 300, Sound Metrics: Bellevue, Washington, U.S.A.) was deployed 56 times for approximately 48 hours between March 2011 and November 2014 (Table 2). These observations were made intermittently, approximately every two weeks, depending on factors such as ice cover, inclement weather, equipment readiness, and operational status of the United States government.
Table 2.
Summary of Dual-frequency Identification Sonar (DIDSON) deployment events at U.S. Fish and Wildlife Service Ottawa National Wildlife Refuge, Oak Harbor, Ohio, USA between March 24, 2011 and November 6, 2014.At each deployment, the DIDSON unit was mounted to a permanent metal truss and submerged approximately 60 cm below the surface of the wetland pool. It was positioned approximately 2 m southeast of the water-control structure and oriented so that its beams intersected water flow between the creek and wetland in a perpendicular manner (see Figure 1 and in-text description in Eggleston et al., 2020). From this position, the full width of the channel leading from the wetland into the control structure could be ensonified, so that objects present in the eastern portion of the channel appeared in the foreground of echograms while those in the western portion appeared in the background. This arrangement allowed us to capture nearly all submerged objects moving in or out of the wetland pool. Precision adjustments were made using mounting hardware at each deployment to minimize variability in the field of view between observations. Digital images were collected at a rate of 10 frames s-1 and cached to an external hard drive at one-hour intervals in “*.ddf” format. All observations were made in high-frequency identification mode (1.8 MHz) to optimize image clarity. A typical echogram is presented in Figure 2.
Digital Image Processing
Sonar data were processed according to methods previously described in Eggleston et al. (2020). To ensure comparability between observational units, sonar echogram files shorter than one hour (resulting from equipment malfunction or early deployment termination) were excluded from subsequent analyses. Additionally, digital echogram files were manually reviewed at 10X speed, and any files containing a continuous blackout of more than six minutes, a shift in the field of view (resulting from unusual water flow or wildlife interference), human activity, or reduced image clarity were eliminated from the analytical set.
A combination of two software applications, a commercial program for processing hydroacoustic data (Echoview v6.0, Echoview Software Pty Ltd: Hobart, Tasmania, Australia) and a purpose-built application from Milne Technologies (Keene, Ontario, Canada), was utilized to derive estimated fish counts from each echogram file. The Milne Technologies application automated sequential processing of multiple echogram files, significantly reducing the operator time required to process thousands of hours of echogram data. Prior to use, Echoview was calibrated with our dataset by comparing computerized fish counts with those obtained manually from echograms of a similar origin. Specifically, adjustments were made to default parameters for major and minor axes, exclusion distance, missed ping expansion, and track acceptance to optimize agreement between Echoview and manual counts. Echoview was used to identify, count, and characterize the direction of movement (towards or away from the connecting structure) for all fish greater than 8 cm in length in each hour-long echogram. While the listed adjustments minimize error and generated values are generally regarded as useful, these values are imperfect and can vary with respect to target density, species, and path geometry (Hightower et al., 2013; Hughes and Hightower, 2015). Moreover, the figures presented here reflect detections made within the ensonified area and may not be representative of the wetland pool overall. As a result, the abundance values presented herein can be regarded as estimates that are proxies for fish populations and movement but not precise counts of individual fish.
Statistical Analysis
All statistical analyses were performed in the R statistical environment (v4.4.0; R Core Team, 2024). Daily mean flood stage values and hourly means for all water quality parameters (pH, conductivity, water temperature, dissolved oxygen, and turbidity) were obtained through ServCat, the USFWS’s online data repository. These data were calculated from measurements from a gage located near the wetland pool within Crane Creek (41°37'21.347" N, 83°12'40.758" W). All environmental data were rated at least “fair” by the USFWS, except for water quality information from 2013 that was rated as “poor.” Despite this, the 2013 data constituted the best available and most comparable information.
We transformed flood stage values by centering around the global mean and scaling by the observations’ standard deviation. We described hourly temporal variation using astronomical time since it has been repeatedly shown to play a major role in shaping fish behavior in the Great Lakes and other temperate North American freshwater systems (Helfman, 1981; Forsythe et al., 2012; Gorman et al., 2012; Kough et al., 2018). All figures depict fish activity using the local time at observation. However, to describe diel variability in model analysis, we also calculated the number of hours since an observation’s preceding sunrise as an integer between 0 and 23 using the R package suncalc (Thieurmel and Elmarhraoui, 2022). For instance, when considering the 24 observational periods that follow a 07:15 sunrise, the hour-long observation beginning at 10:00 was assigned a value of 3 (hours following sunrise) and an observation beginning at 03:00 assigned a value of 20. To describe seasonal variation, we used a similar approach to calculate the number of weeks that had passed since an observation’s preceding vernal equinox.
We calculated means and 95% confidence intervals describing fish detections per hour of acoustic surveillance within each hour since the preceding sunrise, week since the spring equinox, deployment event, year, and heading direction. As fish use of this wetland pool is likely the result of multiple, interactive ecological and environmental factors, we implemented generalized linear mixed model (GLMM) analysis using the R package glmmTMB v1.1.9 (Brooks et al., 2017). Specifically, we implemented a type II negative binomial mixed model (V = µ + µ2/ϕ) to assess the influence of temporal and environmental variables on the likelihood of fish detection. We selected this model type because the fish count data were not normally distributed (Shapiro-Wilks, W= 0.837, P < 0.001) and exhibited high dispersion (x̄ = 1 700, s2 = 2 790 706). To account for the serial correlation inherent in the data structure, we included a lag 1 autoregressive covariance structure, grouped by deployment event, in all constructed models.
We first tested for differences among years and between rates of immigration and emigration using all available data (N= 2 022) and single fixed effects. Additionally, detection frequency data could be matched with environmental data for 1 119 hours of observation. Since temporal influences on fish activity at diel and seasonal scales are well documented in similar systems (e.g., Emery, 1973; Helfman, 1981) and visually apparent upon inspection of our data, our simplest model described fish detection frequencies using fixed effects for weeks since the vernal equinox, hours since the last sunset, and the interaction of these terms. We constructed additional models using single term additions for each environmental variable to the temporal-effect-only model (Model 1) and used Akaike Information Criteria (ΔAIC, Akaike, 1974) to identify those terms that improved model fit. We then created additional models parameterized with all combinations of these fit-improving environmental variables as main effects in addition to temporal terms. Accordingly, we occasionally included both water temperature and dissolved oxygen in same model despite their physical relationship, as each parameter can affect fish behavior independently (Zhang et al., 2024). We disregarded models that failed to converge. For subsequent analyses, we considered our best temporal model and any more parsimonious models that included environmental variables. We calculated Nakagawa’s marginal R2GLMM (Nakagawa and Schielzeth, 2012) as a partial description of model fit using the R package MuMIn (Bartoń, 2024), and we considered parameters whose coefficient estimates did not overlap zero in at least one of these best-fit models to be potential determinants of fish activity.
Results
Sonar deployment and fish detections
We successfully characterized fish use of the wetland for 2 022 hours of sonar data spanning 56 individual deployments (Table 2). Daytime hours were slightly overrepresented (N = 1 002) compared to night (N = 529) and crepuscular periods (N = 491). Between 2 and 68 hours of echograms were successfully processed per deployment (mean = 37 ± 14). From these observations, we obtained occurrence and heading information for 3 436 118 total fish (Table 3). In each hour-long echogram, we detected between 3 and 9 353 fish.
Direction of movement
We consistently detected more fish entering the wetland pool (moving from right to left across the echograms) than exiting it towards Crane Creek and the broader Lake Erie basin, However, these differences were modest, comprising only 1% - 5% of total detections (Tables 3 and 4). When tested using a GLMM, differences in mean detection by direction of travel were found to be small but statistically significant (Table 5). Nonetheless, model marginal pseudo-R2 was extremely low (Table 5), indicating that patterns of variation in fish activity directed towards the wetland pool were closely linked to those of fish moving towards open water (Figures 3 and 4).
Table 4.
Mean (± SD) fish detected h-1 DIDSON footage in total, counting only those moving from the wetland pool towards Crane Creek, and those only moving from Crane Creek to the wetland pool. Observations are summarized by year. Note very high dispersion.Table 5.
Outcome summary for GLMM describing fish detections as function of movement direction. Conditional model included covariance structure as described in text. Direction constructed as movement towards Crane Creek compared to movement towards wetland pool. Marginal pseudo-R2 provided according to Nakagawa and Schielzeth (2012). Bold text indicates probabilities below 0.05.Temporal Variables
Inter-annual variation:
Although the absolute number of fish detected varied by up to a factor of 3 in year-to-year comparisons, this change is largely accounted for by variation in sampling effort (Tables 2 and 3). We detected the most fish per hour in 2011 and the fewest in 2012 (Table 4). Hourly detection rates in 2012 and 2014 were similar, while observations from 2013 exhibited an intermediate detection rate. Small, but visually apparent, changes in diel and seasonal rhythms were observed between years (Figures 5 and 6). However, the GLMM analysis indicated that the effect of year was not significantly different from zero (Table 6).
Intra-annual variation:
Variation in fish detections over the course of the year was visually apparent in our data, and each of our GLMMs identified an interaction term including the length of time since the spring equinox as significant (Table 7). Fish detection in the wetland pool was typically highest in early spring and summer months. Generally, these elevated detection rates declined steeply beginning in June or July and remained low until late fall, which marked the end of our observational period (Figure 4). However, minor departures from this pattern were also noted. For instance, during our May 2011 deployment, very few fish were observed relative to April and June, a pattern not reflected in subsequent years.
Table 7.
Terms summary for GLMM constructed describing fish detections as function of environmental and temporal variation. Conditional model included covariance structure as described in text. Probability values < 0.05 are bolded, 0.05 – 0.10 indicated with "*".Daily variation:
Each of our GLMMs identified time of day or its interaction with time of year as significant predictor of fish detections (Table 7). Detections during daylight hours (between sunrise and sunset) were typically higher than those recorded at night (x̄day = 1 952, SDday = 1 720, x̄night= 1 302 SDnight = 1 506, Figure 3). Generally, detections were lowest overnight, with a slight uptick observed during the hours surrounding or immediately preceding sunrise. Detections typically continued to rise from this point, reaching their peak early in the morning (approximately 7:00 - 9:00 AM). Following this peak, frequencies declined but stabilized until the hours surrounding sunset, at which point they decreased further (Figure 3). This general pattern persisted throughout the observational period, though minor fluctuations were observed on both an annual and seasonal basis (Figures 5 and 6). Notably, the differences between night and daytime detection rates were greater during deployments occurring between the vernal equinox and summer solstice (Figure 6). Very low fish counts during daylight hours on the 17th and 18th of May 2011, along with widespread depressions in daytime detections throughout 2012, are notable exceptions to this trend (Figure 4).
Environmental variables
Three models including environmental variables were identified as more parsimonious than the temporal-effects-only model (Table 8). These models incorporated flood stage, water temperature, and/or dissolved oxygen as fixed effects alongside the temporal terms. Both water temperature and dissolved oxygen yielded non-zero coefficient estimates at a standard significance level (P < 0.05), while flood stage produced a non-zero coefficient at a less conservative significance level (P < 0.10). Both water temperature and flood stage had positive relationships with fish detections, whereas dissolved oxygen was associated with a reduction (Table 7). Other environmental variables tested (pH, conductivity, and turbidity) were not identified as meaningful sources of variation by this analysis.
Table 8.
Outcome summary for GLMMs describing fish detections as function of environmental variation in addition to short and longer-term temporal variation. Conditional model included covariance structure as described in text. Water stage was scaled and centered. Marginal R2 provided according to Nakagawa and Schielzeth (2012).Discussion
Daily temporal variation
Changes over time in the compositions of Great Lake wetland fish communities are well documented (Kowalski et al., 2014; Langer et al., 2016; Reisinger et al., 2019; Diller et al., 2022). These changes arise from temporal differences in species-specific life histories governing use of wetlands. As new individuals or populations enter or exit the wetland, we expect to observe corresponding increases or declines in fish detections, enabling us to infer changes in wetland use over time. The resulting description of temporal fluctuations in fish activity within coastal wetlands of the Great Lakes has potential value in the monitoring and management of these resources.
Overall, this area of the reconnected wetland was used continuously by fish while the fish-passage structure was open. Although fish use of restored Lake Erie coastal sites has been previously documented (Steinhart et al., 2017; Stott and Miner, 2022), this project provides evidence of rapid pool use beginning immediately after initial reconnection (Figure 4). Moreover, use of this area exhibits pronounced diel rhythms, with greatest activity observed during the early morning hours and lowest activity overnight (Table 7, Figures 3 and 5). While comparisons of night and daytime freshwater fish communities in temperate regions of eastern North America and the Great Lakes suggest that some form of diel variability is the norm, exact patterns of high and low usage appear to be system specific. For instance, previous studies of vegetated coastal zones show that measures of community diversity often fluctuate throughout the day, but the direction of these shifts is variable. Some studies, using seine nets or electrofishing, report greatest richness or diversity at night (Pierce et al., 2001; McKenna, Jr., 2008; Midwood et al., 2016; Ross et al., 2016), while others, using manual surveys or trap nets, document the opposite trend (Keast et al., 1978; Shoup et al., 2004). Nighttime communities are also often more abundant (Pierce et al., 2001; Midwood et al., 2016; Ross et al., 2016), but these relationships can be mixed—even when evaluated with similar gear types (McKenna Jr., 2008). In addition, variation in these trends within study systems has been linked to factors such as community composition, habitat type, or time of year (Keast et al., 1978; Larocque et al., 2020).
In contrast to most of these findings, we typically detected the lowest fish activity and inferred lowest abundances during nighttime hours (Figure 3 and Table 7). Notably, elevated numbers were usually observed only for a few hours surrounding and following sunrise, with detection rates considerably reduced from late morning through the evening. This short-term variation could obscure some diel patterns in fish use, particularly if the entire diurnal period is characterized by a sample taken later in the day. Such a method could overlook an earlier period of high use, contributing to some of the inconsistencies between our finding and previous studies. This possibility reinforces the need for high temporal coverage when studying diel variation in fish activity.
Although the full complexity and breadth of ecosystem dynamics producing these diel rhythms are best explored using other means (e.g., Gorman et al., 2012; Marcy-Quay and Kraft, 2021), we found modest evidence that diel changes in water oxygenation could contribute to these patterns. Our analysis suggested a negative relationship between dissolved oxygen concentration and the rate of fish detections (Table 7). Although complicated by intermittent seiche-driven water exchange, this relationship could arise from diel oxygenation cycles typical of highly vegetated, warm bodies of shallow water common in coastal wetland systems. These cycles are characterized by sizable increases in dissolved oxygen accumulating as a byproduct of photosynthesis between sunrise and sunset. In contrast, many of the fish species likely to inhabit this wetland are either moderately tolerant of or specialized for low-oxygen environments and tend to be less common in well-oxygenated areas (Ludsin et al., 2001; Arend et al., 2010; Kowalski et al., 2014). Consequently, these fish may respond to afternoon and early evening increases in photosynthetically-derived oxygen by retreating towards deeper, unvegetated areas beyond the ensonified zone or exiting this heavily-vegetated pool altogether, leading to fewer fish detected later in the day. A few highly abundant taxa of this type could drive the observed pattern, as is the case in other systems where just a few abundant taxa play a major role in driving diel trends (Keast et al., 1978, Pierce et al., 2001). Such a coordinated entry by species that are absent or less common in other, previously-studied systems could also explain inconsistencies between those studies and the diel patterns we document here. However, more taxonomically-sensitive methods would be necessary to confirm this hypothesis or identify the taxa involved. Moreover, given this limitation concerning species identity, we cannot know whether these detections and related trends represent diverse or homogenous communities in terms of species, functional groups, or invasive status, nor how these patterns might change over time.
Despite this, the information presented here could be valuable in designing and planning management or monitoring programs in order to minimize off-target impacts and maximize coverage of species of interest. Our data suggest that short-term management actions occurring over minutes or hours could be optimized through the understanding of diel cycles in fish activity. Incorporating this information could help mitigate the negative impacts of disruptive management actions, like chemical applications or operation of the water-control structure, by scheduling these activities during late afternoon or early evening when fish activity is lower. Alternatively, management activities that benefit from greater representation of the fish community, such as monitoring or stock assessments, could be strategically targeted for early morning hours when fish are more active. Similarly, the timing of data collection events should also consider these diel patterns to maximize comparability among observations and most effectively address project goals. Although annual variability in these diel patterns is an apparent feature of this dataset, certain trends (e.g., high early-morning activity) are repeated and represent a useful starting point for planning purposes, which could be paired with more site-specific knowledge or observations, as appropriate. Additionally, this information could be combined with taxonomic data to target management operations further. However, it is important to note that there were no significant time periods when the fish-passage structure was entirely devoid of fish, and thus a purely temporal mitigation strategy is unlikely to eliminate undesirable impacts completely. Similarly, our analysis of fish movement in the structure does not represent the total number and diversity of fishes in the wetland itself.
Long-term temporal variation
Seasonal changes in the abundance or diversity of fish communities in Great Lakes coastal wetlands are not unusual (Keast et al., 1978; Chubb and Liston, 1986; Bhagat and Ruetz, 2011, Diller et al., 2022). This study provides evidence of pronounced seasonal changes in the estimated abundances of large-bodied fishes utilizing a reconnected wetland pool (Table 7, Figure 4). We measured sizeable and annually recurrent increases in fish detections during late spring. These elevated detection rates usually persisted for 4-6 weeks before returning to early spring levels in midsummer. These patterns may be underlaid by community change driven by changes in biotic and abiotic features of the wetland environment.
High springtime detections, indicating significant immigration, may be partially influenced by changes in abiotic conditions. Substantial seasonal variations in physical and chemical parameters occur in this reconnected wetland, affecting its suitability for specific fish species (Kowalski et al., 2014; Carter et al., 2022). In particular, we found modest evidence connecting rising water level and temperatures to higher rates of fish detection (Tables 7 and 8). Both factors have been found to play a role in structuring use or community composition in other Great Lakes wetlands (Wismer and Christie, 1987; Fracz and Chow-Fraser, 2012; Langer et al., 2018; Stott and Miner, 2022). Water levels are usually highest in spring, coinciding with springtime warming and high rates of fish activity (Figure 4). Increased water levels enhance flow through the connecting structure and warming temperatures facilitate the elimination of ice within the channel connecting wetland and creek. However, although the resulting wetland accessibility usually begins in March, peak fish activity was not observed until late April or May (Figure 4). This suggests springtime influx is not solely a result of habitat availability but may also be a response to other stimuli. Spawning conditions are likely key triggers of immigration, as several large-bodied wetland spawners are present in this system, including Northern Pike, Bowfin, Common Carp, and Brown Bullhead (Ameiurus nebulosus) (Hartley and Herdendorf, 1977). Another possible trigger involves small cyprinids that can be highly abundant in Great Lakes coastal wetlands during the early spring (Diller et al., 2022). Given their size, these forage fish would not be detected individually by our method. However, they could attract large-bodied piscivores as they accumulate in high densities later in the spring. Ultimately, this study design cannot adequately identify these factors, and further research is needed to identify the specific triggers that influence the timing of springtime influx.
Undoubtedly, Common Carp constitute a portion of spring immigration. This abundant, non-native, and frequently nuisance species can create dramatic and undesirable effects in wetlands (Lougheed et al., 1998; Kowal et al. 2022; Moore and Mandrak, 2024). They often make up a major and conspicuous portion of springtime influx into Great Lakes coastal wetlands as they use these areas for spawning (Bajer and Sorensen, 2009; Banet, et al., 2021; Watkinson et al., 2021; Piczak et al., 2023a). However, carp grates, designed to prevent carp of spawning size from accessing the restored wetland without affecting other species, were installed annually across the channel linking the restored wetland habitat and Crane Creek (French et al., 1999). This installation should have considerably reduced the number of large Common Carp able to enter the wetland but may have had small impacts on other species of large fish. As a result, it is possible that similar, ungated coastal wetlands could experience even greater spring influxes of large-bodied fish (including Carp) than are described here.
We detected the greatest number of fish in this wetland during late spring and early summer, however, there are no deployment periods in which large-bodied fish were entirely absent (Figure 4). Deployments from mid-summer through late fall exhibit relatively stable detection rates, indicating reduced change in the population of large-bodied fishes over this period compared to late spring (Figure 4). In general, Great Lakes coastal wetlands with large anthropogenic impacts are inhabited by distinctive fish species, possessing functional traits well-suited for degraded wetland habitats (Trebitz et al., 2009; Johnson et al., 2025). The stable pattern of detections in early spring and from late summer onward may correspond to a year-round assemblage of these resident species. This guild of fish is better able to exploit wetland habitat characterized by large seasonal changes in water quality (Bhagat et al., 2007; Arend et al., 2010; Parker et al., 2012). An assemblage of this type, highly tolerant of low oxygen, would also contribute to the observed negative association between dissolved oxygen concentration and fish activity (Piczak et al., 2023b).
Seasonal variability in the use of this restored wetland has significant implications for management, especially for multi-day or multi-week projects such as hydrological manipulation or the exclusion of undesirable species. These actions could be strategically scheduled outside of the late spring fish influx to minimize impacts on fish populations or maximize exclusion of undesirable species (e.g., Common Carp). Conversely, if the goal is to manage or monitor all fish utilizing the wetland, executing these management actions during late spring could capitalize on the concentrated presence of fish in this area even though it is not clear how the management activities themselves may influence activity patterns. Monitoring activities could also target or avoid these seasonal cycles to ensure comparability between observations and comprehensive coverage of the wetland’s fish community. Additionally, if hypothesized species turnover is indeed occurring, this temporal information could be combined with additional data to target specific fish species or functional groups (e.g., Stott and Miner, 2022; Piczak et al., 2023b).
Finally, we found no evidence of sustained directional trends in annual fish activity during this period. The above seasonal and diel patterns structuring fish remained largely stable over these four years (Table 6 and Figure 4). This stability is consistent with findings from coastal wetlands along Lake Michigan’s eastern shoreline where no major year-to-year variation was observed (Bhagat and Ruetz III, 2011). However, we do observe specific instances of unique fish use dynamics. For example, we documented a sudden, large, and protracted reduction in fish activity that lasted throughout the entire deployment event between May 17-18, 2011. This decline was not observed in subsequent years and may have been linked to remarkably rough weather, strong currents, high water, and elevated turbidity levels during that time. While these conditions did influence fish activity, they do not appear to be recurrent in nature. Although not a major feature of these findings, the importance of weather-related perturbations in structuring chemical and biological dynamics of this system has been previously noted (Baustian et al., 2018), and significant weather events are likely to become more frequent in the context of a changing climate (Zhang et al., 2020; Hicke et al., 2022). Moreover, while we did not find evidence of multi-year directional trends during the four-year interval presented here, this does not preclude the possibility of decadal or century-scale trends in fish activity (e.g., Ludsin et al., 2001).
Limitations
While this project does characterize some general patterns of wetland pool use, several fish behaviors or methodological considerations make it likely that we overestimate fish abundances through repeated detections or misattribution (Holmes et al., 2006). Repeated counts of individual fish, generated by milling behavior, returns to the ensonified area, or broken fish tracks generated by the analysis software likely contribute to this pattern. In addition, improper detections, generated by acoustic noise, waterborne debris, or high turbidity also reduce count accuracy. While both these factors would tend to affect immigrating and emigrating counts equally, we also regularly detected slightly more fish entering the wetland than exiting it (Tables 3 and 4). Such a pattern could arise from subtle, but pervasive, biases arising from flow regimes. For instance, immigration numbers may be slightly inflated if incoming water velocity is high and consistently pushes debris into the wetland that is misclassified as fish detections. Less debris in the water column as the wetland pool drains to Crane Creek could be generating fewer sonar detections. Regardless, manual counts of DIDSON imagery have been shown to produce comparable counts to the method implemented here (Eggleston et al., 2020). Ultimately, while our data are most likely imperfect estimates of actual fish use, the repeated nature of these fluctuations suggest that they represent real biological phenomena.
We assigned each fish a direction of movement, either towards the wetland pool or into Crane Creek, while analyzing the sonar data. We anticipated that this would allow us to describe temporal trends in immigration and emigration separately, as performed in previous work (Stott and Miner, 2022). However, the performance of acoustic monitoring varies based on analytical method and deployment location or configuration (Boswell et al., 2008). In this case, we did not find strong evidence attesting that our differentiation was successful. Most tellingly, mean fish movement towards and away from the connective structure were very highly aligned at multiple timescales (Figures 3 and 4). If this method had successfully distinguished between emigrating and immigrating fish, we would expect to observe distinct abundance patterns between immigrants and emigrants corresponding to coordinated, but temporally segregated, movement in and out of the wetland. While it is possible that any effect of temporal specialization was masked by considering the community in aggregate or at this temporal resolution, other studies have documented variations in habitat use on similar timescales (Funnell et al., 2023; Peterson and Grubbs, 2023). In the future, a slightly different computational approach (e.g., only assigning directional movement to fish that travel a minimum distance in a single direction) may be more successful in describing directional movement.
Conclusions
Monitoring long-term fish use of reconnected coastal wetlands can be logistically difficult for many reasons, including economic constraints, highly turbid water, and the difficulty of performing work in remote areas. Here, we used DIDSON technology to characterize fish use of a reconnected wetland habitat over time. To our knowledge, the four years of data presented here constitute the most prolonged high-resolution sonar survey of fish use in a Great Lakes coastal wetland to date. Ultimately, these observations suggest that this wetland pool is continuously used by fish, and that this use fluctuates in repeated and relatively predictable patterns. We document diel and seasonal variation in wetland use. This variation is evident over multiple temporal scales and likely reflects changes in both the abundances and species of fishes utilizing the restored wetland. While daily variation is not well studied in Great Lakes coastal wetlands, the seasonal variation documented here is consistent with research in other coastal zones (e.g., Brown et al., 2001, Diller et al., 2022; Stott and Miner, 2022). These descriptions of temporal structure in fish movements could help resource managers make decisions about when to implement management actions if they are seeking to maximize fish engagement (e.g., surveying fish assemblages) or minimize fish engagement (e.g., closing access to wetland pool for invasive species management).
Figures
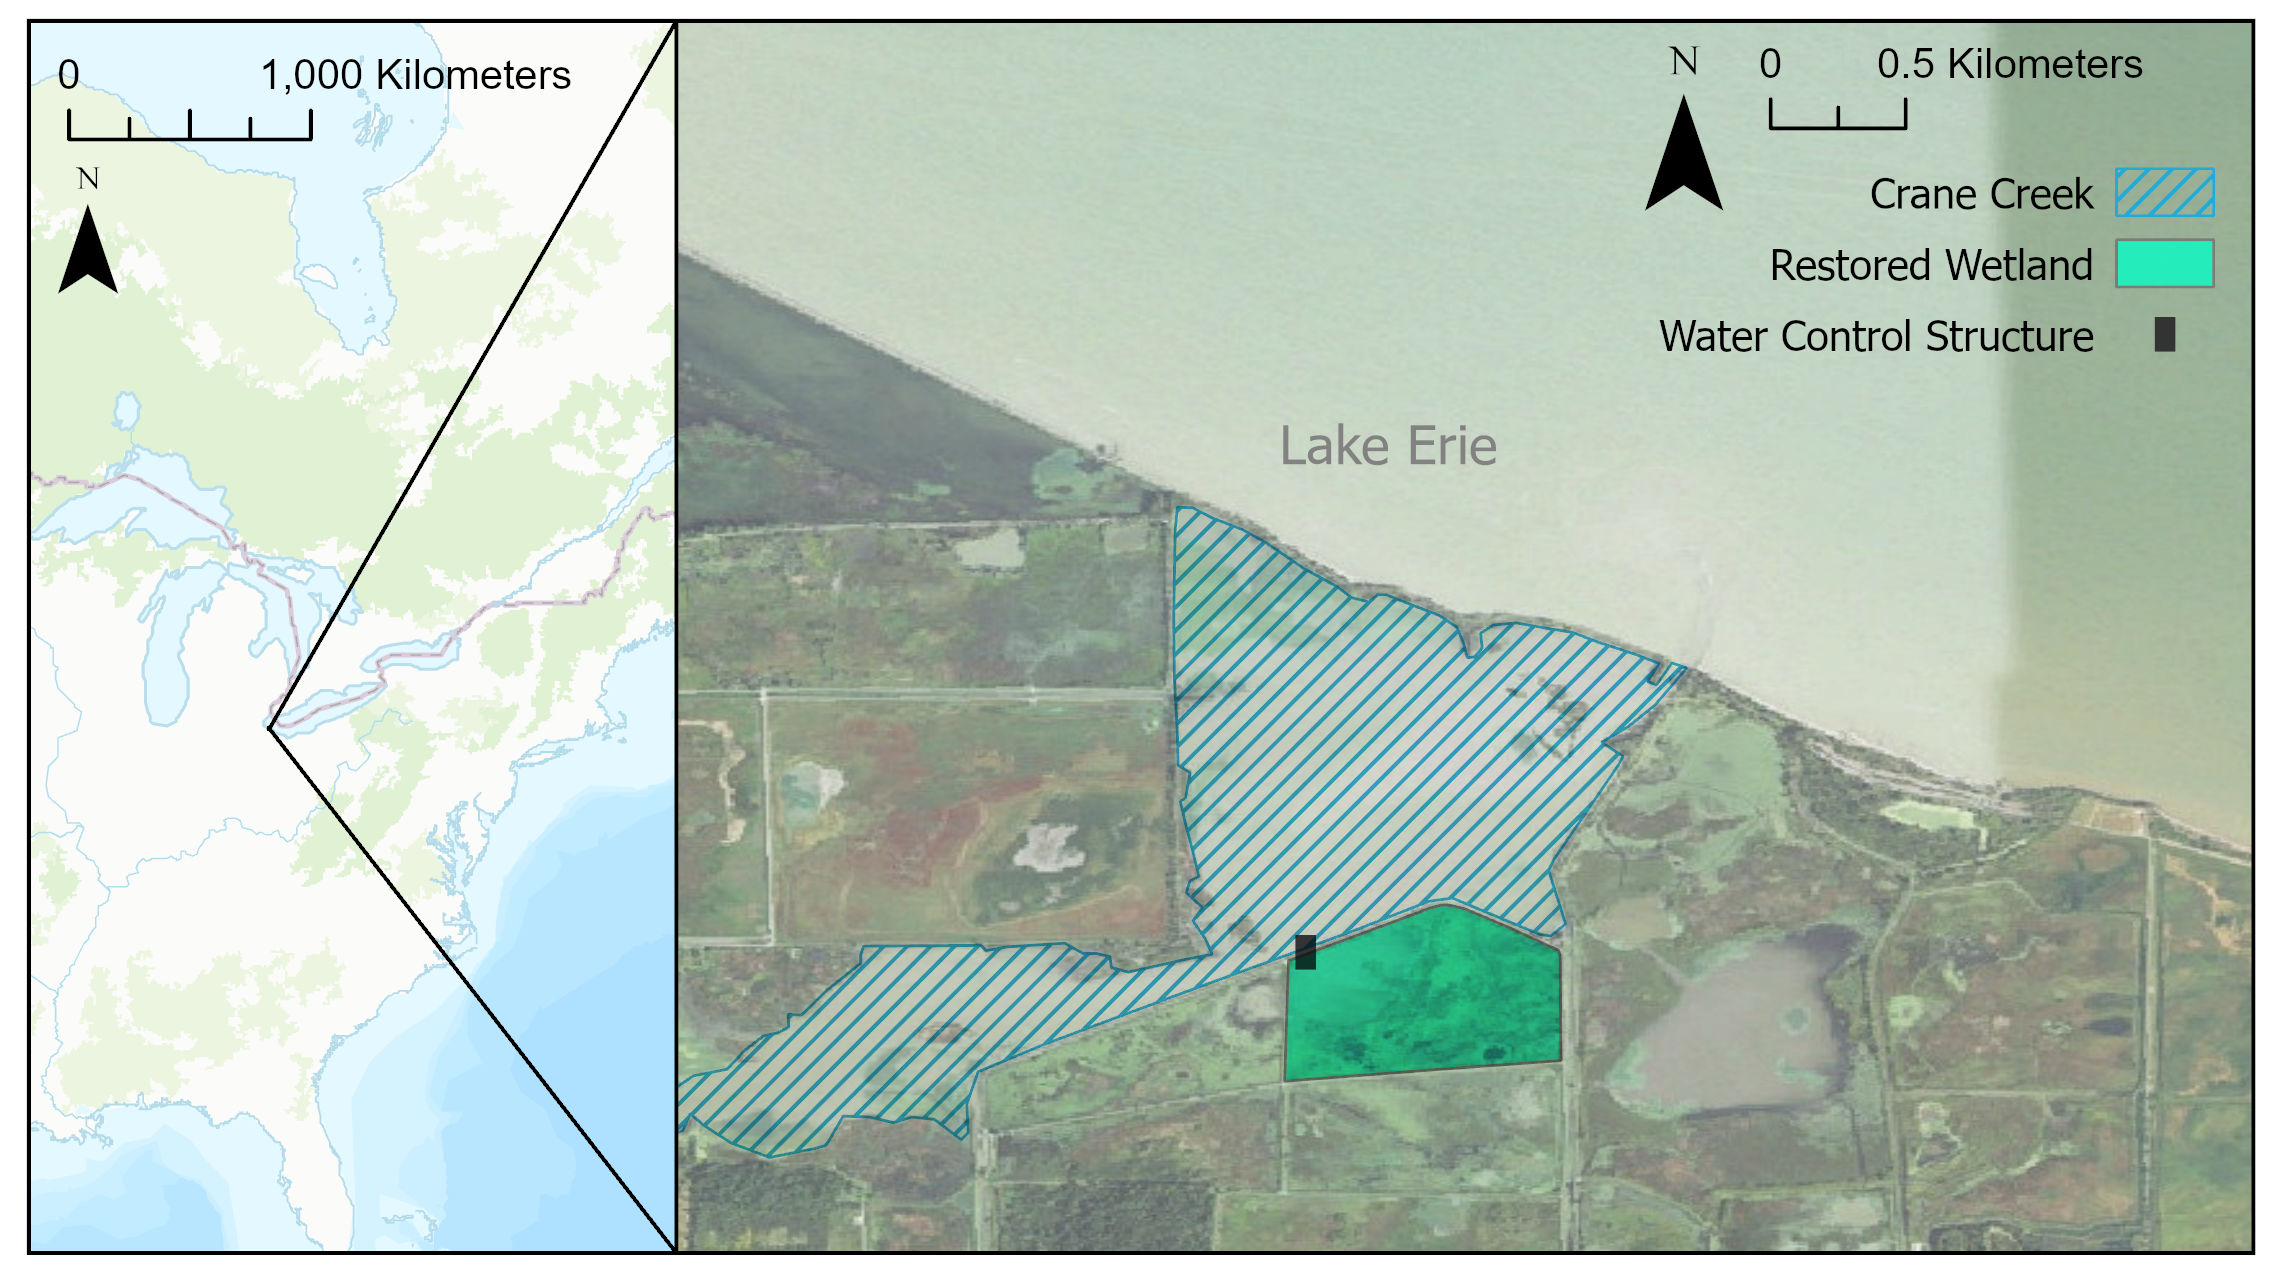
Map of study area showing Lake Erie, Crane Creek, restored wetland, and water-control structure at the U.S. Fish and Wildlife Service Ottawa National Wildlife Refuge. Aerial imagery from the U.S. Geological Survey’s National Map. North American map is ESRI’s World Topographic Basemap.
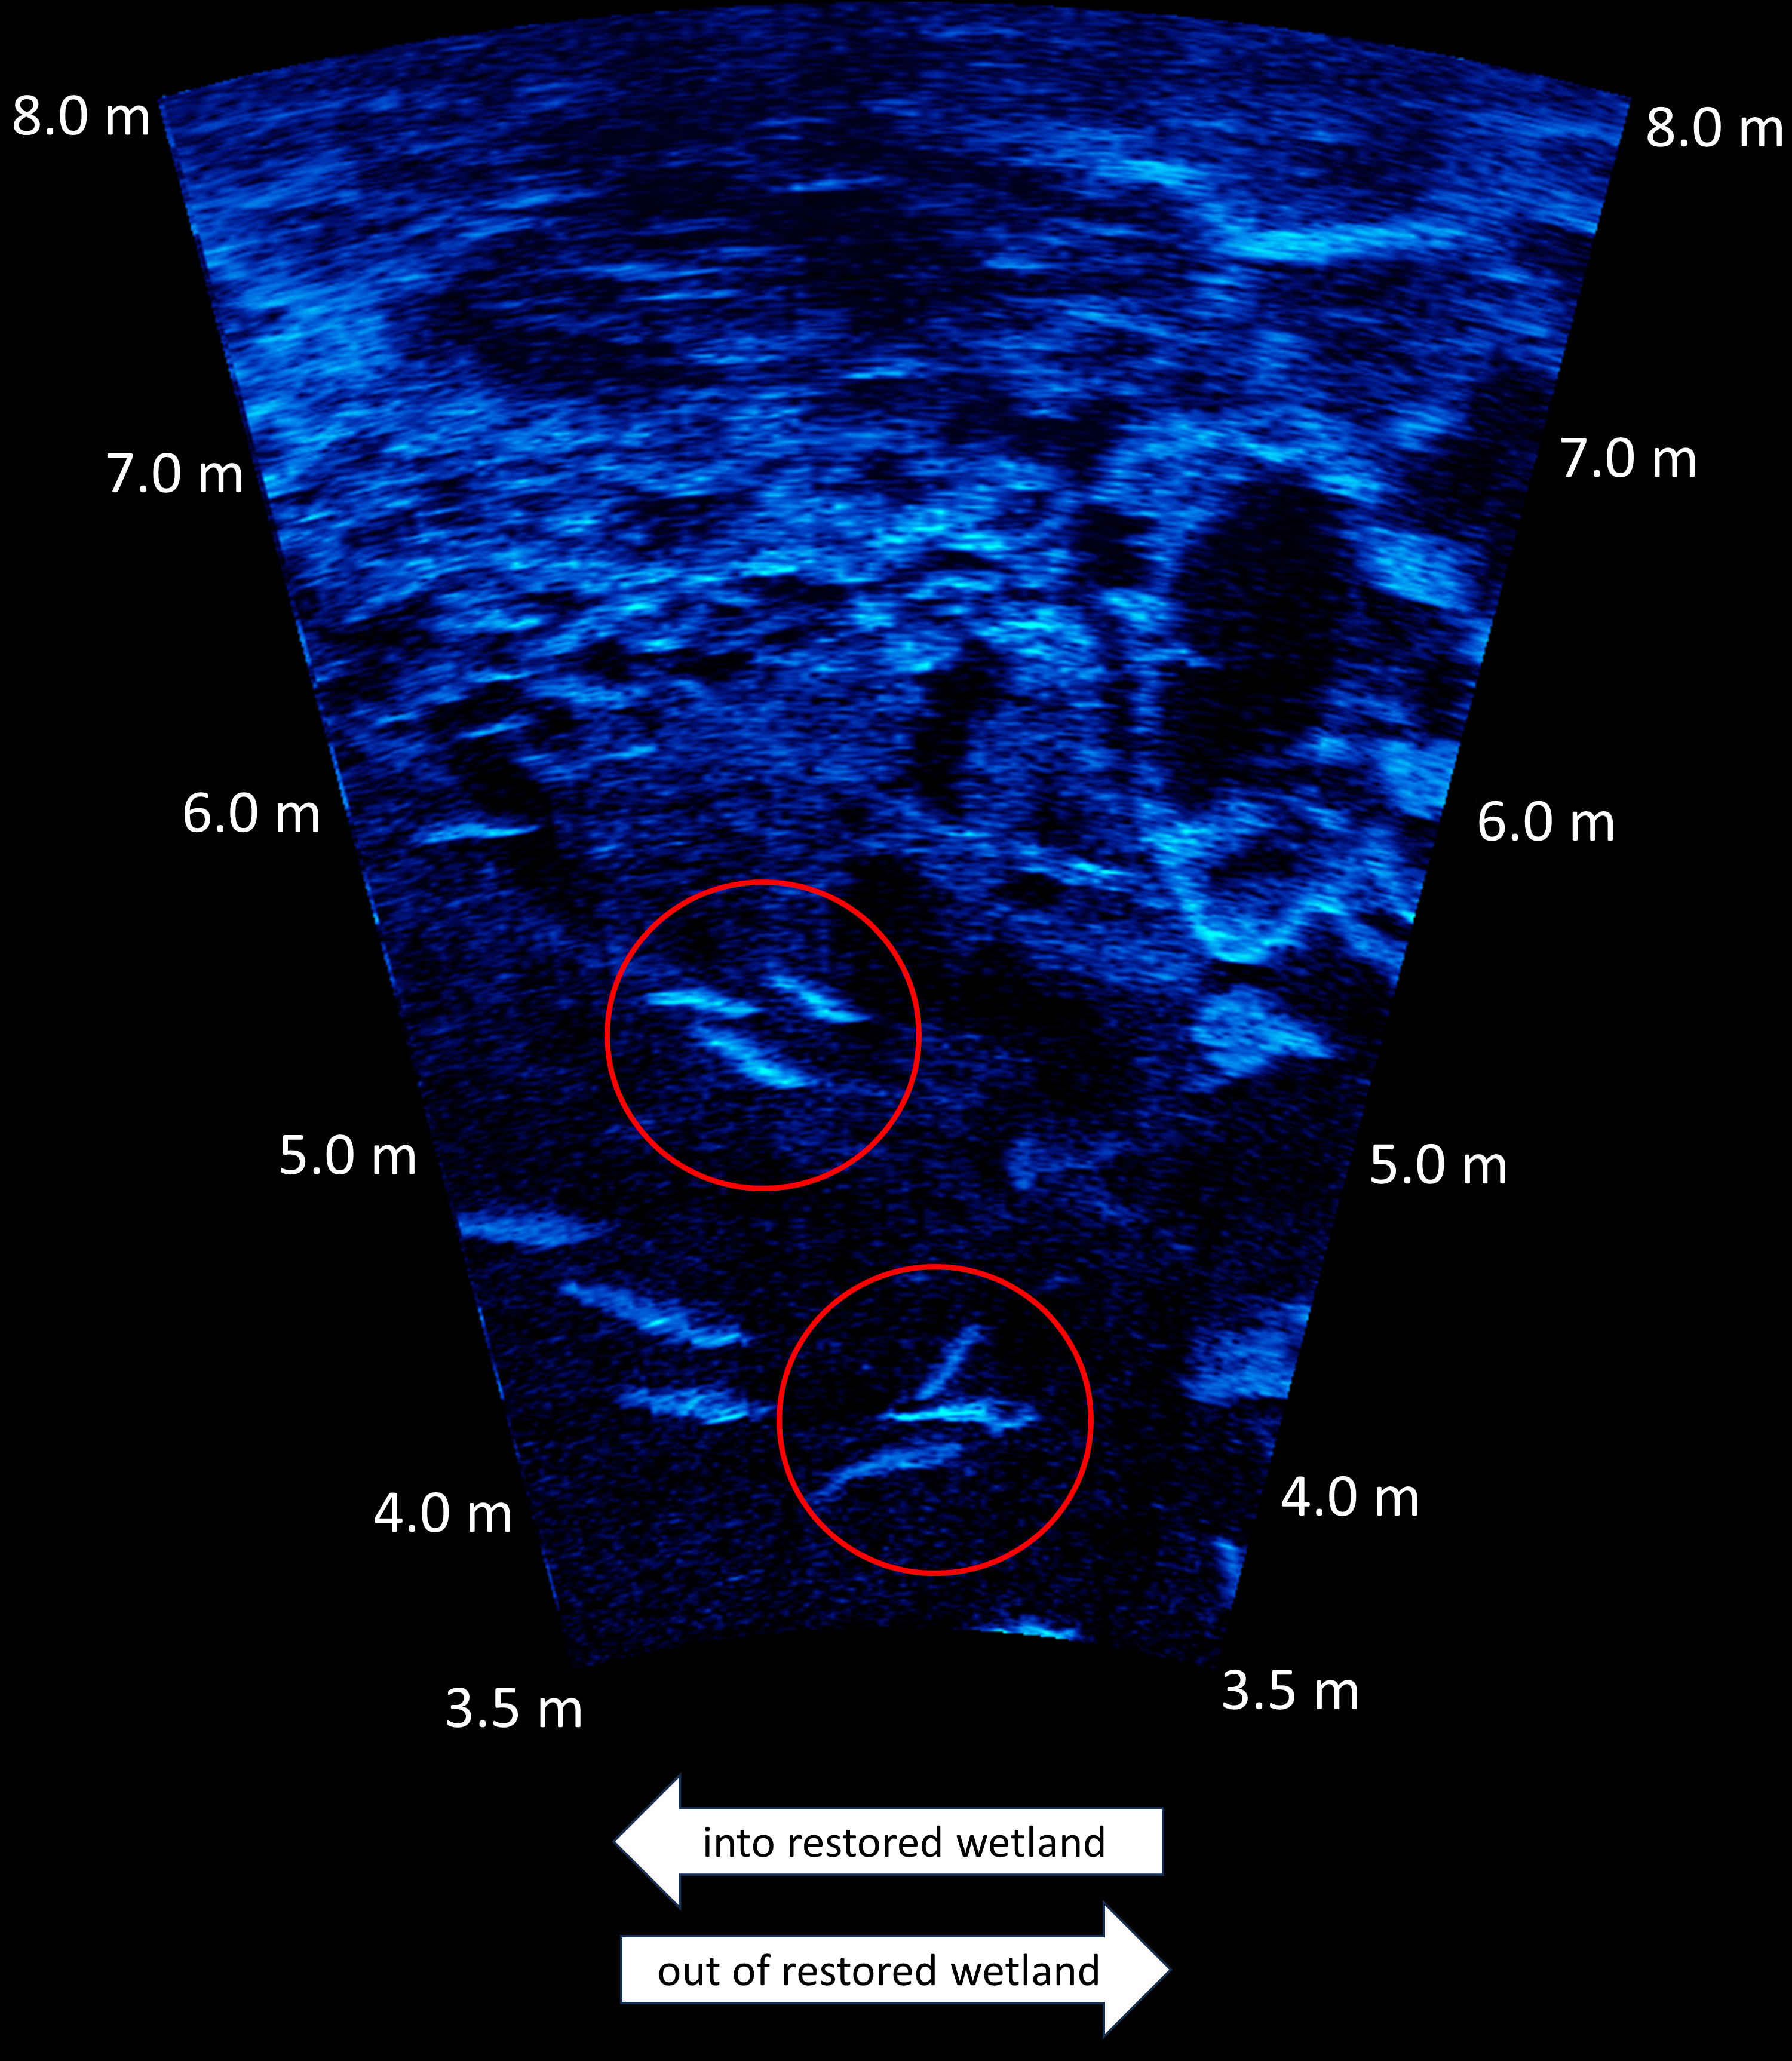
Example DIDSON echogram with red circles highlighting groups of fish. Light colors represent higher intensity sound waves reflecting off of fish, bottom features, and other objects.
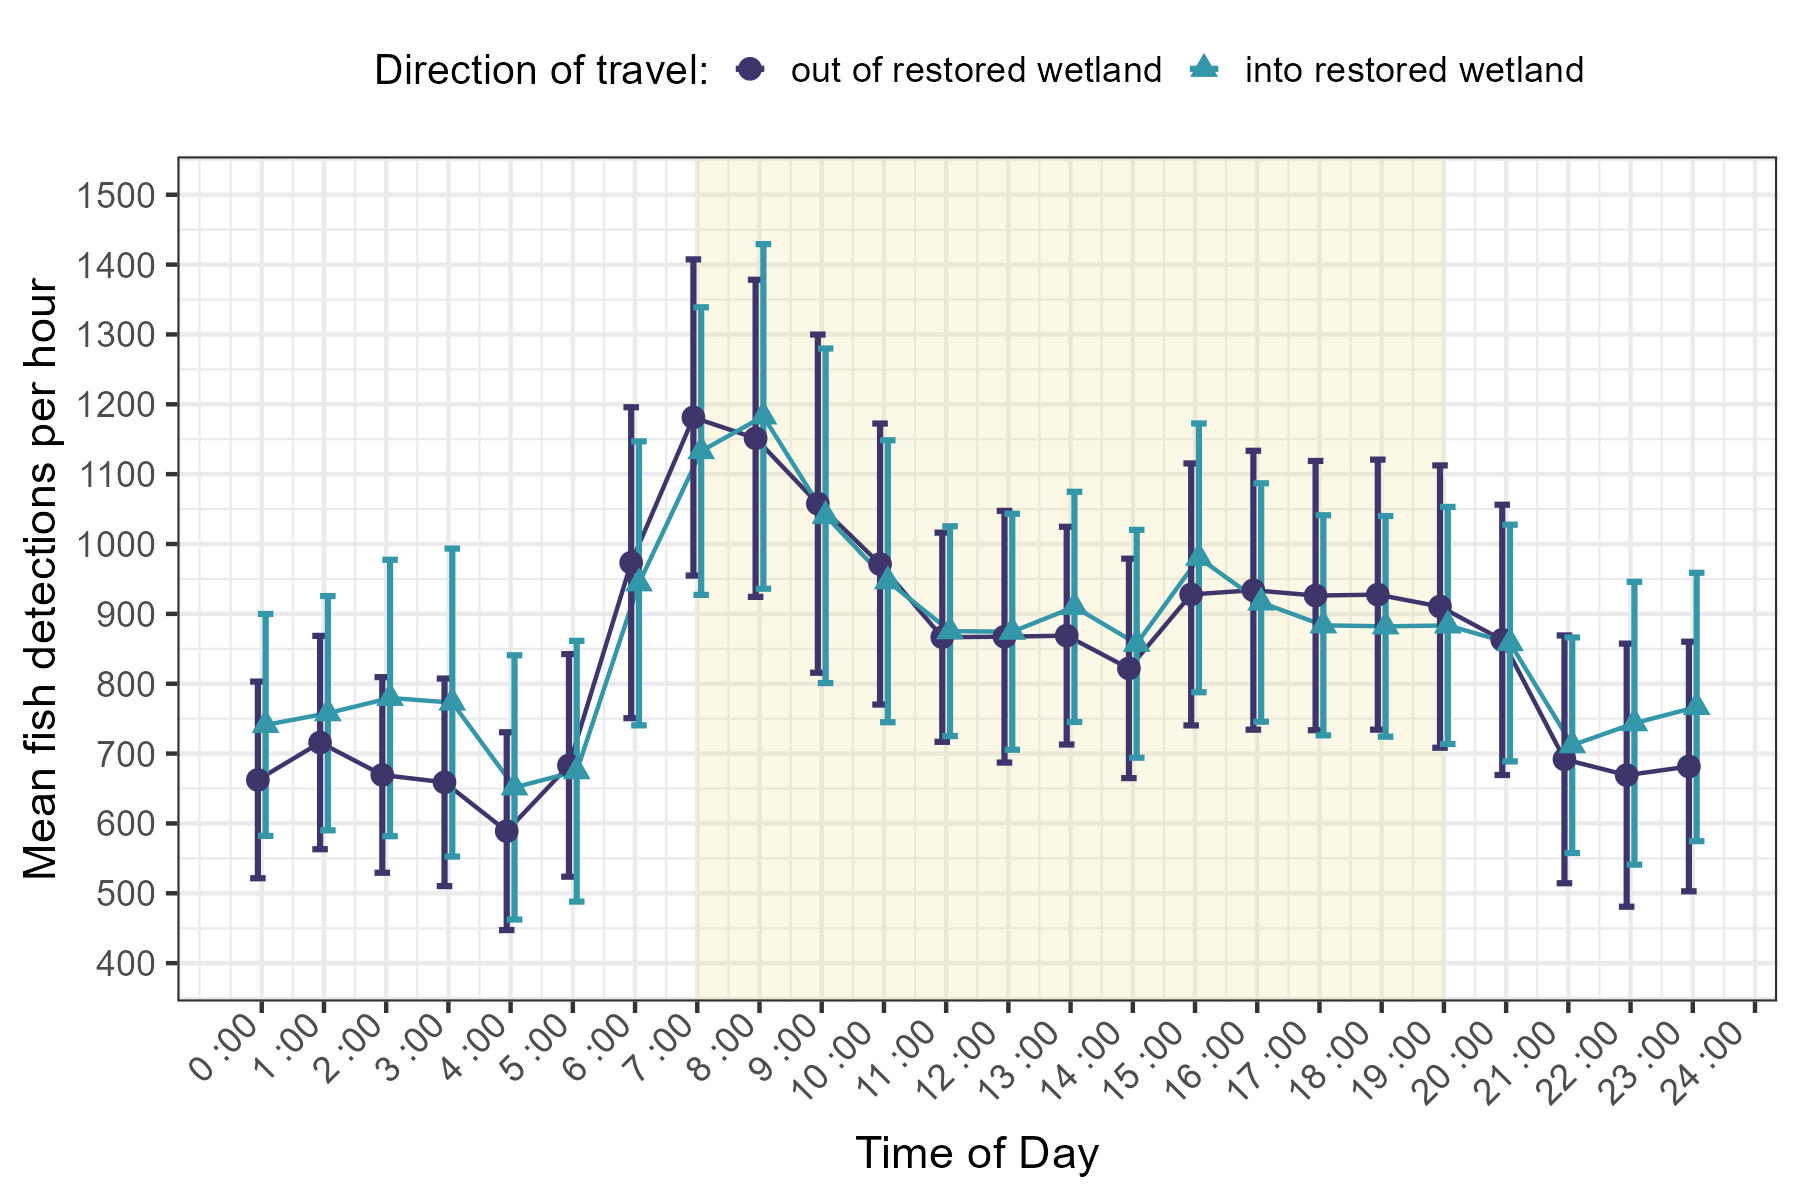
Mean number of fish detections based on time of day. Points represent summarized data for the hour interval commencing at indicated time over the entire study period (2011-2014). Dark colored/purple circles correspond to fish headed away from restored wetland while those headed into the wetland are depicted by light colored/blue triangles. Error bars indicate 95% CIs. Yellow shading indicates “typical” daylight hours as a visual guide, but the precise time of sunrise and sunset varies seasonally (i.e., earlier or later surrounding the summer and winter solstices, respectively).
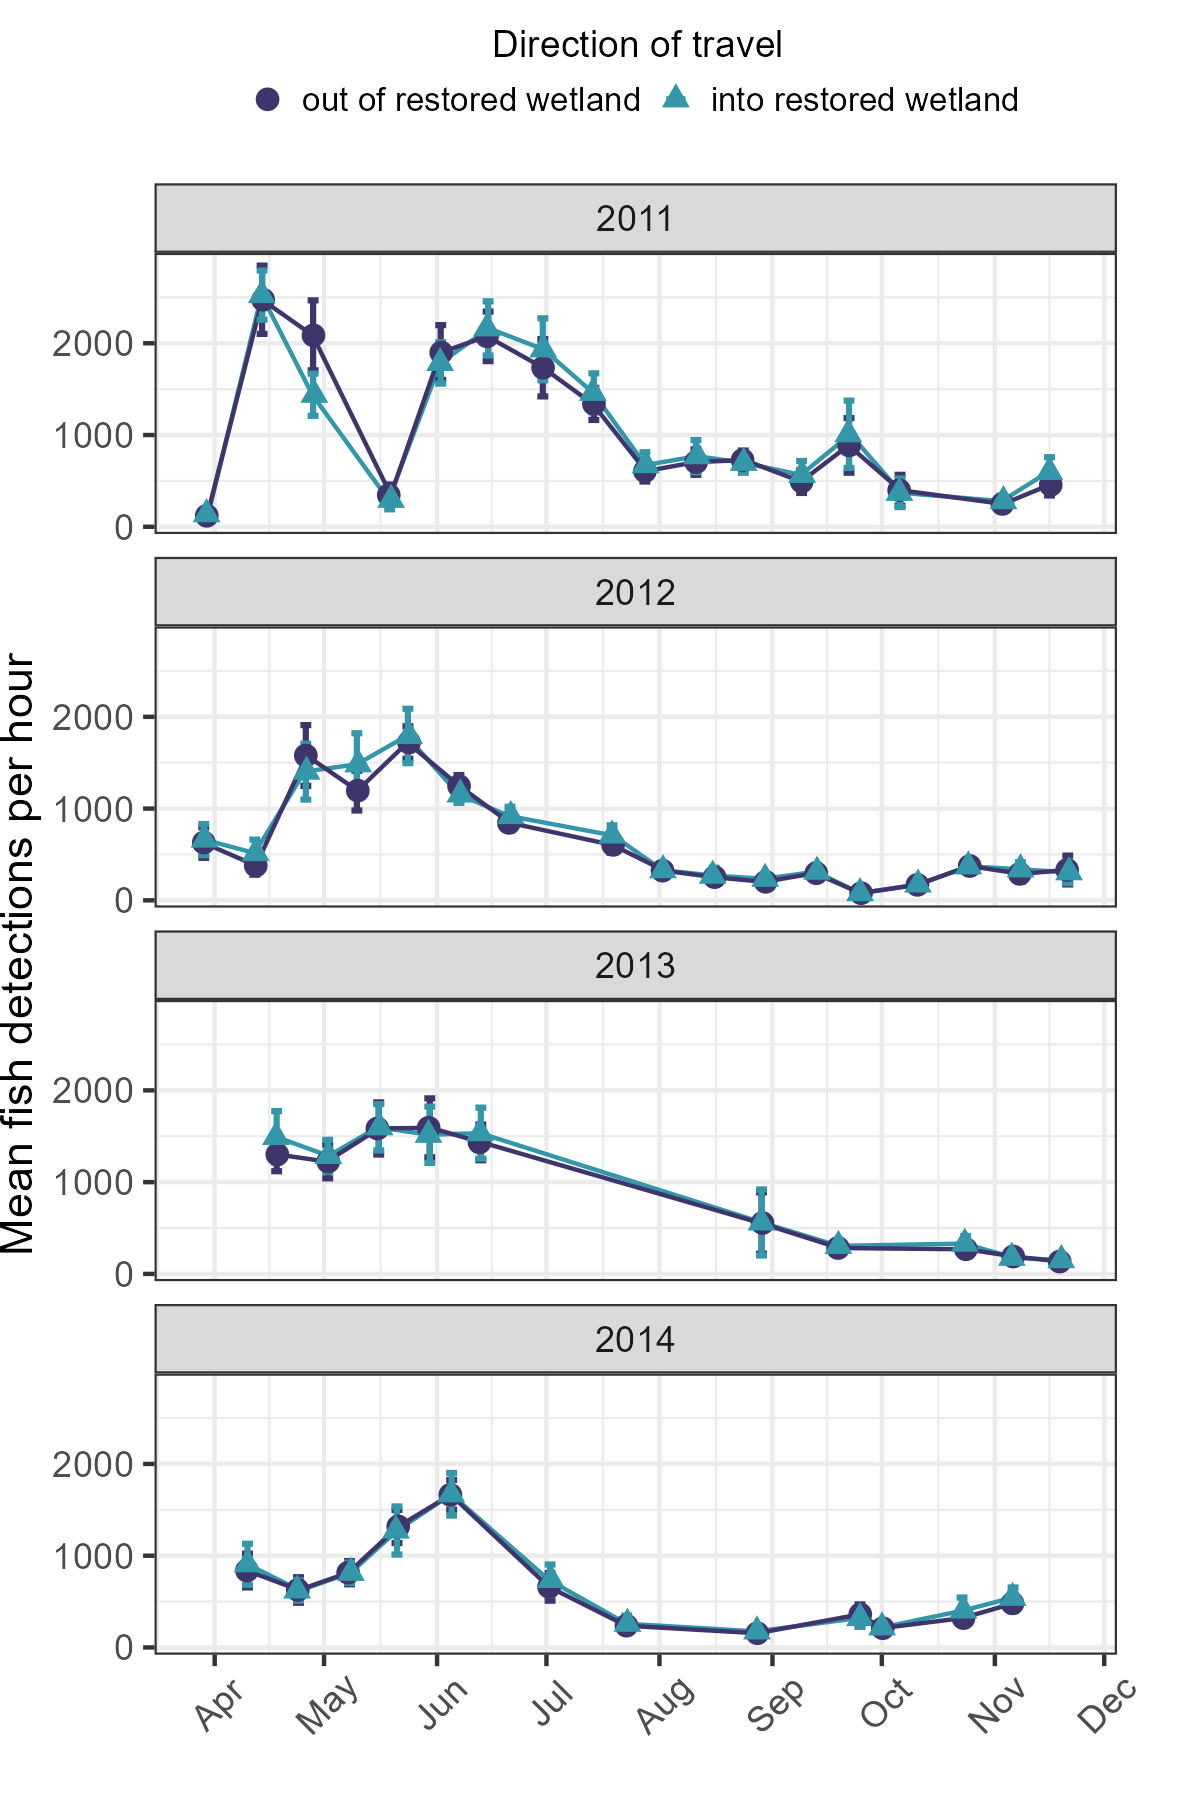
Mean hourly fish detections per deployment event for detections traveling away from (dark colored/purple circles) or towards (light/blue triangles) restored wetland. Error bars represent 95% CIs. X-axis marks indicate first day of month.
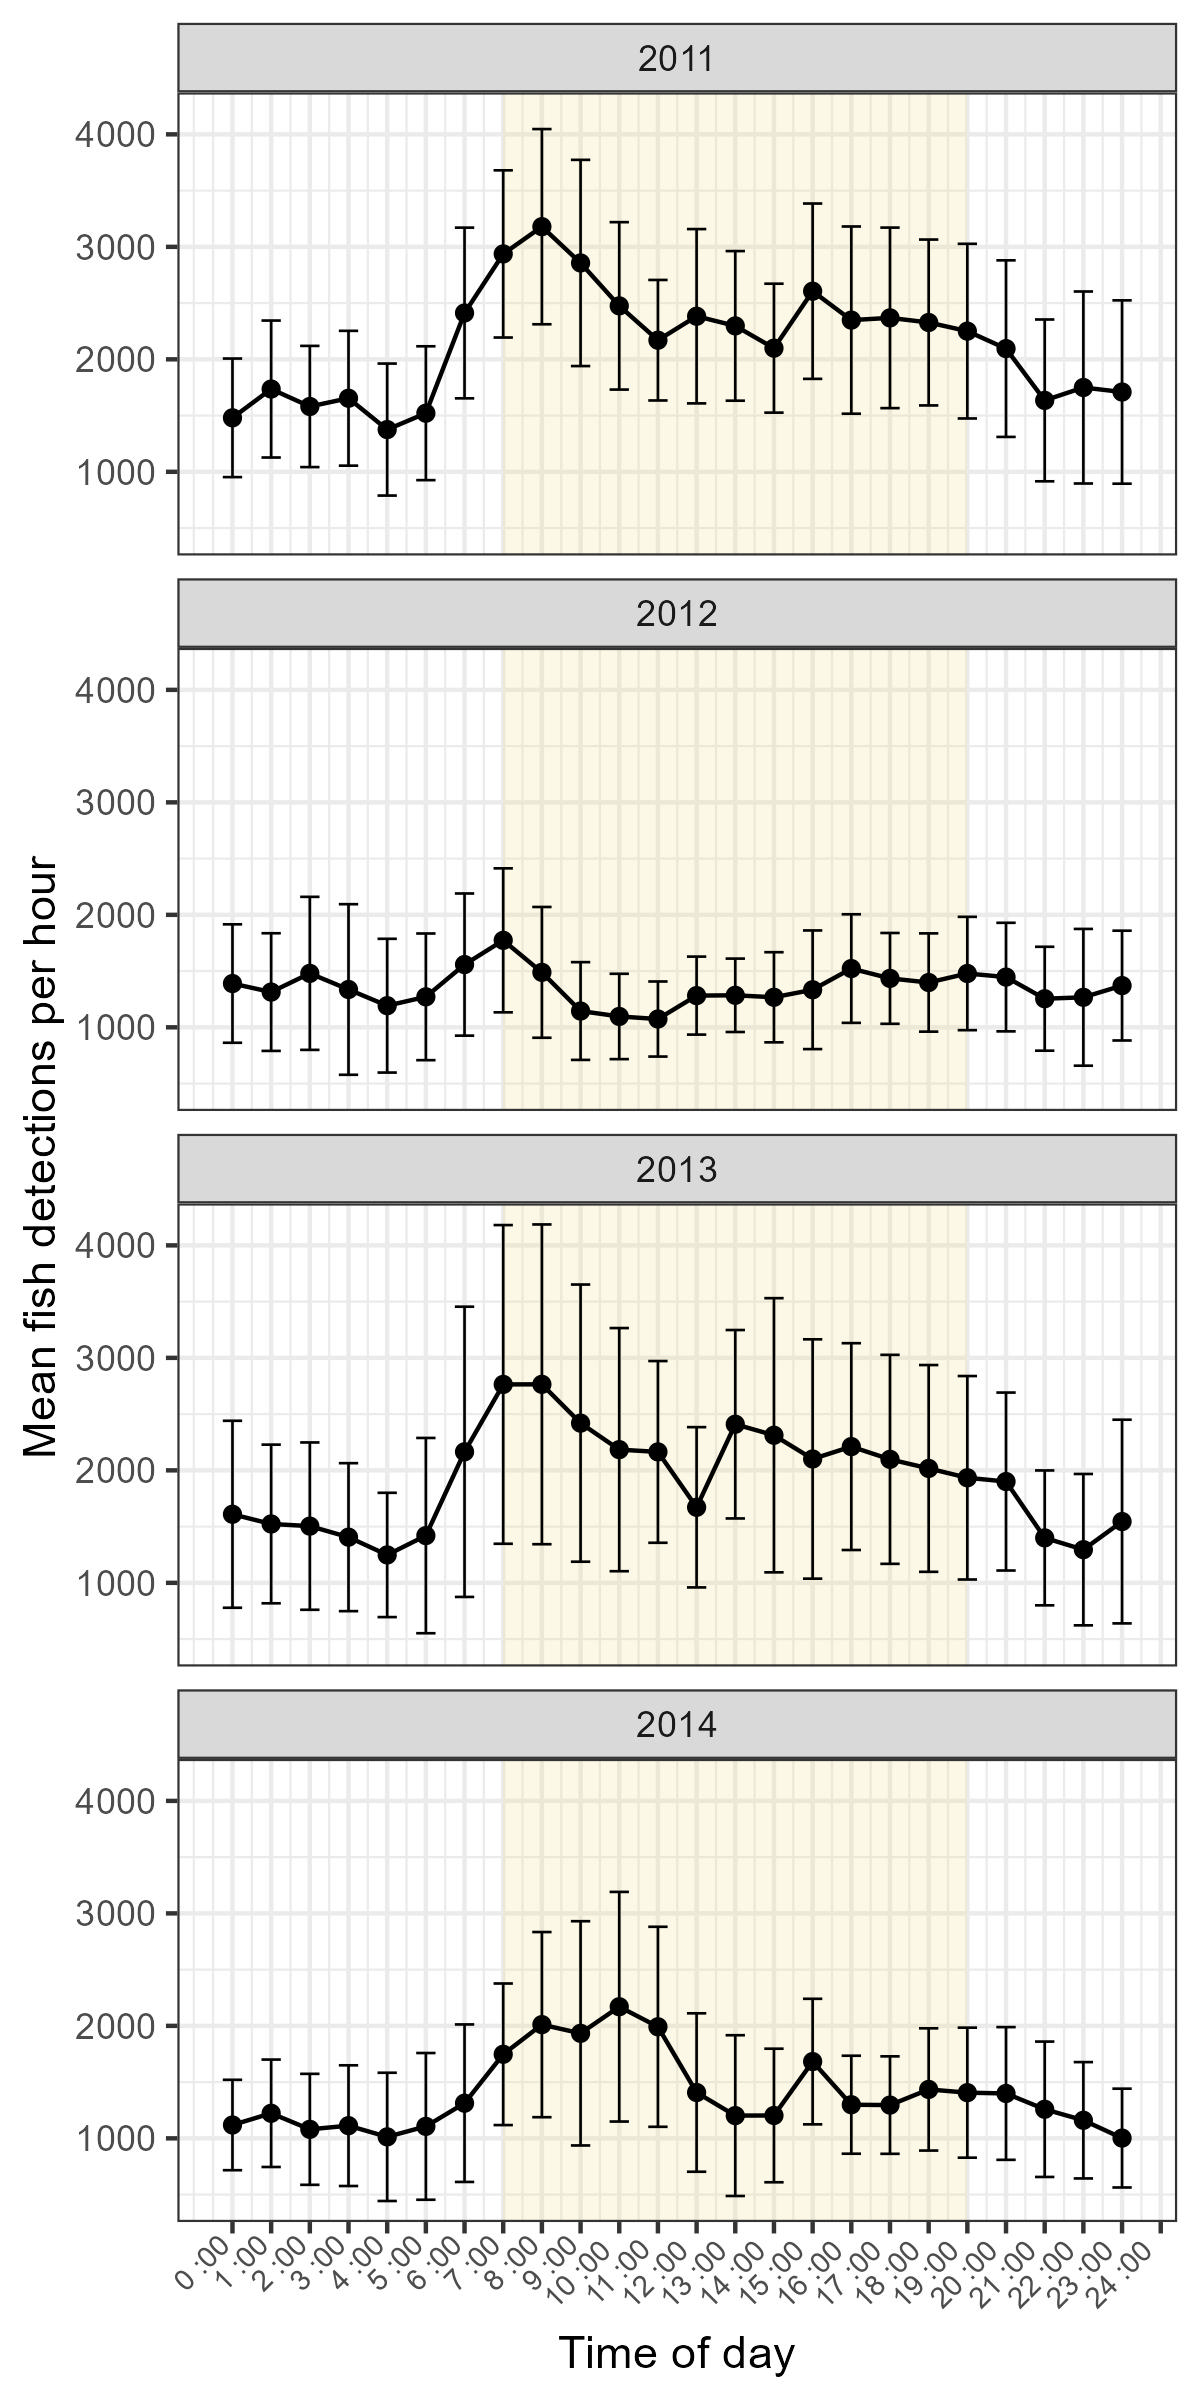
Mean number of fish detections based on year and time of day. Points represent summarized data for the hour interval commencing at the indicated time for all observations in a particular year. Error bars indicate 95% CIs. Yellow shading indicates “typical” daylight hours as a visual guide, but the precise time of sunrise and sunset varies seasonally (i.e., earlier or later surrounding the summer and winter solstices, respectively).
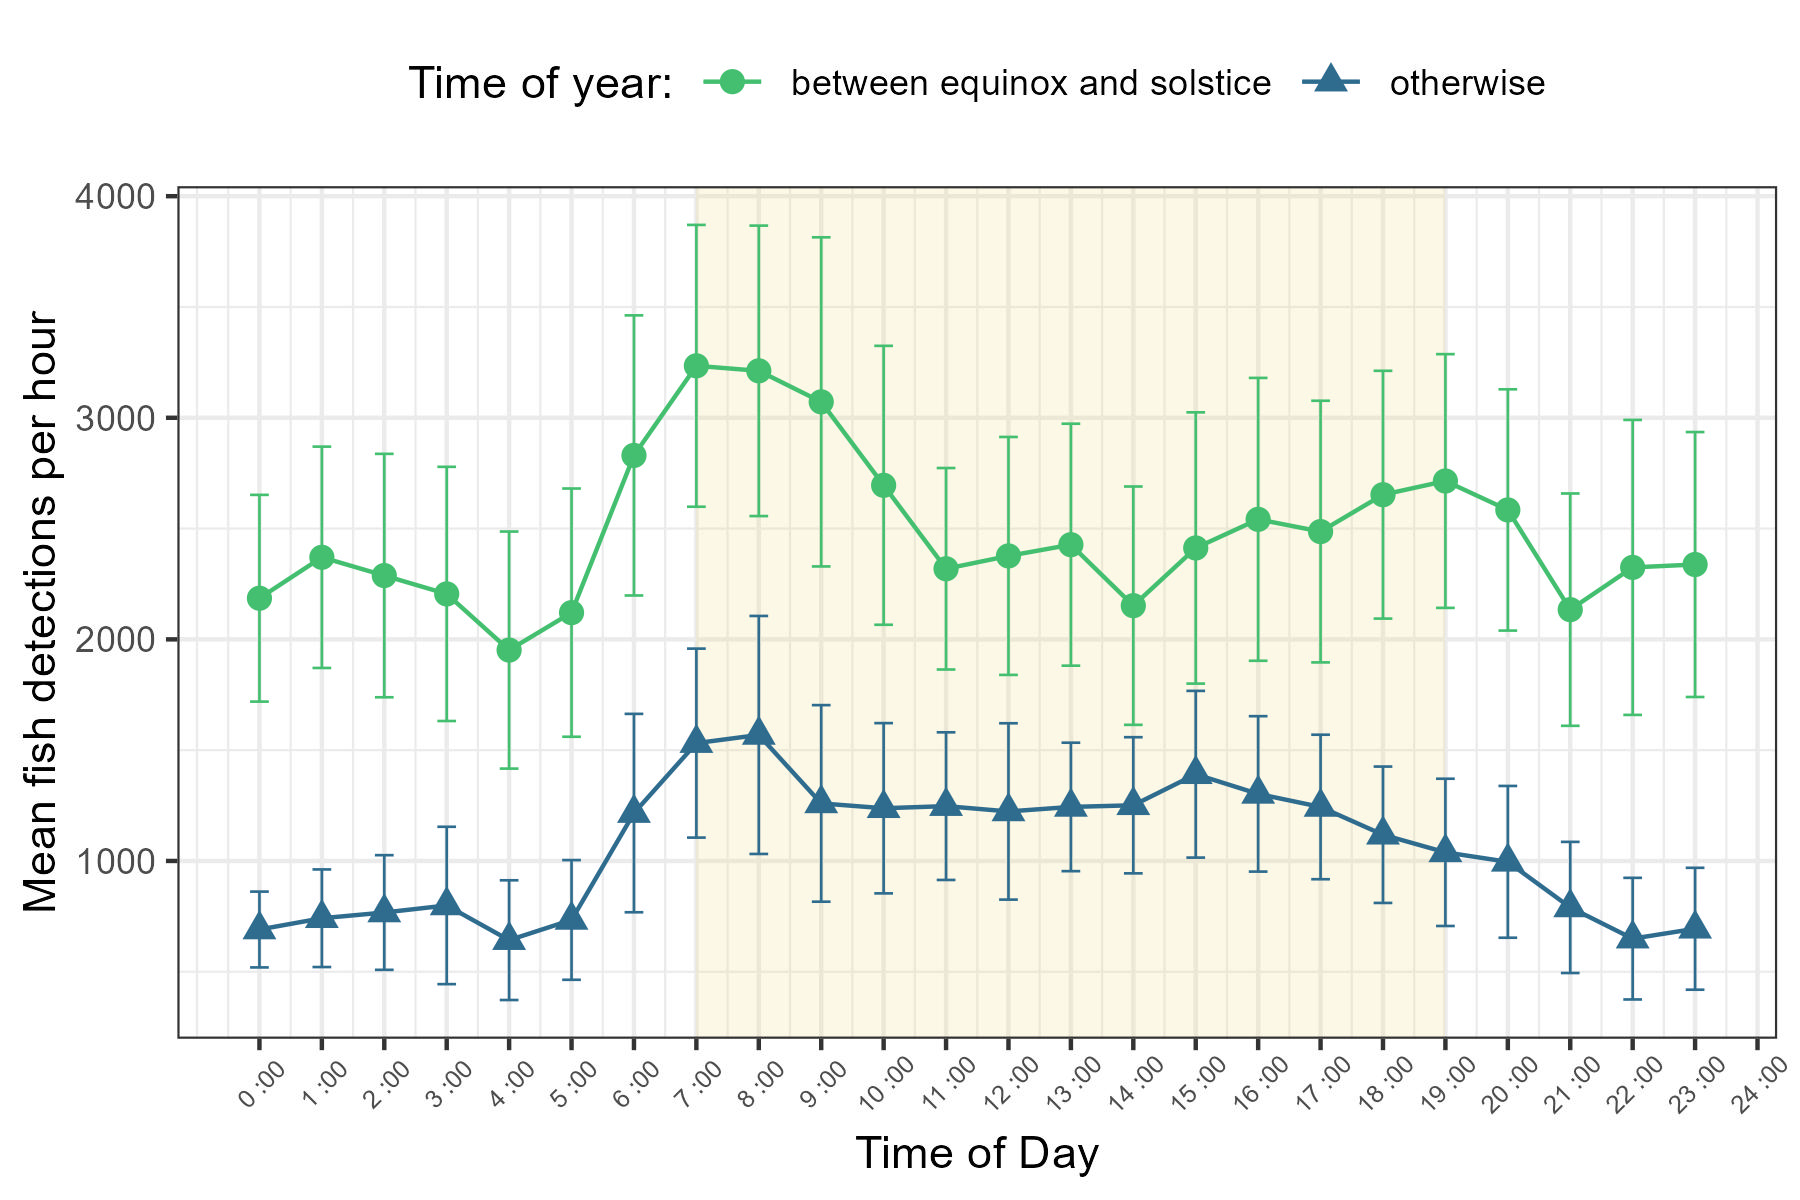
Mean hourly fish detections occurring between the vernal equinox and summer solstice (light green circles) and mean hourly fish detections at other times of the year (dark blue triangles). Points represent summarized data for the hour interval commencing at indicated time. Data are from 2011-2014. Error bars indicate 95% CIs. Yellow shading indicates typical daylight hours as a visual guide, but the precise time of sunrise and sunset varies seasonally (i.e., earlier or later surrounding the summer and winter solstices, respectively).
Acknowledgements & Funding Statement
The authors thank the many people and organizations that generously gave their time and resources to support the research described in this paper. We thank Jason Lewis, Ron Huffman, and the many U.S. Fish and Wildlife staff (current and former) for their unwavering support of research into Great Lakes coastal wetlands and restoration strategies on the Ottawa National Wildlife Refuge. We appreciate the students, contractors, and collaborators who contributed to collection of data described in this paper, and value the statistical guidance provided by Wayne Thogmartin and Sean Lewandowski. Finally, we thank the reviewers for their insightful comments that helped improve this paper. Funding for this work was provided by the Great Lakes Restoration Initiative, U.S. Fish and Wildlife Service, and U.S. Geological Survey. The U.S. Department of Interior’s ChatGPT (based on GPT-4) was used for stylistic suggestions during manuscript preparation. Any use of trade, firm, or product names is for descriptive purposes only and does not imply endorsement by the U.S. Government.
References
Akaike, H., 1974. A new look at the statistical model identification. IEEE Trans. Autom. Contol. 19(6), 716-723. https://doi.org/10.1109/TAC.1974.1100705
Allan, J.D., Manning, N.F., Smith, S.D.P., Dickinson, C.E., Joesph, C.A., Pearsall, D.R., 2017. Ecosystem services of Lake Erie: spatial distribution and concordance of multiple services. J. Great Lakes Res. 43(4), 678-688. https://doi.org/10.1016/j.jglr.2017.06.001
Allinger, L.E., Reavie, E.D., 2013. The ecological history of Lake Erie as recorded by the phytoplankton community. J. Great Lakes Res. 39(3), 365-382. https://doi.org/10.1016/j.jglr.2013.06.014
Arend, K.K., Beletsky, D., DePinto, J.V., Ludsin, S.A., Roberts, J.J., Rucinski, D.K., Scavia, D., Schwab, D.J., & Höök, T.O., 2010. Seasonal and interannual effects of hypoxia on fish habitat quality in central Lake Erie. Freshw. Biol. 56(2), 366-383. https://doi.org/10.1111/j.1365-2427.2010.02504.x
Bajer, P.G., Sorensen, P.W., 2009. Recruitment and abundance of an invasive fish, the Common Carp, is driven by its propensity to invade and reproduce in basins that experience winter-time hypoxia in interconnected lakes. Biol. Invasions 12, 1101-1112. https://doi.org/10.1007/s10530-009-9528-y
Banet, N.V., Fieberg, J., Sorensen, P.W., 2021. Migration, homing, and spatial ecology of Common Carp in interconnected lakes. Ecol. Freshw. Fish 31(1), 164-176. https://doi.org/10.1111/eff.12622
Bartoń, K., 2024. MuMIn: Multi-Model Inference. R package version 1.48.4. https://doi.org/10.32614/CRAN.package.MuMIn
Baustian, J.J., Kowalski, K.P., Czayka, A., 2018. Using turbidity measurements to estimate total phosphorous and sediment flux in a Great Lakes coastal wetland. Wetlands 38, 1059-1065. https://doi.org/10.1007/s13157-018-1044-3
Bernal, B., Mitsch, W.J., 2012. Comparing carbon sequestration in temperate freshwater wetland communities. Glob. Change Biol.18, 1636-1647. https://doi.org/10.1111/j.1365-2486.2011.02619.x
Bhagat, Y., Ciborowski, J.J.H., Johnson, L.B., Uzarski, D.G., Burton, T.M., Timmermans, S.T.A., Cooper, M.J., 2007. Testing a fish index of biotic integrity for responses to different stressors in Great Lakes coastal wetlands. J. Great Lakes Res. 33(3), 224-235. https://doi.org/10.3394/0380-1330(2007)33[224:TAFIOB]2.0.CO;2
Bhagat, Y., RuetzIII, C.R., 2011. Temporal and fine-scale spatial Variation in fish assemblage structure in a drowned river mouth system of Lake Michigan. Trans. Am. Fish. Soc. 140(6), 1429-1440. http://dx.doi.org/10.1080/00028487.2011.630278
Bosley, T.R., 1978. Loss of wetlands on the west shore of Green Bay, Wisconsin. Academy of Science, Arts and Letters. 66, 235-245. https://doi.org/10.1016/j.jglr.2013.06.014
Boswell, K.M., Wilson, M.P., Cowan, Jr., J.H., 2008. A semiautomated approach to estimating fish size, abundance, and behavior from Dual-frequency IDentification SONar (DIDSON) Data. N. Am. J. Fish. Manag. 28(3), 799-807. https://doi.org/10.1577/M07-116.1
Bouvier, L.D., Cottenie, K., Doka, S.A., 2009. Aquatic connectivity and fish metacommunities in wetlands of the lower Great Lakes. Can. J. Fish. Aquat. Sci. 66(6), 933-948. https://doi.org/10.1139/F09-050
Brooks. M.E., Kristensen, K., van Benthem, K.J., Magnusson, A., Berg, C.W., Nielsen, A., Skaug, H.J., Maechler, M., Bolker, B.M., 2017. glmmTMB balances speed and flexibility among packages for zero-inflated generalized linear mixed modeling. The R Journal 9(2), 378–400. https://doi.org/10.32614/RJ-2017-066
Brown, R.S., Power, G., Beltaoa, S., 2001. Winter movements and habitat use of riverine Brown Trout, White Sucker, and Common Carp in relation to flooding and ice breakup. J. Fish Biol. 59(5), 1126-1141. https://doi.org/10.1111/j.1095-8649.2001.tb00180.x
Budnik, R.R., Miner, J.G., 2017. Novel aspects of stocked juvenile Steelhead emigration patterns as revealed using dual-frequency identification sonar. J. Great Lakes Res. 43(5), 970-977. https://doi.org/10.1016/j.jglr.2017.07.004
Carter, G.S., Kowalski, K.P., Eggleston, M.R., 2022. Turbidity and estimated phosphorous retention in a reconnected Lake Erie coastal wetland. Water 14, 1843. https://doi.org/10.3390/w14121853
Chizinski, C.J., Bajer, P.G., Headrick, M.E., Sorensen, P.W., 2016. Different migratory strategies of invasive Common Carp and native Northern Pike in the American Midwest suggest an opportunity for selective management strategies. N. Am. J. Fish. Manag., 36(4), 769–779. https://doi.org/10.1080/02755947.2016.1167141
Chubb, S.L., Liston, C.R., 1986. Density and distribution of larval fishes in Pentwater Marsh, a coastal wetland on Lake Michigan. J. Great Lakes Res. 12(4), 332-343. https://doi.org/10.1016/S0380-1330(86)71734-6
Cvetkovic, M., Chow-Fraser, P., 2011. Use of ecological indicators to assess the quality of Great Lakes coastal wetlands. Ecol. Indic. 11(6), 1609-1622. https://doi.org/10.1016/j.ecolind.2011.04.005
Diller, S.N., Harrison, A.M., Kowalski, K.P., Brady, V.J., Ciborowski, J.J.H., Cooper, M.J., Dumke, J.D., Gathman, J.P., RuetzIII, C.R., Uzarski, D.G., Wilcox, D.A., Schaeffer, J.S., 2022. Influences of seasonality and habitat quality on Great Lakes coastal wetland fish community composition and diets. Wetl. Ecol. Manag. 30, 439-460. https://doi.org/10.1007/s11273-022-09862-8
Eggleston, M.R., Milne, S.W., Ramsay, M., Kowalski, K.P., 2020. Improved fish counting method accurately quantifies high-density fish movement in Dual-frequency IDentification SONar data files from a coastal wetland environment. N. Am. J. Fish. Manag. 40, 883-892. https://doi.org/10.1002/nafm.10451
Emery, A.R., 1973. Preliminary comparisons of day and night habits of freshwater fish in Ontario lakes. J. Fish. Res. Board Can. 30(6), 761-774. https://doi.org/10.1139/f73-131
Forsythe, P.S., Scribner, K.T., Crossman, J.A., Ragavendran, A., Baker, E.A., Davis, C., Smith, K.K., 2012. Environmental and lunar cues are predictive of the timing of river entry and spawning-site arrival in Lake Sturgeon Acipenser fulvescens. J. Fish. Biol. 81(1), 35-53. https://doi.org/10.1111/j.1095-8649.2012.03308.x
Fracz, A., Chow-Fraser, P., 2012. Impacts of declining water levels on the quantity of fish habitat in coastal wetlands of eastern Georgian Bay, Lake Huron. Hydrobiologia 702, 151-169. https://doi.org/10.1007/s10750-012-1318-3
French, J.R.P., Wilcox, D.A., Nichols, S.J., 1999. Passing of Northern Pike and Common Carp through experimental barriers designed for use in wetland restoration. Wetlands 19, 883-888. https://doi.org/10.1007/BF03161790
Frieswyk, C.B., Zedler, J.B., 2007. Vegetation change in Great Lakes coastal wetlands: deviation from the historical cycle. J. Great Lakes Res. 33(2), 366-380. https://doi.org/10.3394/0380-1330(2007)33[366:VCIGLC]2.0.CO;2
Funnell, T.R., Brenden, T.O., Kraus, R., MacDougall, T., Markham, J., Murray, C., Robinson, J., Vandergoot, C.S., 2023. Seasonal spatial ecology of Lake Trout in Lake Erie. Trans. Am. Fish. Soc. 152(5), 672-693. https://doi.org/10.1002/tafs.10430
Gorman, O.T., Yule, D.L., Stockwell, J.D., 2012. Habitat use by fishes of Lake Superior. II. Consequences of diel habitat use for habitat linkages and habitat coupling in nearshore and offshore waters. Aquat. Ecosyst. Health Manag. 15(3), 354-367. https://doi.org/10.1080/14634988.2012.711664
Gottgens, J.F., Swartz, B.P., Kroll, R.W., Eboch, M., 1998. Long-term GIS-based records of habitat change in a Lake Erie coastal marsh. Wetl. Ecol. Manag. 6, 5-17. https://doi.org/10.1023/A:1008439519760
Grand, J., Saunders, S.P., Michel, N.L., Elliott, L., Beilke, S., Bracey, A., Gehring, T.M., Gnass Giese, E.E., Howe, R.W., Kasberg, B., Miller, N., Niemi, G.J., Norment, C.J., Tozer, D.C., Wu, J., Wilsey, C., 2020. Prioritizing coastal wetlands for marsh bird conservation in the U.S. Great Lakes. Biol. Conserv. 249, 1-12. https://doi.org/10.1016/j.biocon.2020.108708
Hartig, J.H., Sanders, C., Wyma, R.J.H., Boase, J.C., Roseman, E.F., 2018. Habitat rehabilitation in the Detroit River Area of Concern. Aquat. Ecosyst. Health Manag. 21(4): 458-469. https://doi.org/10.1080/14634988.2018.1536437
Helfman, G.S., 1981. Twilight activities and temporal structure in a freshwater fish community. Can. J. Fish. Aquat. Sci. 38(11), 1405-1420. https://doi.org/10.1139/f81-187
Herdendorf, C.E., 1992. Lake Erie coastal wetlands: an overview. J. Great Lakes Res. 18, 533-551. https://doi.org/10.1016/S0380-1330(92)71321-5
Hicke, J.A., Lucatello, S., Mortsch, L.D., Dawson, J., Domínguez Aguilar, M., Enquist, C.A.F., Gilmore, E.A., Gutzler, D.S., Harper, S., Holsman, K., Jewett, E.B., Kohler, T.A., Miller, K.A., 2022. North America. In: H.-O.Pörtner, D.C.Roberts, M.Tignor, E.S.Poloczanska, K.Mintenbeck, A.Alegría, M.Craig, S.Langsdorf, S.Löschke, V.Möller, A.Okem, B.Rama, (Eds.), Climate Change 2022: Impacts, Adaptation and Vulnerability. Contribution of Working Group II to the Sixth Assessment Report of the Intergovernmental Panel on Climate Change, pp. 1929–2042. Cambridge University Press, Cambridge, UK and New York, NY, USA. https://doi.org/10.1017/9781009325844.016
Hightower, J.E., Magowan, K.J., Brown, L.M., Fox, D.A., 2013. Reliability of fish size estimates obtained from multibeam imaging sonar. J. Fish Wildl. Manag. 4(1), 86-96. https://doi.org/10.3996/102011-JFWM-061
Holmes, J.A., Cronkite, G.M.W., Enzenhofer, H.J., Mulligan, T.J., 2006. Accuracy and precision of fish-count data from a “Dual frequency IDentification SONar” (DIDSON) imaging system. ICES J. Mar. Sci. 64(3), 543-555. https://doi.org/10.1016/j.icesjms.2005.08.015
Hughes, J.B., Hightower, J.E., 2015. Combining split-beam and dual-frequency identification sonars to estimate abundance of anadromous fishes in the Roanoke River, North Carolina. N. A. J. Fish. Manag. 35(2), 229-240. https://doi.org/10.1080/02755947.2014.992558
Johnson, D.L., Lynch, W.E., Morrison, T.W., 1997. Fish communities in a diked Lake Erie wetland and an adjacent undiked area. Wetlands 17, 43-54. https://doi.org/10.1007/BF03160717
Jude, D.J., Pappas, J., 1992. Fish utilization of Great Lakes coastal wetlands. J. Great Lakes Res. 18(4), 651-672. https://doi.org/10.1016/S0380-1330(92)71328-8
Kaller, M.D., Kelso, W.E., Trexler, J.C., 2013. Wetland fish monitoring and assessment. In: J.T.Anderson, C.A.Davis (Eds.), Wetland Techniques, pp. 197-263. Springer, Dordrecht, Netherlands. https://doi.org/10.1007/978-94-007-6931-1_6
Keast, A., Harker, J., Turnbull, D., 1978. Nearshore fish habitat utilization and species associations in Lake Opinicon (Ontario, Canada). Env. Biol. Fish. 3(2), 173-184. https://doi.org/10.1007/BF00691941
Kough, A.S., Jacobs, G.R., Gorsky, D., Willink, P.W., 2018. Diel timing of Lake Sturgeon (Acipenser fulvescens) activity revealed by satellite tags in the Laurentian Great Lakes Basin. J. Great Lakes Res. 44(1), 157-165. https://doi.org/10.1016/j.jglr.2017.10.008
Kowal, P.D., Badiou, P., Emery, R.B., Goldsborough, L.G., Wrubleski, D.A., Armstrong, L.M., Page, B., 2022. Improvements in water clarity and submersed aquatic vegetation cover after exclusion of invasive Common Carp from a large freshwater coastal wetland, Delta Marsh, Manitoba. Front. Environ. Sci. 20(10) https://doi.org/10.3389/fenvs.2022.992690
Kowalski, K.P., Wiley, M.J., Wilcox, D.A., 2014. Fish assemblages, connectivity, and habitat restoration in a diked Great Lakes coastal wetland complex. Trans Am. Fish. Soc. 143, 1130-1142. https://doi.org/10.1080/00028487.2014.911207
Landsman, S.J., Nguyen, V.M., Gutowsky, L.F.G., Gobin, J., Cook, K.V., Binder, T.R., Lower, N., McLaughlin, R.L., Cooke, S.J., 2011. Fish movement and migration studies in the Laurentian Great Lakes: Research trends and knowledge gaps. J. Great Lakes Res. 37(2), 363-379. https://doi.org/10.1016/j.jglr.2011.03.003
Langer, T.A., Murry, B.T., Pangle, K.L., Uzarski, D.G., 2016. Species turnover drives β-diversity patterns across multiple spatial and temporal scales in Great Lake coastal wetland communities. Hydrobiologia 777, 55-66. https://doi.org/10.1007/s10750-016-2762-2
Langer, T.A., Cooper, M.J., Reisinger, L.S., Reisinger, A.J., Uzarski, D.G., 2018. Water depth and lake-wide water level fluctuation influence on α- and β-diversity of coastal wetland fish communities. J. Great Lakes Res. 44(1), 70-76. https://doi.org/10.1016/j.jglr.2017.11.001
Loder, A.L., Zamaria, S.A., Arhonditsis, G.B., Finkelstein, S.A., 2023. Controls on organic carbon stocks among restored wetland soils in the Long Point region of southern Ontario, Canada. Restor. Ecol. 31 (5). https://doi.org/10.1111/rec.13925
Lougheed, V.L., Crosbie, B., Chow-Fraser, P., 1998. Predictions on the effect of Common Carp (Cyprinus carpio) exclusion on water quality, zooplankton, and submergent macrophytes in a Great Lakes wetland. Can. J. Fish. Aquat. Sci. 55(5), 1189-1197. https://doi.org/10.1139/f97-315
Ludsin, S.A., Kershner, M.W., Blocksom, K.A., Knight, R.L., Stein, R.A., 2001. Life after death in Lake Erie: nutrient controls drive fish species richness, rehabilitation. Ecol. Appl. 11(3) 731-746. https://doi.org/10.1890/1051-0761(2001)011[0731:LADILE]2.0.CO;2
Marcy-Quay, B., Kraft, C.E., 2021. Diel movement by White Suckers (Catostomus commersonii) in connected north lakes. Northeast Nat. 28(4), 430-443. https://doi.org/10.1656/045.028.0402
McKennaJr., J.E., 2008. Diel variation in near-shore great lakes fish assemblages and implications for assessment sampling and coastal management. J. Freshw. Ecol. 23(1), 131-141. https://doi.org/10.1080/02705060.2008.9664564
Midwood, J.D., Chapman, J.M., Cvetkovic, M., King, G.D., Ward, T.D., Suski, C.D., Cooke, S.J., 2016. Diel variability in fish assemblages in coastal wetlands and tributaries of the St. Lawrence River: a cautionary tale for fisheries monitoring. Aquat. Sci. 78, 267-277. https://doi.org/10.1007/s00027-015-0422-7
Mitsch, W.J., Wang, N., 2000. Large-scale coastal wetland restoration on the Laurentian Great Lakes. Ecol. Eng. 15(3-4), 267-282. https://doi.org/10.1016/S0925-8574(00)00081-1
Montgomery, F., Reid, S.M., Mandrak, N.E., 2020. Extinction debt of fishes in Great Lakes coastal wetlands. Biol. Conserv. 241, 1-19. https://doi.org/10.1016/j.biocon.2019.108386
Moore, D.J., Mandrak, N.E., 2024. Evaluating the effect of Common Carp control on restoration of a coastal wetland in the Laurentian Great Lakes. Water 16, 1929. https://doi.org/10.3390/w16131929
Nakagawa, S., Schielzeth, H., 2012. A general and simple method for obtaining R2 from generalized linear mixed-effects models. Methods Ecol. Evol. 4(2), 133-142. https://doi.org/10.1111/j.2041-210x.2012.00261.x
O'Reilly, K.E., Berg, M.B., Cooper, M.J., Forsythe, P.S., Houghton, C.J., Shrovnal, J.S., Student, J.J., Uzarski, D.G., Lamberti, G.A., 2023. Lakescape connectivity: mobile fish consumers link Lake Michigan coastal wetland and nearshore food webs. Ecosphere 14(2), 1-21. https://doi.org/10.1002/ecs2.4333
Parker, A.D., Cooper, M.J., RuetzIII, C.R., Coulter, D.P., Uzarski, D.G., 2012. Chemical and physical factors associated with Yellow Perch abundance in Great Lakes coastal wetlands: patterns within and among wetland types. Wetl. Ecol. Manag. 20, 137-150. https://doi.org/10.1007/s11273-012-9250-x
Peterson, C.T., Grubbs, R.D., 2023. Temporal community structure and seasonal climatic migration of coastal sharks and large teleost fishes in the northeast Gulf of Mexico. Can. J. Fish. Aquat. Sci. 80(8), 1335-1350. https://doi.org/10.1139/cjfas-2022-0124
Piczak, M.L., Brooks, J.L., Boston, C., Doka, S.E., Portiss, R., Lapointe, N.W.R., Midwood, J.D., Cooke, S.J., 2023a. Spatial ecology of non-native Common Carp (Cyprinus carpio) in Lake Ontario with implications for management. Aquat. Sci. 85(20). https://doi.org/10.1007/s00027-022-00917-9
Piczak, M.L., Theÿsmeÿer, T., Doka, S.E., Midwood, J.D., Cooke, S.J., 2023b. Knowledge of spawning phenology may enhance selective barrier passage for wetland fishes. Wetlands 43(72). https://doi.org/10.1007/s13157-023-01723-1
Pierce, C.L., Corcoran, A.M., Gronbach, A.N., Hsia, S., Mullarkey, B.J., Schwartzhoff, A.J., 2001. Influence of diel period on electrofishing and beach seining assessments of littoral fish assemblages. N. Am. J. Fish. Manag. 21(4), 918-926. https://doi.org/10.1577/1548-8675(2001)021%3C0918:IODPOE%3E2.0.CO;2
Randall, R.G., Minns, C.K., Cairns, V.W., Moore, J.E., 1996. The relationship between an index of fish production and submerged macrophytes and other habitat features at three littoral areas in the Great Lakes. Can. J. Fish. Aquat. Sci. 53(S1), 35-44. https://doi.org/10.1139/f95-271
Raphael, C.N., Jaworski, E., 1979. Economic value of fish, wildlife, and recreation in Michigan’s coastal wetlands. Coast. Manage. 5, 181-194. https://doi.org/10.1080/08920757909361805
Rea, C.L., Bisesi, M.S., Mitsch, W., Andridge, R., Lee, J., 2015. Human health-related ecosystem services of avian-dense coastal wetlands adjacent to a western Lake Erie swimming beach. EcoHealth 12, 77-87. https://doi.org/10.1007/s10393-014-1007-y
Reisinger, L. S., Pangle, K. L., Cooper, M. J., Learman, D. R., Woolnough, D. A., Bugaj, M. R., Burck, E. K., Dollard, R. E., Goetz, A. N., Goss, M. K., Gu, S., Karl, K. E., Rose, V. A., Scheunemann, A. E., Webster, R., Weldon, C. R., Yan, J., Uzarski, D. G., 2019. Short-term variability in coastal community and ecosystem dynamics in northern Lake Michigan. Freshw. Sci. 38(3), 661-673. https://doi.org/10.1086/704999
Ross, J.E., Mayer, C.M., Tyson, J.T., Weimer, E.J., 2016. Comparison of electrofishing techniques and effort allocation across diel time periods, seasons, sites, and habitat in the Ohio coastal waters of western Lake Erie. N. Am. J. Fish. Manag. 36(1), 85-95. https://doi.org/10.1080/02755947.2015.1111275
Rummell, A.J., Borland, H.P., Leon, J.X., Henderson, C.J., Gilby, B.L., Ortodossi, N.L., Mosman, J.D., Gorissen, B. and Olds, A.D., 2023. Fish and crustaceans provide early indicators of success in wetland restoration. Restor. Ecol., 31(8). https://doi.org/10.1111/rec.13952
Schoen, L.S., Student, J.J., Hoffman, J.C., Sierszen, M.E., Uzarski, D.G., 2016. Reconstructing fish movements between coastal wetland and nearshore habitats of the Great Lakes. Limnol. Oceanogr. 61(5), 1800-1813. https://doi.org/10.1002/lno.10340
Shoup, D.E., Carlson, R.E., Heath, R.T., 2004. Diel activity levels of centrarchid fishes in a small Ohio lake. Trans. Am. Fish. Soc. 133, 1264-1269. https://doi.org/10.1577/T03-037.1
Sierszen, M.E., Morrice, J.A., Trebitz, A.S., Hoffman, J.C., 2012. A review of selected ecosystem services provided by coastal wetlands of the Laurentian Great Lakes. Aquat. Ecosyst. Health Manag. 15(1), 92-106. https://doi.org/10.1080/14634988.2011.624970
Sierszen, M.E., Schoen, L.S., Kosiara, J.M., Hoffman, J.C., Cooper, M.J., Uzarski, D.G., 2019. Relative contributions of nearshore and wetland habitats to coastal food webs in the Great Lakes. J. Great Lakes Res. 45(1), 129-137. https://doi.org/10.1016/j.jglr.2018.11.006
Smith, S.H., 1972. Factors of ecologic succession in oligotrophic fish communities of the Laurentian Great Lakes. J. Fish. Res. Bd. Canada 29(6), 717-730. https://doi.org/10.1139/f72-117
Steinhart, G.B., Bode, S., Thieme, J., Winslow, C.J., 2017. Fish passage through three types of structures in diked coastal Lake Erie wetlands. N. Am. J. Fish. Manag. 37(3), 497-509. https://doi.org/10.1080/02755947.2017.1290721
Stott, N., Miner, J., 2022. Environmental cues of spawning migration into a confined wetland by Northern Pike and Common Carp in Lake Erie: identifying fine-scale patterns. N. Am. J. Fish. Manag. 42, 239-249. https://doi.org/10.1002/nafm.10742
Thieurmel B., Elmarhraoui A., 2022. suncalc: Compute Sun Position, Sunlight Phases, Moon Position and Lunar Phase. R package version 0.5.2. https://doi.org/10.32614/CRAN.package.suncalc
Trebitz, A.S., Brazner, J.C., Danz, N.P., Pearson, M.S., Peterson, G.S., Tanner, D.K., Taylor, D.L., West, C.W., Hollenhorst, T.P., 2009. Seasonal activity patterns of fish in a temperate freshwater system. Can. J. Fish. Aquat. Sci. 67(3), 472-482. https://doi.org/10.1139/F09-089
Trebitz, A.S., Hoffman, J.C., 2015. Coastal wetland support of Great Lakes fisheries: progress from concept to quantification. Trans Am. Fish. Soc. 144 (2), 352-372. https://doi.org/10.1080/00028487.2014.982257
Uzarski, D.G., Burton, T.M., Cooper, M.J., Ingram, J.W., Timmermans, S.T.A., 2005. Fish habitat use within and across wetlands of the five Great Lakes: development of a fish-based index of biotic integrity. J. Great Lakes. Res. 31(S1), 171-187. https://doi.org/10.1016/S0380-1330(05)70297-5
Uzarski, D.G., Brady, V.J., Cooper, M.J., Wilcox, D.A., Albert, D.A., Axler, R.P., Bostwick, P., Brown, T.N., Ciborowski, J.J.H., Danz, N.P., Gathman, J.P., Gehring, T.M., Grabas, G.P., Garwood, A., Howe, R.W., Johnson, L.B., Lamberti, G.A., Moerke, A.H., Murry, B.A., Niemi, G.J., Norment, C.J., RuetzIII, C.R., Steinman, A.D., Tozer, D.C., Wheeler, R., O’Donnell, T.K., Schneider, J.P., 2017. Standardized measures of coastal wetland condition: implementation at a Laurentian Great Lakes basin-wide scale. Wetlands 37, 15-32. https://doi.org/10.1007/s13157-016-0835-7
Watkinson, D.A., Charles, C., Enders, E.C., 2021. Spatial ecology of Common Carp (Cyprinus carpio) in Lake Winnipeg and its potential for management actions. J. Great Lakes Res. 47(3), 583-591. https://doi.org/10.1016/j.jglr.2021.03.004
Whillans, T.H., 1996. Historic and comparative perspectives on rehabilitation of marshes as habitat for fish in the lower Great Lakes basin. Can. J. Fish. Aquat. Sci. 53(S1), 58-66. https://doi.org/10.1139/f96-020
Zhang, K., Ye, Z., Qi, M., Cai, W., Saraiva, J. L., Wen, Y., Liu, G., Zhu, Z., Zhu, S., Zhao, J., 2024.Water quality impact on fish behavior: a review from an aquaculture perspective. Rev. Aquac. 17(1), e12985. https://doi.org/10.1111/raq.12985
Zhang, L., Zhao, Y., Hein-Griggs, D., Janes, T., Tucker, S., Ciborowski, J.J.H., 2020. Climate change projections of temperature and precipitation for the great lakes basin using the PRECIS regional climate model. J. Great Lakes Res. 46(2), 255-266. https://doi.org/10.1016/j.jglr.2020.01.013
Zhao, Q., Bai, J., Huang, L., Gu, B., Lu, Q., Gao, Z., 2016. A review of methodologies and success indicators for coastal wetland restoration. Ecol. Indic. 60, 442-460. https://doi.org/10.1016/j.ecolind.2015.07.003
Authors
Disclaimers
Any use of trade, firm, or product names is for descriptive purposes only and does not imply endorsement by the U.S. Government.
Although this information product, for the most part, is in the public domain, it also may contain copyrighted materials as noted in the text. Permission to reproduce copyrighted items must be secured from the copyright owner.
Suggested Citation
Kowalski, K., Bozimowski, A.A., Smith, M.K., Eggleston, M.R., Ramsay, M.F., and Eschenburg, H.J., 2026, Abundance and movement patterns of fish accessing a reconnected Lake Erie coastal wetland: Insights from high-resolution sonar data: Aquatic Ecosystem Health & Management, v. 28, no. 3, p. 66-85, https://doi.org/10.65087/aehm.028.03.6.
Study Area
| Publication type | Article |
|---|---|
| Publication Subtype | Journal Article |
| Title | Abundance and movement patterns of fish accessing a reconnected Lake Erie coastal wetland: Insights from high-resolution sonar data |
| Series title | Aquatic Ecosystem Health & Management |
| DOI | 10.65087/aehm.028.03.6 |
| Volume | 28 |
| Issue | 3 |
| Year Published | 2026 |
| Language | English |
| Publisher | BioOne |
| Contributing office(s) | Great Lakes Science Center |
| Description | 20 p. |
| First page | 66 |
| Last page | 85 |
| Country | United States |
| Other Geospatial | Lake Erie |