

Status of Public-Supply Water Sources in 2022 and the Development of a Geographic Information System Methodology for the Public Drinking Water Source Water Assessment Program in Tennessee
Links
- Document: Report (9.75 MB pdf) , HTML , XML
- NGMDB Index Page: National Geologic Map Database Index Page (html)
- Download citation as: RIS | Dublin Core
Background
In 2015, approximately 283 million people were served by public drinking water supplies across the United States, including more than 6 million in Tennessee (Dieter and others, 2018). Ensuring safe, clean drinking water not only is important for issues of human health and safety but also is a requirement of the Safe Drinking Water Act (SDWA) (42 U.S.C. 300(f)). The SDWA was established by the U.S. Environmental Protection Agency (EPA) in 1974 with amendments added in 1986 and 1996 that initiated programs to protect public-supply drinking water sources. States are required by the SDWA to establish Source Water Assessment Programs (SWAPs) that evaluate the vulnerability of public drinking water sources to contaminants that pose a threat to public health. The Tennessee Department of Environment and Conservation (TDEC) is the agency in the State of Tennessee with primacy that regulates the SWAP according to the SDWA requirements (TDEC, 2003). Tennessee is located in the Midsouth region of the contiguous United States and is made up of 95 counties divided into three separate regions called Grand Divisions (fig. 1). The Tennessee SWAP is intended to help communities in the State protect public-supply drinking water from contamination.
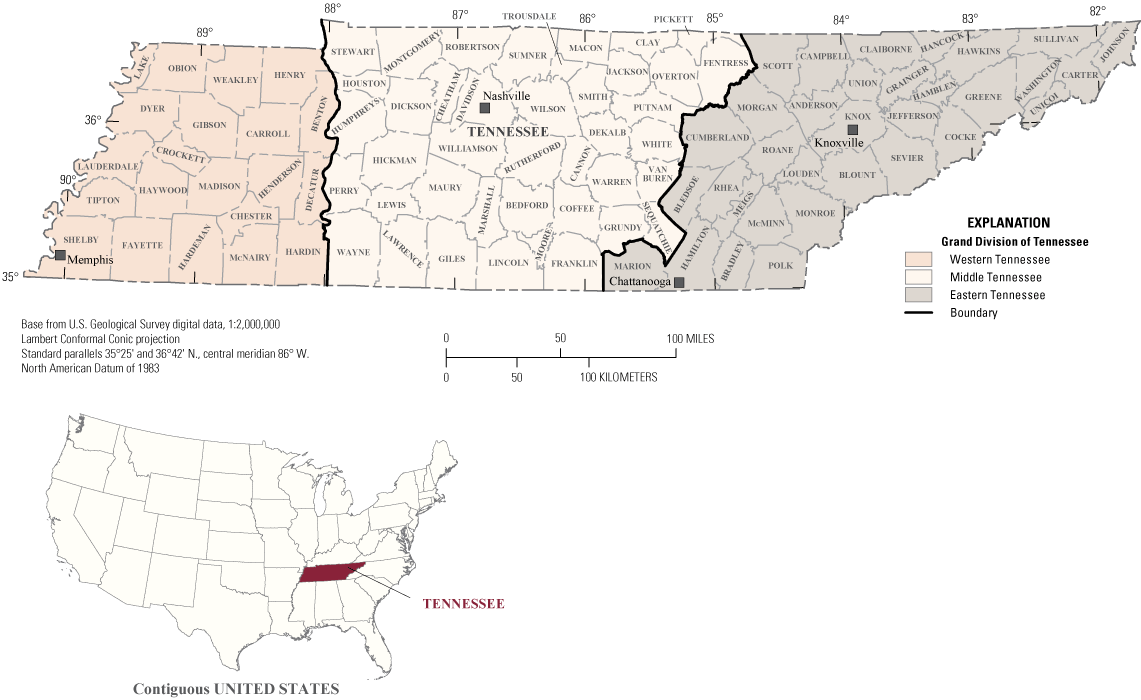
The Grand Divisions, counties, and major cities of Tennessee. Grand Divisions from Tennessee Code § 4–1–201 (Tennessee Code, 2021).
In 2021, TDEC and the U.S. Geological Survey (USGS) worked in cooperation to develop a geographic information system (GIS)-based methodology that systematically assesses the vulnerability of public-supply drinking water to potential contaminants consistent with the standards set forth in the Tennessee SWAP. The decision to update, improve, and automate the SWAP approach was made because the SWAP reports prepared by the public water systems that were developed using the initial assessment areas completed by TDEC in 2003 are inconsistent in format across different systems and are human resource intensive to review for inconsistencies. With an automated GIS approach, TDEC can consistently delineate source water assessment zones and evaluate source susceptibility on the basis of information such as the proximity of contaminant sources, land-use activities, geologic information, and additional environmental spatial data.
public supply Water withdrawn by public and private suppliers that provide water to at least 25 people or have a minimum of 15 service connections (USGS, 2019).
public water system A public or private utility or organization that provides water for human consumption through pipes or other constructed conveyances and has at least 15 service connections or serves at least 25 people per day for 60 days of the year (EPA, 2004).
The newly developed methodology—referred to as “TN-SWAPyT”—is built as an Esri ArcGIS Pro toolbox (Esri, 2022) and uses the Python programming language (Van Rossum and Drake, 2022) and the LaTeX document preparation system (LaTeX Project Team, 2020) to generate summary SWAP reports for public water systems across the State. The TN-SWAPyT methodology is designed to delineate assessment zones around public-supply sources, collate and map the potential contaminant sources in assessment zones, utilize digital datasets to rate the susceptibility of the sources to potential contaminants, and generate consistent reports that summarize the findings. A major benefit of the TN-SWAPyT methodology is to provide TDEC with consistent reports that can be used as a starting point for assessing public supplies. Communities and public water systems can then build upon these reports by using local knowledge and site-specific information.
Drinking Water Supplies in Tennessee
In 2015, approximately 91 percent of the population in Tennessee relied on public supplies as their primary source of drinking water, with the remaining 9 percent relying on domestic self-supplied groundwater wells (fig. 2) (Dieter and others, 2018). Approximately 850 million gallons per day of water was used for public supply in Tennessee in 2015 (fig. 3), which provides drinking water in addition to delivering water used for commercial, thermoelectric, irrigation, and industrial purposes (Dieter and others, 2018). The 2022 water-use data were obtained from TDEC, which regulates self-supplied industrial and public water system withdrawals and usage in Tennessee. The data are not available publicly owing to restrictions on releasing information pertaining to public-supply water sources and systems protected under the Tennessee Office of Homeland Security Critical Infrastructure Protection Program.3 As of June 2022, public-supply water was provided by 643 active public water systems across Tennessee that withdrew water for public use from 1,378 individual water sources. One public water system may include one or multiple individual water sources; for example, multiple wells, multiple surface-water intakes, or systems that use wells and surface-water intakes.
Contact TDEC (https://www.tn.gov/environment.html) or visit the Tennessee Office of Homeland Security Critical Infrastructure Protection Program website (https://www.tn.gov/safety/homeland-security/critical_infra.html) for additional information.
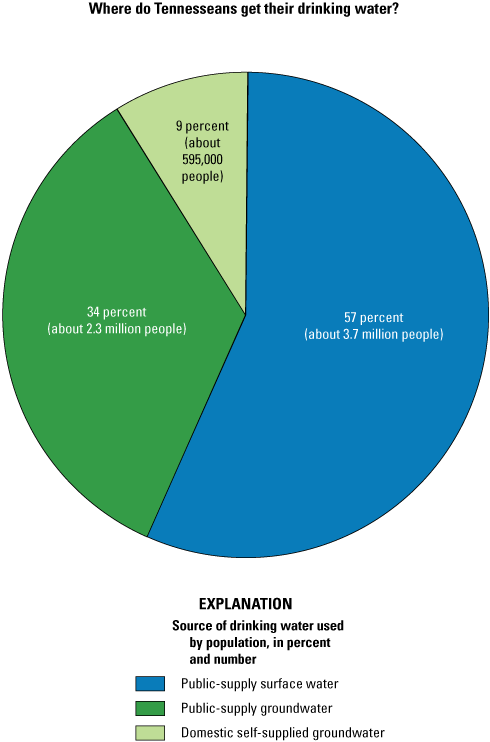
Proportion of the population in Tennessee using public-supply surface water or groundwater or domestic self-supplied groundwater as their primary drinking water source. Water-use data for 2015 from Dieter and others (2018).
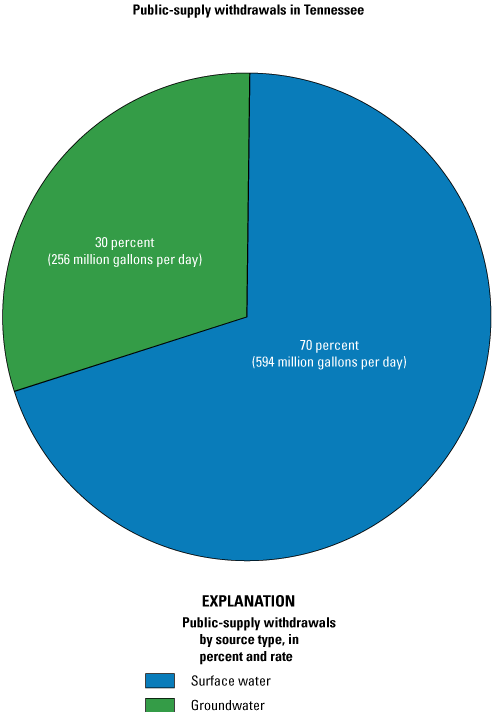
Proportion of public-supply withdrawals from surface-water or groundwater sources in Tennessee. Water-use data for 2015 from Dieter and others (2018).
In Tennessee, the types of sources for public supply include both groundwater (wells or springs) and surface water (surface-water intakes). Approximately 57 percent of the population is served by surface-water sources and the remaining 43 percent by groundwater sources, including groundwater from self-supplied domestic wells and from public supplies (fig. 2) (Dieter and others, 2018). The use of surface water versus groundwater varies across Tennessee, which is split into three Grand Divisions (eastern, middle, and western; fig. 1) that are formally defined by law and generally follow the geology of Tennessee (fig. 4) (Tennessee Code § 4–1–201; Tennessee Code, 2021). The predominant type of public-supply water source for people in western Tennessee is groundwater, and for middle Tennessee and eastern Tennessee it is surface water (figs. 5 and 6). This variation in public-supply water source is broadly controlled by the geology of Tennessee (fig. 4) and the resulting availability of water resources (Fenneman and Johnson, 1946; Bradley and Hollyday, 1985).
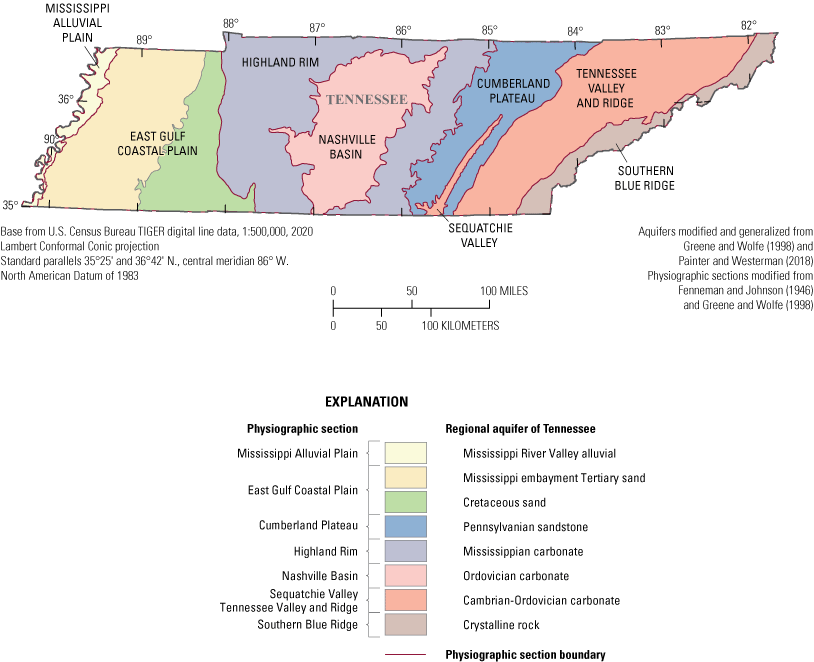
The physiographic sections and regional aquifers of Tennessee.

A, Surface-water and B, groundwater public-supply water use for Tennessee by county and locations of active public-supply sources and C, the bivariate comparison of surface-water and groundwater public-supply water use for Tennessee by county. County-level water-use data for 2015 from Dieter and others (2018); source data from Tennessee Department of Environment and Conservation (2003); Grand Divisions from Tennessee Code § 4–1–201 (Tennessee Code, 2021).
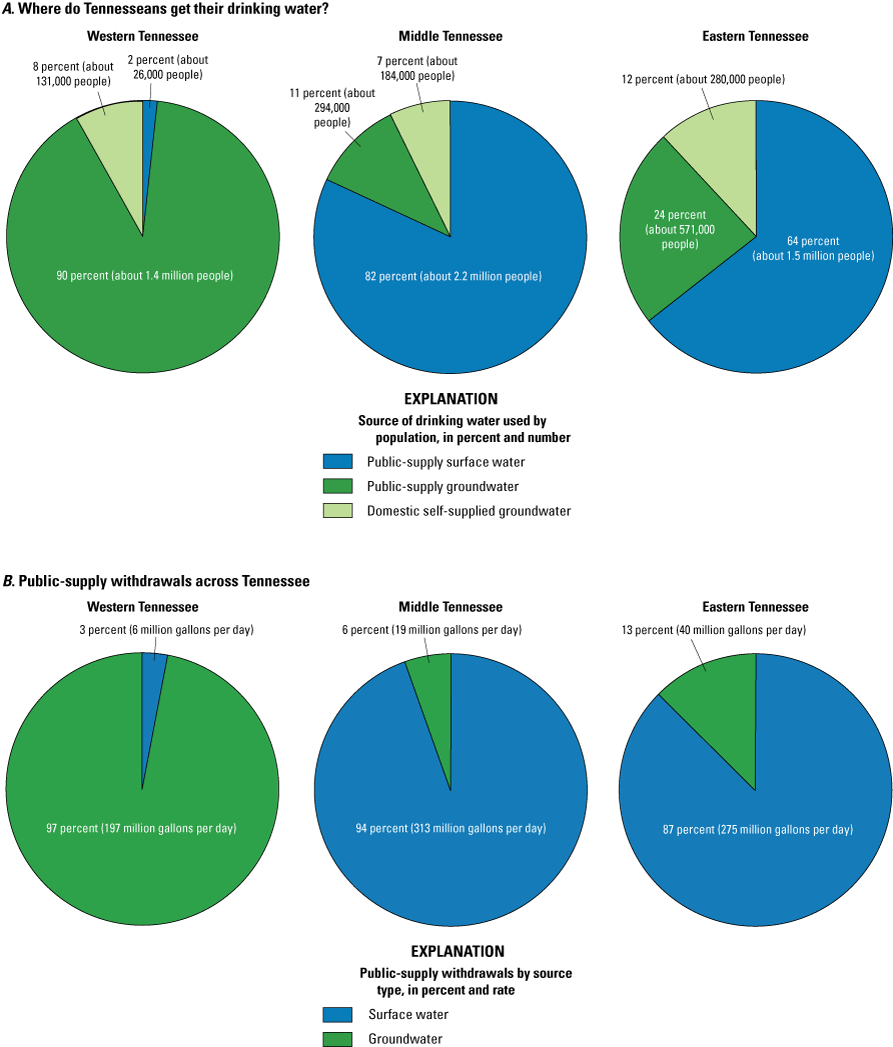
A, The proportion of the population reliant upon either public-supply surface water or groundwater or domestic self-supplied groundwater and B, the proportion of public-supply withdrawals from surface-water or groundwater sources in each Grand Division of Tennessee. County-level water-use data for 2015 from Dieter and others (2018); Grand Divisions from Tennessee Code § 4–1–201 (Tennessee Code, 2021).
Western Tennessee is dominated by unconsolidated and productive sandy aquifers of the Mississippi Alluvial Plain and East Gulf Coastal Plain physiographic sections (fig. 4) (Lloyd and Lyke, 1995). These sections include the regional aquifers of the Mississippi River Valley alluvial aquifer, the Mississippi embayment Tertiary sand aquifer, and the Cretaceous sand aquifer. Groundwater use is relatively high in western Tennessee compared to middle and eastern Tennessee (figs. 5B, C and 6A, B) (Dieter and others, 2018). Much of this groundwater use occurs in Shelby County, which includes the city of Memphis, in southwestern Tennessee (figs. 1 and 5B).
Middle Tennessee includes consolidated rock and karst aquifers—which are characterized by fractures, fissures, and sinkholes in carbonate rocks—of the Highland Rim and Nashville Basin physiographic sections (fig. 4) (Lloyd and Lyke, 1995). These sections include the Mississippian carbonate and Ordovician carbonate regional aquifers, although much of the area provides limited groundwater supplies to domestic wells, springs, and small public water systems. Groundwater use from both wells and springs does occur (fig. 5B), but a greater proportion of water for public supply is sourced from surface water in middle Tennessee than in western and eastern Tennessee (fig. 6B) (Dieter and others, 2018). Many of the public-supply surface-water withdrawals in middle Tennessee occur in Davidson County, which includes the city of Nashville and surrounding communities (figs. 1 and 5A).
Eastern Tennessee includes consolidated rock aquifers of the Cumberland Plateau, Tennessee Valley and Ridge, Sequatchie Valley, and Southern Blue Ridge physiographic sections (fig. 4), which are dominated by complex geology caused by folding and faulting (Lloyd and Lyke, 1995). The regional aquifers in these sections include the Pennsylvanian sandstone aquifer of the Cumberland Plateau, the Cambrian-Ordovician carbonate aquifer of the Tennessee Valley and Ridge and Sequatchie Valley, and the crystalline rock aquifer of the Southern Blue Ridge (fig. 4). In some areas, the complex geologic structure results in small well yields sufficient for only domestic supply; therefore, the proportion of self-supplied groundwater is greater in eastern Tennessee than in western and middle Tennessee (fig. 6A). Both surface-water and groundwater sources provide public-supply water in eastern Tennessee (fig. 5A, B), but most (87 percent) of the public supply is sourced from surface water (fig. 6B), which supplies much of the water to the cities of Chattanooga in Hamilton County and Knoxville in Knox County (figs. 1 and 5A) (Dieter and others, 2018).
alluvial aquifer “A water-bearing deposit of unconsolidated material (sand and gravel) left behind by a river or other flowing water” (USGS, 2013).
Tertiary “The Tertiary is a system of rocks, above the Cretaceous and below the Quaternary, that defines the Tertiary Period of geologic time. The Tertiary Period began about 66 million years ago with a mass extinction that ‘clocked’ the dinosaurs and ended when the ice ages of the Quaternary Period began, about 2.6 million years ago” (USGS, 2016).
Cretaceous The Cretaceous Period of geologic time began about 145 million years ago and ended about 66 million years ago (USGS Geologic Names Committee, 2018).
karst “A type of topography that results from dissolution and collapse of carbonate rocks such as limestone, dolomite, and gypsum, and that is characterized by closed depressions or sinkholes, caves, and underground drainage” (USGS, 2013).
Mississippian The Mississippian subperiod of the Carboniferous Period of geologic time began about 359 million years ago and ended about 323 million years ago (USGS Geologic Names Committee, 2018).
Ordovician The Ordovician Period of geologic time began about 485 million years ago and ended about 444 million years ago (USGS Geologic Names Committee, 2018).
Pennsylvanian The Pennsylvanian subperiod of the Carboniferous Period of geologic time began about 323 million years ago and ended about 299 million years ago (USGS Geologic Names Committee, 2018).
Cambrian The Cambrian Period of geologic time began about 541 million years ago and ended about 485 million years ago (USGS Geologic Names Committee, 2018).
Surface-Water Sources
Approximately 70 percent of the water used for public supply in Tennessee in 2015 was sourced from surface water (fig. 3), with about 3.7 million people served by this water (fig. 2) (Dieter and others, 2018). Surface water was sourced from 181 individual surface-water intakes as of 2022 (Annabelle Dempsey, TDEC, unpub. data, 2022). Of the 153 active public water systems relying on surface-water sources, 146 were community water systems, and 7 were noncommunity water systems. Surface water provides more than 80 percent of the public water supply in middle and eastern Tennessee (fig. 6B).
community water system “A public water system that serves the same people year round” (EPA, 2004, p. 1).
noncommunity water system “A public water system that serves the public but does not serve the same people year round” (EPA, 2004, p. 1).
Groundwater Sources
Approximately 30 percent of the water withdrawn for public supply in Tennessee in 2015 was sourced from groundwater (fig. 3), with about 2.3 million people served by this water (fig. 2) (Dieter and others, 2018). Another 595,000 people relied on domestic self-supplied groundwater, though these wells are not included in the SDWA or regulated by the Tennessee SWAP. Of the 490 active public water systems primarily utilizing groundwater sources in 2022, 183 were community water systems, and 307 were noncommunity water systems (Annabelle Dempsey, TDEC, unpub. data, 2022). Of the 1,197 individual groundwater sources, 127 are considered a special case of groundwater supply classified as groundwater under the influence of surface water, which includes 63 springs and 64 wells (fig. 5B). The remaining 1,070 groundwater sources are not under the direct influence of surface water. Groundwater use for public supply is higher in western Tennessee than in middle and eastern Tennessee (figs. 5B, C and 6B).
Assessment Zones
An assessment zone is the area around a public-supply water source that is inventoried for contaminant sources and evaluated for susceptibility to potential contamination (TDEC, 2003). These areas are delineated by different methods in the Tennessee SWAP depending on whether the source is surface water, groundwater, or groundwater under the influence of surface water.
Source Water Assessment Zones for Surface Water
Two zones—zone 1 and zone 2—are designated for each surface-water intake (fig. 7) (TDEC, 2003). Zone 1 is designated the “Critical Source Water Protection Zone” and encompasses an area 5 miles upstream and one-half mile downstream from the surface-water intake. Zone 1 includes tributaries to the stream with the surface-water intake and a survey corridor of 1,000 feet on either side of the stream and tributaries. Zone 2 is designated the “Source Water Management Zone” and includes the remainder of the area upstream, tributaries to the upstream area, and the 1,000-foot survey corridor within the watershed. Zone 2 is further divided into two zones, zone 2A and zone 2B. Zone 2A is defined as the area from 5 to 15 miles upstream from the intake, and zone 2B is defined as the area from 15 miles upstream from the intake to the upper end of the watershed. A few surface-water systems use multiple intakes along a water body and are classified as a consolidated assessment zone. For surface-water sources with very small watersheds, wherein the contributing stream may not reach 5 miles upstream, the streams and tributaries and the 1,000-foot survey corridor within the watershed are included in assessment zone 1. Figure 8A shows the cumulative (zones 1 and 2) delineated assessment zones originally created by TDEC in 2003 for surface-water intakes.

A simulated surface-water assessment zone illustrating the Critical Source Water Protection Zone (zone 1) and the Source Water Management Zones (zones 2A and 2B) for Tennessee. Zones delineated in accordance with Tennessee Department of Environment and Conservation Source Water Assessment Program regulations (Tennessee Department of Environment and Conservation, 2003).
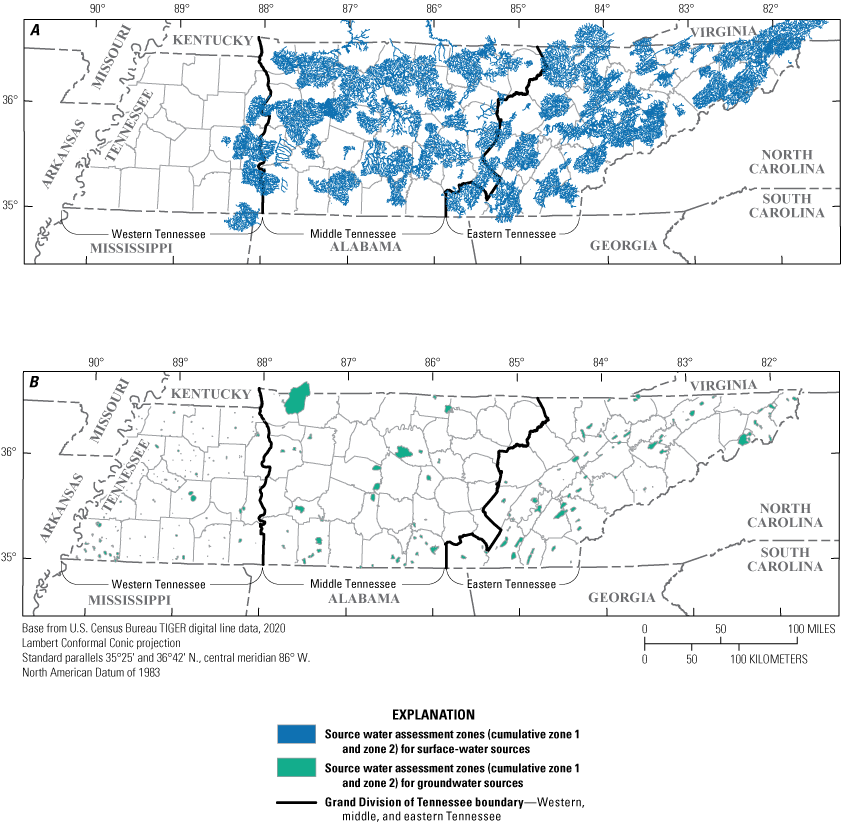
The cumulative delineated assessment zones for A, surface-water sources and B, groundwater sources in Tennessee in 2003 (Tennessee Department of Environment and Conservation, 2003). Grand Divisions from Tennessee Code § 4–1–201 (Tennessee Code, 2021).
Source Water Assessment Zones for Groundwater
Contaminant transport is different in groundwater than in surface water and is controlled by hydrogeologic factors (such as aquifer transmissivity and anisotropy) and withdrawal rates (Lloyd and Lyke, 1995). In areas where the delineation between surface water and groundwater is less distinct, such as karst aquifers or other aquifers wherein groundwater is under the influence of surface water, the effects of withdrawal rates on contaminant transport are less clear. However, quantifying hydrogeologic properties can provide detailed information for developing appropriately protective assessment zones for groundwater sources.
aquifer transmissivity The capacity of an aquifer to transmit water is characterized by the rate at which water of prevailing kinematic viscosity is transmitted through a unit width of aquifer under a unit hydraulic gradient. The transmissivity of an aquifer is equal to the hydraulic conductivity of the aquifer multiplied by the saturated thickness of the aquifer (Lohman, 1972; Heath, 1983).
aquifer anisotropy In anisotropic aquifers, the hydraulic conductivity is different for flow in the horizontal and vertical directions, as opposed to isotropic aquifers, wherein hydraulic conductivity is the same in all directions (Heath, 1983).
In Tennessee, assessment zones are delineated for both types of groundwater sources, wells and springs, by using the location of the wellhead, which is the point near the surface where groundwater exits from the well or spring and is collected for use. Source water assessment zones, often referred to as “wellhead assessment zones,” are established for two zones of protection—zone 1, the “Critical Source Water Protection Zone,” and zone 2, the “Source Water Management Zone,” also referred to as the “Wellhead Management Zone” (fig. 9). Zone 1 is proximal to the source (well or spring), is intended to protect the immediate area from spills and other point sources of contaminants, and is a fixed radius around the wellhead or spring source. The radius, ranging from 250 to 750 feet, is dependent on the number of service connections and the average daily withdrawal rate but may be further refined by public water systems to reflect the hydrogeologic conditions of each individual source. Zone 2 is intended to provide for long-term management of the well, wellfield, or spring considering the wide variety of geologic conditions across Tennessee. The size and shape of zone 2 are developed by the public water system or the State through a variety of hydrogeologic assessment approaches including dye tracing, analysis of topography, and flow modeling to determine the recharge area of the well or spring. Additional work to delineate zone 2 is performed for the public water systems using groundwater under the influence of surface water. Figure 8B shows cumulative assessment zones delineated for public water systems reliant on groundwater.
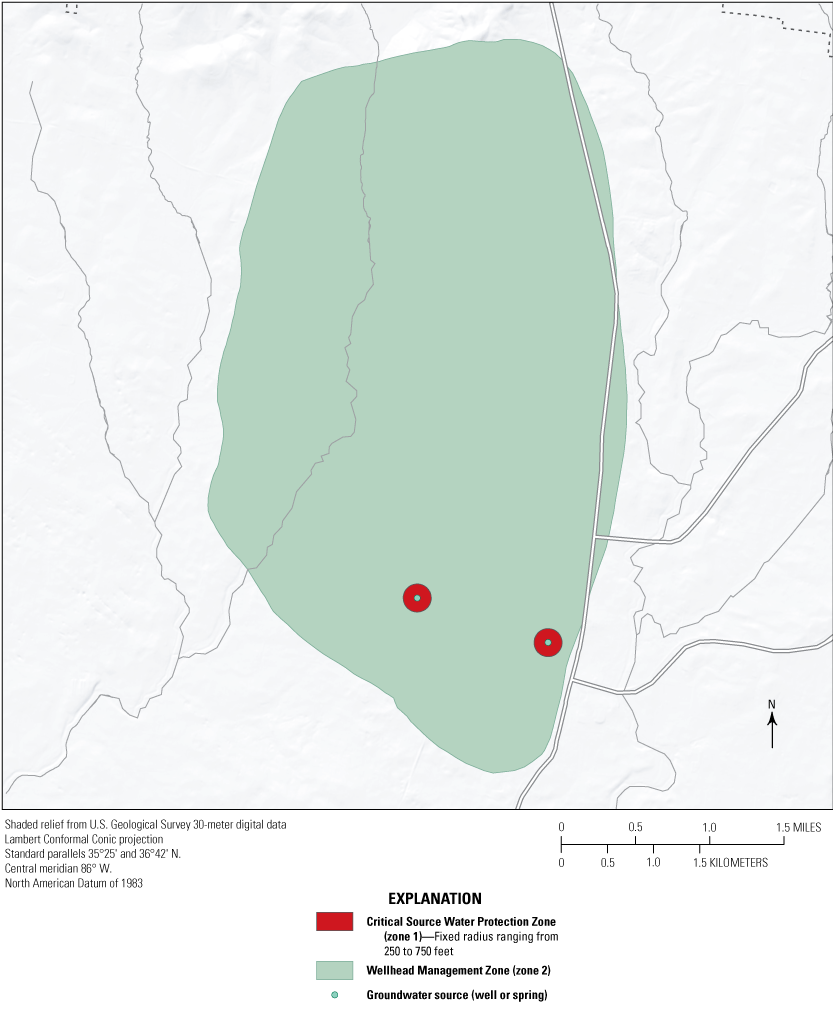
Conceptual groundwater assessment zones illustrating the Critical Source Water Protection Zone (zone 1) and the Source Water Management Zone, also referred to as the “Wellhead Management Zone” (zone 2), for Tennessee.
TN-SWAPyT Methodology
The TN-SWAPyT methodology allows TDEC to consistently and automatically generate summary assessment reports for the 643 active public water systems across Tennessee. To protect the security of the public-supply source data, the TN-SWAPyT toolbox and inputs are required by the State to remain proprietary and will not be publicly available. The methodology fits into the TDEC SWAP cycle (fig. 10) and follows a multistep process to meet the TDEC SWAP requirements by leveraging a custom Esri ArcGIS Pro Toolbox (Esri, 2022) created using Python open-source scripting language (Van Rossum and Drake, 2022), which allows TDEC to follow logical steps in a GIS. The methodology also leverages Python with LaTeX (LaTeX Project Team, 2020) to query information from various sources and prepare a report that is consistent for all public water systems in the State. The methodology is intended to be robust, reproducible, and capable of handling errors from missing data or incorrect information in input datasets. The methodology can also incorporate data from adjoining States as needed for assessment zones that cross State lines (for example, fig. 8). Additionally, the input datasets can be updated as new information is made available. Key components of the development of the TN-SWAPyT methodology include designing, creating, and analyzing the following databases or datasets:
-
• Public drinking water system database: database of TDEC public drinking water systems and sources, which is maintained by TDEC and the EPA via the Safe Drinking Water Information System (https://www.epa.gov/ground-water-and-drinking-water/safe-drinking-water-information-system-sdwis-federal-reporting).
-
• Surface-water assessment zone database: database of assessment zones for surface-water intakes, which uses the National Hydrography Dataset Plus High Resolution (NHDPlus HR) dataset (USGS, 2017) to delineate assessment zones according to TDEC regulations.
-
• Wellhead assessment zone database: database of Source Water Management Zones (zone 2) for groundwater sources, which are defined by public water systems; the Critical Source Water Protection Zones (zone 1) are delineated using the locations of wells and springs. This database is maintained by TDEC.
-
• Potential contaminant source database: database of contaminant sources, such as locations of underground storage tanks, brownfield and Superfund sites, sites under the supervision of the TDEC Division of Remediation, permitted wastewater discharges, and impacted streams. These datasets are maintained by the EPA and TDEC. The TN-SWAPyT methodology automatically inventories the potential contaminant sources within the assessment zone of each water source.
-
• Datasets that describe environmental characteristics of the assessment area: Publicly available GIS datasets of land use, population, soils, geology, or other environmental characteristics that may affect source water quality; these datasets can be used to assess the susceptibility of the public-supply source water to contamination.

The TN-SWAPyT methodology, developed in cooperation between the U.S. Geological Survey and the Tennessee Department of Environment and Conservation, and how it fits into the overall Surface Water Assessment Program for the State of Tennessee to consistently and automatically generate summary assessment reports for the 643 active public water systems across the State. TN-SWAPyT, Tennessee (TN) Department of Environment and Conservation Source Water Assessment Program (SWAP) methodology using Python (PyT) open-source scripting language.
The TN-SWAPyT methodology supports stakeholders, water managers, and TDEC because it increases the ability to (1) delineate and inventory source water assessment zones through consistent and reproducible methods, (2) identify potential contaminants relevant to public water systems across the State, and (3) understand the influence of environmental characteristics on the vulnerability of public drinking water sources to potential contamination. TN-SWAPyT provides the public with a consistent methodology for how requirements of the SWAP are implemented to create public-supply source water assessments in Tennessee.
References Cited
Bradley, M.W., and Hollyday, E.F., 1985, Tennessee ground-water resources, in National water summary 1984—Hydrologic events, selected water-quality trends, and ground-water resources: U.S. Geological Survey Water-Supply Paper 2275, p. 391–396, accessed April 13, 2023, at https://doi.org/10.3133/wsp2275.
Dieter, C.A., Linsey, K.S., Caldwell, R.R., Harris, M.A., Ivahnenko, T.I., Lovelace, J.K., Maupin, M.A., and Barber, N.L., 2018, Estimated use of water in the United States county-level data for 2015 (ver. 2): U.S. Geological Survey data release, accessed April 20, 2022, at https://doi.org/10.5066/F7TB15V5.
Esri, 2022, ArcGIS Pro 3.0: Redlands, Calif., Esri software release, accessed January 17, 2023, at https://pro.arcgis.com/en/pro-app/3.0/get-started/install-and-sign-in-to-arcgis-pro.htm.
Fenneman, N.M., and Johnson, D.W., 1946, Physical divisions of the United States: Washington, D.C., U.S. Geological Survey, 1 plate, 1:7,000,000 scale, accessed February 17, 2023, at https://pubs.usgs.gov/publication/70207506.
Greene, D.J., and Wolfe, W.J., 1998, Superfund GIS—Physiographic provinces, aquifer outcrops and recharge rates in Tennessee: U.S. Geological Survey dataset, accessed April 13, 2023, at https://doi.org/10.3133/70046038.
Heath, R.C., 1983, Basic ground-water hydrology: U.S. Geological Survey Water-Supply Paper 2220, 91 p. [Also available at https://doi.org/10.3133/wsp2220.]
LaTeX Project Team, 2020, LaTeX 2ε for authors: LaTeX Project Team, 24 p., accessed May 18, 2022, at https://www.latex-project.org/help/documentation/usrguide.pdf.
Lloyd, O.B., and Lyke, W.L., 1995, Ground water atlas of the United States—Segment 10, Illinois, Indiana, Kentucky, Ohio, Tennessee: U.S. Geological Survey Hydrologic Atlas 730–K, 30 p. [Also available at https://doi.org/10.3133/ha730K.]
Lohman, S.W., 1972, Definitions of selected ground-water terms, revisions and conceptual refinements: U.S. Geological Survey Water-Supply Paper 1988, 21 p. [Also available at https://doi.org/10.3133/wsp1988.]
Painter, J.A., and Westerman, D.A., 2018, Mississippi Alluvial Plain extent, November 2017: U.S. Geological Survey data release, accessed April 13, 2023, at https://doi.org/10.5066/F70R9NMJ.
Tennessee Code, 2021, Grand Divisions and State capital—Annotated title 4, chap. 1, pt. 2 of Tennessee Code: Tennessee Code Commission, accessed January 19, 2023, at https://www.tncourts.gov/Tennessee%20Code.
Tennessee Department of Environment and Conservation [TDEC], 2003, Tennessee source water assessment report August 2003: Tennessee Department of Environment and Conservation, Division of Water Resources, 85 p., accessed May 11, 2022, at https://www.tn.gov/content/dam/tn/environment/documents/source_water_assessment_epa_report_aug_2003.pdf.
U.S. Environmental Protection Agency [EPA], 2004, Understanding the Safe Drinking Water Act: U.S. Environmental Protection Agency, EPA 816–F–04–030 June 2004, 4 p., accessed May 11, 2022, at https://www.epa.gov/sites/default/files/2015-04/documents/epa816f04030.pdf.
U.S. Geological Survey [USGS], 2013, Water basics glossary: U.S. Geological Survey web page, accessed June 21, 2023, at https://water.usgs.gov/water-basics_glossary.html.
U.S. Geological Survey [USGS], 2016, EarthWord – Tertiary: U.S. Geological Survey web page, accessed June 21, 2023, at https://www.usgs.gov/communications-and-publishing/news/earthword-tertiary.
U.S. Geological Survey [USGS], 2017, National Hydrography Dataset Plus High Resolution (NHDPlus HR)—USGS National Map downloadable data collection: U.S. Geological Survey database, accessed May 18, 2022, at https://www.sciencebase.gov/catalog/item/57645ff2e4b07657d19ba8e8.
U.S. Geological Survey [USGS] Geologic Names Committee, 2018, Divisions of geologic time—Major chronostratigraphic and geochronologic units: U.S. Geological Survey Fact Sheet 2018–3054, 2 p. [Also available at https://doi.org/10.3133/fs20183054.]
U.S. Geological Survey [USGS], 2019, Public supply water use: U.S. Geological Survey web page, accessed July 26, 2024, at https://www.usgs.gov/mission-areas/water-resources/science/public-supply-water-use.
Van Rossum, G., and Drake, F.L., 2022, The Python language reference—Documentation 3.10.4: Python Software Foundation website, accessed May 18, 2022, at https://docs.python.org/3/reference/index.html.
For more information about this publication, contact
Director, Lower Mississippi-Gulf Water Science Center
U.S. Geological Survey
640 Grassmere Park, Suite 100
Nashville, TN 37211
For additional information, visit
https://www.usgs.gov/centers/lmg-water/
Publishing support provided by
Lafayette Publishing Service Center
Disclaimers
Any use of trade, firm, or product names is for descriptive purposes only and does not imply endorsement by the U.S. Government.
Although this information product, for the most part, is in the public domain, it also may contain copyrighted materials as noted in the text. Permission to reproduce copyrighted items must be secured from the copyright owner.
Suggested Citation
Ransom, R.K., Knierim, K.J., Ladd, D., Ham, B., and Dempsey, A., 2024, Status of public-supply water sources in 2022 and the development of a geographic information system methodology for the Public Drinking Water Source Water Assessment Program in Tennessee: U.S. Geological Survey Circular 1522, 14 p., https://doi.org/10.3133/cir1522.
ISSN: 2330-5703 (online)
Study Area
| Publication type | Report |
|---|---|
| Publication Subtype | USGS Numbered Series |
| Title | Status of public-supply water sources in 2022 and the development of a geographic information system methodology for the Public Drinking Water Source Water Assessment Program in Tennessee |
| Series title | Circular |
| Series number | 1522 |
| DOI | 10.3133/cir1522 |
| Publication Date | December 18, 2024 |
| Year Published | 2024 |
| Language | English |
| Publisher | U.S. Geological Survey |
| Publisher location | Reston, VA |
| Contributing office(s) | Lower Mississippi-Gulf Water Science Center |
| Description | iv, 14 p. |
| Country | United States |
| State | Tennessee |
| Online Only (Y/N) | Y |