

An Interagency Perspective on Improving Consistency and Transparency of Land Use and Land Cover Mapping
Links
- Document: Report (9.6 MB pdf) , HTML , XML
- NGMDB Index Page: National Geologic Map Database Index Page (html)
- Download citation as: RIS | Dublin Core
Executive Summary
Geospatial products of land use and land cover are broadly used in many applications. For example, the annual national greenhouse gas inventory uses the National Land Cover Database, the Coastal Change Analysis Program, Landscape Fire and Resource Management Planning Tools, the Forest Inventory and Analysis, and the National Resources Inventory to represent the land use and management base of the United States and attribute sources and sinks of greenhouse gas emissions. Federally produced land use and land cover datasets for the United States, including those from the Multi-Resolution Land Characteristics Consortium, set the foundation for developing and informing applications such as land change, conservation, greenhouse gas monitoring, urban planning, agricultural production, ecosystem functions, and water quantity and use. No single land use and land cover product is optimal for all land use and land cover applications. Approaches for defining and mapping land use and land cover classes differ across Federal map products, reflecting the tailoring of product specifications to match specific agency needs. These differing approaches present a challenge when attempting to integrate and harmonize multiple land use and land cover products into single analysis or application frameworks. Nuanced understanding of how these products are designed and produced may not be immediately evident to users; however, the availability of a diverse suite of products also represents an opportunity, providing multiple approaches for observing landscape change. In response to the National Strategy to Advance an Integrated U.S. Greenhouse Gas Measurement, Monitoring, and Information System, this Multi-Resolution Land Characteristics Consortium-led interagency report presents (1) the current status of U.S. Federal land use and land cover products (as of May 2024), (2) existing synergies and integration among these federally produced land use and land cover products, (3) inherent challenges of creating a single consistent framework, and (4) strategies for collectively tackling these challenges to improve coordination and collaboration among data producers and facilitate the adoption of land use and land cover products for greenhouse gas monitoring and a variety of other applications.
Introduction
Geospatial products of land use and land cover are broadly used in many applications. The Multi-Resolution Land Characteristics (MRLC) Consortium, a group of Federal agencies with a common need for remote sensing data and derivative products, have developed a suite of a geospatial land use and land cover products, with broad use across a variety of applications. Increasingly, other Federal and non-Federal entities have produced additional land use and land cover datasets. With different mapping methodologies, thematic legends and definitions, and intended purposes, the broad array of available products can cause confusion in the user community. This document provides (1) the current status of U.S. Federal land use and land cover products (as of May 2024), (2) existing synergies and integration among these federally produced land use and land cover products, (3) inherent challenges of creating a single consistent framework, and (4) strategies for collectively tackling these challenges to improve coordination and collaboration among data producers and facilitate the adoption of land use and land cover products for greenhouse gas monitoring and a variety of other applications.
Definition of Land Use and Land Cover
Land use and land cover information is foundational to many applications. Products described in this report include the mapping and monitoring of land use and land cover. Land use describes human activities and management of the land, such as mining, recreation, or cropland, and land cover describes a physical feature on the land, such as water or pavement. Land use and land cover categories can be thought of as a Venn diagram with considerable, but not complete, overlap among the two paradigms. For example, trees are a land cover but not a land use. Tree cover can be detected on more than one land use, such as in a small city park (developed land use) or in a forest plantation (forestry land use). In practice, most land use and land cover maps are a blend of land use and land cover because the two concepts overlap considerably. From a practical standpoint, land use is difficult to discern from imagery alone unless contextual information, such as human activities or land management practices, is available. Depending on the application, blending or distinguishing between land use and land cover can result in a more informative dataset. For example, for a biodiversity assessment in forested lands, a land cover product that represents vegetation cover (for example, a recently clear-cut forest with its vegetation cover such as grass or shrub) may be preferred, but for an economic application, a land use product that represents activities for active timber or forest management may be preferred. As noted throughout this report, there generally is no one right answer to land use and land cover mapping given the diversity of applications.
Multi-Resolution Land Characteristics Consortium
The Multi-Resolution Land Characteristics (MRLC) Consortium grew out of the Landsat Commercialization Act of 1984 (Goward and others, 2017). The initial objective of the MRLC Consortium was pooling resources among participating Federal agencies to purchase a national Landsat dataset that could be used by each member to meet agency land cover mapping needs. Over time, members recognized the advantages of extending the concept of sharing and pooling data into a culture of collaboration while still meeting individual agency land use and land cover needs (Wickham and others, 2014). This collaboration has included a coordination of mapping efforts that has resulted in improved consistency across products and reduced duplication of effort and resultant cost savings. The MRLC matured into a consortium with members from more than 10 Federal agencies, generating cross-agency coproduced data products and 7 integrated map-based databases within an operational framework.
The MRLC’s operational nature applies to all MRLC products. Operational programs are characterized by continuous support with periodic product updates, institutional support, well-defined objectives, stakeholders, users, deliverables with articulated timelines, and programmatic efforts dedicated to product improvement (Hansen and Loveland, 2012). In contrast, research-oriented programs tend to be one-off efforts that lack systematic documentation, long-term consistency, and continuity. The operational nature of the programs underpinning MRLC products is important to each being recognized as a National Geospatial Data Asset (NGDA) by the Federal Geographic Data Committee (FGDC).
The Federal Geographic Data Committee
The FGDC was formed in 1990 by the Office of Management and Budget to provide executive, managerial, and advisory direction and oversight for Federal geospatial decisions and initiatives. The FGDC supports interagency coordination and planning of 18 themes or organizational groups, including land use and land cover. Each theme is composed of NGDAs, which are geospatial datasets that are considered foundational to the Nation’s ability to efficiently support national priorities and government missions (table 1). The MRLC Consortium consists of most datasets under the land use and land cover theme. Not all MRLC geospatial products are identified as NGDAs, yet these other products provide valuable and complementary information on U.S. land use and land cover and land use and land cover change.
Table 1.
Land use and land cover themed National Geospatial Data Asset datasets.[NGDA, National Geospatial Data Asset; ID, identifier; LANDFIRE, Landscape Fire and Resource Management Planning Tools; NLCD, National Land Cover Database; CONUS, conterminous United States]
Other Federal Geospatial Assets
MRLC partner agencies also produce other geospatial information on U.S. land use and land cover and land use and land cover change products that are not typically considered part of core MRLC activities. These products provide additional information on U.S. land change and are often used as key data sources for generating core MRLC geospatial products. Most notably, these products include a suite of Federal inventory data outlined in the “National Federal Inventory Datasets” section, including sample-based inventories that provide federally supported, long-term assessments of U.S. land use and land cover change. In addition to the land use and land cover theme under the NGDA, other Federal datasets such as the National Wetlands Inventory (NWI) under the water/inland theme provide wetland information as an NGDA dataset (refer to the “National Federal Inventory Datasets” section).
General Use of Land Use and Land Cover Products
The extensive use of U.S. Federal land use and land cover products (for example, MRLC products, survey-based inventory data, and other Federal data) is attributable to the breadth of land use and land cover information provided, ranging from detailed thematic datasets of vegetation and cropland types to generalized land cover, to continuous percentage of impervious cover, tree canopy density, and shrub, grass, and bare ground cover (Wickham and others, 2014). All MRLC products provide periodic updates, and frequencies range from annual to every 5 years (“Multi-Resolution Land Characteristics Map-Based Products” section). Federally produced survey-based inventory data on targeted land cover and land use types also provide periodic updates and long-term data records while reciprocally supporting MRLC products (“National Federal Inventory Datasets” section).
Federal land use and land cover data have been instrumental in a wide range of applications, from assessing risks in insurance to tracking disease patterns in epidemiology. These data support U.S. greenhouse gas emission estimates reported to the United Nations Framework Convention on Climate Change (U.S. Environmental Protection Agency, 2024). MRLC data are foundational for source water assessments mandated under the Safe Drinking Water Act (Public Law 104–182) and the modeling necessary for compliance with the Clean Water Act (Public Law 107–303). MRLC data are used in ongoing and periodic evaluation of the intersection among U.S. biofuels policy, rural development, and land use effects (Austin and others, 2022; Lark and others, 2022). MRLC and Federal inventory data enable reporting on the status, trends, and projected futures of the Nation’s renewable resources on all forests and rangelands under the Forest and Rangeland Renewable Resources Planning Act of 1974 (Public Law 93–378; Forest Service, 2023). MRLC data are also incorporated into web-based applications for evaluating sea level rise and improving modeled predictions of hurricane storm surge (National Oceanic and Atmospheric Administration, 2024a, c). These coastal applications of MRLC have a strong community engagement and support focus. Similarly, the fireshed registry (Ager and others, 2021)—an online mapping and risk management geospatial portal—uses MRLC data to help communities understand future wildfire risks. Another national-scope yet community-oriented and policy-focused application of MRLC data is evaluating spatial patterns of environmental equity across the United States (Reid and others, 2009; Jesdale and others, 2013).
Purpose and Scope
This MRLC-led report provides the current status (May 2024) of national land use and land cover products, including MRLC, and other Federal and non-Federal land use and land cover products. This report provides context for existing product definitions, use, applications, and synergies among these Federal products. Given the wide array of potential applications with different requirements for land use and land cover and land use and land cover change data, this report does not contain an exhaustive comparison of all land use and land cover products, nor does it provide a recommendation for a single land use and land cover map product to fit all broad land use and land cover application purposes. Instead, this report contains comparisons and contrasts of many U.S. Federal land use and land cover products and identifies challenges and opportunities to improve coordination and transparency across these products for user community adoption.
Current State of Land Cover and Land Use Products (May 2024)
A variety of MRLC-produced data, other Federal data, and non-Federal data are available for characterizing U.S. land cover and land use. Here we provide a descriptions of major publicly available land cover and land use products for the United States.
Multi-Resolution Land Characteristics Map-Based Products
MRLC geospatial land use and land cover datasets serve as a foundation for national-scale change monitoring to inform governmental policies and contribute to technical reports from Federal, State, and local agencies by serving needs of governmental agencies, nongovernmental institutions, academia, private companies, and the public. MRLC products rely on consistent long-term science-quality data such as the Landsat satellites and national statistical inventories to produce consistent national-scale continuous monitoring of the Nation’s landscapes (table 2). Because of the scientific rigor and quality assurance, through systematic validation and accuracy assessment, MRLC products are included in the FGDC-designated NGDA portfolio as trusted geospatial information sources for the Nation (table 1).
Table 2.
Summary of land cover and land use products (as of May 2024).[FGDC, Federal Geographic Data Committee; NGDA, National Geospatial Data Asset; m, meter; NLCD, National Land Cover Database; CONUS, conterminous United States; USGS, U.S. Geological Survey; %, percent; SE, southeast; AK, Alaska; HI, Hawaii; PR, Puerto Rico; U.S. VI, U.S. Virgin Islands; MRLC, Multi-Resolution Land Characteristics; FS, Forest Service; LCMAP, Land Change Monitoring, Assessment, and Projection; EROS, Earth Resources Observation and Science Center; C–CAP, Coastal Change Analysis Program; NOAA, National Oceanic and Atmospheric Administration; Ins., insular; lidar, light detection and ranging; CDL, Cropland Data Layer; USDA, U.S. Department of Agriculture; NASS, National Agricultural Statistics Service; ISRO, Indian Institute of Remote Sensing; LANDFIRE, Landscape Fire and Resource Management Planning Tools; EVT, Existing Vegetation Type; ES, Ecological Systems; DOI, Department of the Interior; NVC, National Vegetation Classification; EVH, Existing Vegetation Height; HLS, Harmonized Landsat and Sentinel-2; EVC, Existing Vegetation Cover; ESP, Environmental Site Potential; FCC, Forest Canopy Cover; FRG, Fire Regime Groups; FCCS, Fuel Characteristic Classification System; LCMS, Landscape Change Monitoring System; LC, Land Cover; LU, Land Use; RCMAP, Rangeland Condition Monitoring Assessment and Projection; BLM, Bureau of Land Management; NWI, National Wetlands Inventory; ≤, less than or equal to; present, May 2024; FWS, U.S. Fish and Wildlife Service; NAIP, National Agriculture Imagery Program; FIA, Forest Inventory and Analysis; ha, hectare; NRCS, Natural Resources Conservation Service; NRI, National Resources Inventory; >, greater than; AIM, Assessment, Inventory, and Monitoring; ~, about; NA, no data or not applicable; ESA, European Space Agency; RAP, Rangeland Analysis Platform; ARS, Agricultural Research Service; NRT, near real time; WRI, World Resources Institute; GLAD, Global Land Analysis and Discovery; UMD, University of Maryland; GEDI, Global Ecosystem Dynamics Investigation]
National Land Cover Database
The National Land Cover Database (NLCD) (an NGDA) represents more than 20 years of interagency partnerships and 30 years of producing land cover products (fig. 1). The U.S. Geological Survey (USGS) Earth Resources and Observation Science Center is central to the creation of the NLCD, which is updated every 2 to 3 years and stands as the definitive land cover database for the United States. The NLCD published its initial release as the first of its kind nationwide assessment of land cover at a 30-meter resolution, based on Landsat imagery from 1992 (table 2). This first NLCD land cover release (Vogelmann and others, 2001) was based on the Anderson classification system (Anderson and others, 1976), a system that emphasized land use and land cover. In 2001, the NLCD slightly modified this classification framework to move away from land use and towards land cover definitions that can be more easily and consistently monitored using remote-sensing data. These updated definitions were adopted by other MRLC Consortium members, highlighting the consortium’s strengths in interagency collaboration, knowledge integration, cost sharing, and reproducibility.
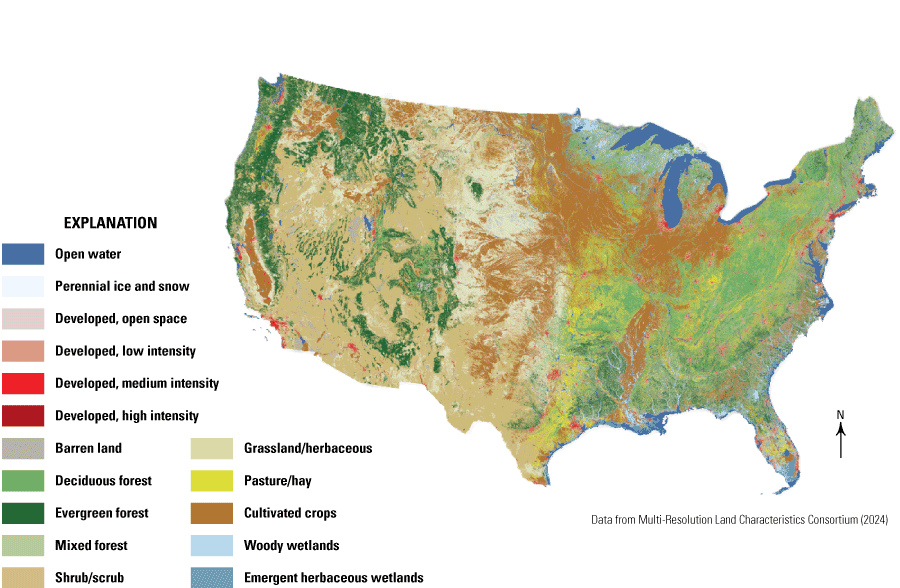
Map showing National Land Cover Database land cover types for the conterminous United States, 2021 (Multi-Resolution Land Characteristics Consortium, 2024).
Fractional components created for developed impervious surface and tree canopy cover complement the thematic land cover definitions. These fractional components provide information for calculations of surface runoff, canopy density and structure, and urban developed and forest interfaces, as well as many other applications. In 2011, the Forest Service (FS) began production of percentage tree canopy cover data, which were incorporated into the NLCD product suite, using training data from the Forest Inventory and Analysis (FIA) program. These updated continuous field data products categorize forest canopy from 0 to 100 percent and allow users to set forest threshold definitions that best suit their application.
Since the release of NLCD 2001, imperviousness became a foundational variable in the NLCD product suite, summarizing the percentage of impervious cover within each 30-meter Landsat pixel. The NLCD 2016 release also included a new product called the impervious descriptor. This product complements the impervious surface estimates by labeling developed features as different road types, urban types, wind and fossil energy uses, and other descriptors that provide users with even more information for discriminating land use and land cover types. Advances in change and classification methodology increased land cover and impervious publication update frequency from 5 years to 2 to 3 years in 2016, and annual releases are being planned from 2024 forward. When used together, NLCD thematic and fractional cover products can provide unmatched insight into the nuances of U.S. landscape change. NLCD’s merger with another USGS land-change product—Land Change Monitoring, Assessment, and Projection (LCMAP)—in 2024 can be used to expand product coverage to nearly 40 years using the full Landsat record (Multi-Resolution Land Characteristics Consortium, 2024).
Land Change Monitoring, Assessment, and Projection
In 2019, the USGS developed and implemented the LCMAP project (https://www.usgs.gov/special-topics/lcmap), an annual land cover monitoring capability primarily based on Landsat satellite observations. The LCMAP product suite consists of 10 annual land cover and related image products for the conterminous United States and Hawaii (fig. 2A–J). These products have a 30-meter spatial resolution and annual periodicity and cover the period from 1985 to 2021 over the conterminous United States and the period from 2000 to 2021 over Hawaii (table 2). LCMAP is produced using an integrated change-detection methodology based on harmonic modeling and image classification using machine learning elements (Zhu and Woodcock, 2014; Brown and others, 2020; Li and others, 2022; Xian and others, 2022). The primary input data consist of the full Landsat record (from Landsat 4 through Landsat 8) reformulated into a well-calibrated data cube—the U.S. Landsat Analysis Ready Data (Dwyer and others, 2018). This monitoring approach can detect multiple types of land surface dynamics including abrupt and gradual changes in land cover state and land cover condition and represents the longest continuous and consistently processed time-series representation of land cover and change for the conterminous United States (37 years; U.S. Geological Survey, 2022a) and for Hawaii (21 years; U.S. Geological Survey, 2022b). The average annual overall accuracies for the most recent LCMAP land cover were 82.5 percent over the conterminous United States (Collection 1.3, 1985–2021) and 83.4 percent for Hawaii (Collection 1.0, 2000–19) (Pengra and others, 2022, 2023b).
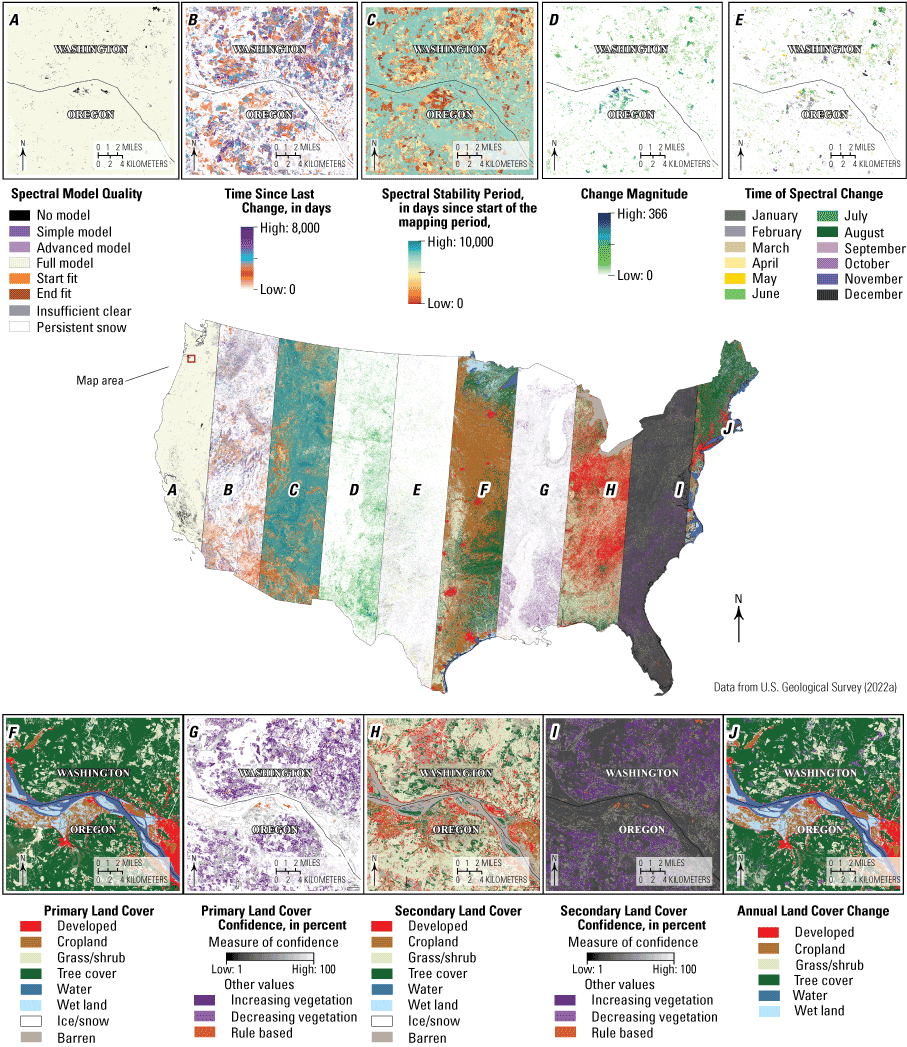
Map and panels showing the 10 products in the Land Change Monitoring, Assessment, and Projection Collection 1 product suite including (A) Spectral Model Quality, (B) Time Since Last Change, (C) Spectral Stability Period, (D) Change Magnitude, (E) Time of Spectral Change, (F) Primary Land Cover, (G) Primary Land Cover Confidence, (H) Secondary Land Cover, (I) Secondary Land Cover Confidence, and (J) Annual Land Cover Change. The 10 close-up panels depict each product over Portland, Oregon (U.S. Geological Survey, 2022a).
The LCMAP Primary and Secondary Land Cover products have eight land cover classes generally following the guidelines in the Anderson level 1 classification scheme (Anderson and others, 1976; U.S. Geological Survey, 2024a). These general land cover classes serve to distinguish major vegetation functional types, except for the grass/shrub class, which is more aligned with the original Anderson class termed “rangeland.” The developed and cropland classes represent specific types of major land uses. The LCMAP project has merged with the NLCD, delivering annual land cover and change product suite for the conterminous United States in 2024 (Multi-Resolution Land Characteristics Consortium, 2024).
The LCMAP annual product suite was developed with the broad land cover user community in mind. Early adoption and feedback included scientists engaged in various research topics that required annual land cover and (or) a long period of record including estimating biological carbon emissions (Diao and others, 2020), modeling future land use (Sohl and others, 2019; Dornbierer and others, 2021), tracking urban heat island effects (Xian and Shi, 2019), documenting forest fragmentation (Soulard and others, 2017), and modeling wildfire probability (Ye and others, 2021). In the 5 years since the release of the first LCMAP land cover product suite (Collection 1.0), the data have been applied to many applications mainly in the sectors of education, policy, and government scientific study. Scientific topics have included water quality and quantity (Tábora-Sarmiento and others, 2022; McQuillan and others, 2023; Rumsey and others, 2023; Wang and others, 2023), greenhouse gas emissions (Crockett and others, 2023), wildfire hazards (Gould and others, 2023; Hawbaker and others, 2023), conservation (Malakoff and Nolte, 2023; Hagen and others, 2024), wildlife habitat (Gigliotti and others, 2023), ecosystem disturbance/disease (Bhattarai and others, 2022), and urban development (Nolte and others, 2021; Inglis and others, 2023).
Coastal Change Analysis Program
The Coastal Change Analysis Program (C–CAP) (https://coast.noaa.gov/digitalcoast/tools/lca.html) is an NGDA for land cover and change information in the coastal areas of the United States. The C–CAP has been produced by the National Oceanic and Atmospheric Administration (NOAA) since the mid-1990s and had the original vision of tying upstream land use and change to downstream effects to fish habitat.
Starting in the mid-2000s, NOAA began to coordinate these efforts more closely with the efforts of the NLCD through the MRLC Consortium. This collaboration resulted in NOAA assuming primary mapping responsibility for the coastal United States and regional C–CAP data being directly incorporated into the NLCD (for 2001, 2006, and 2011). As such, NOAA considers C–CAP to be the coastal expression of the NLCD. Similar to the NLCD, regional C–CAP land cover mapping is derived from Landsat imagery and distributed as 30-meter raster output (table 2). In more recent mapping, this relationship has flipped, and NOAA now uses NLCD mapping products to produce updates to the C–CAP time-series data. The key distinctions of regional C–CAP data from the NLCD include a particular focus on wetlands and the changes associated with wetlands. NOAA maps nine classes of wetlands (in addition to open water). These classes follow the Cowardin scheme (Cowardin and others, 1979) and make specific distinction between estuarine and palustrine environments, which are not present in most other land covers.
NOAA is planning to release a 2021 update (based on the 2021 NLCD), but this is likely to be the last of the natively produced 30-meter updates because NOAA has also been working to produce a high-resolution (1-meter) version of these national products (https://coast.noaa.gov/digitalcoast/data/ccaphighres.html). An initial phase to this more spatially detailed mapping exists (focused on impervious surfaces, woody canopy, and water features), and the ultimate goal is to develop a product that includes about 20 classes, similar to the previous 30-meter products. Such detailed data can provide more precision to regional studies and support a wide range of additional applications at the local and site scales (fig. 3A–B), where the 30-meter resolution is not appropriate. These new data can be used to improve planning for sea level rise, protect communities from flooding, inform wetland restoration projects, and enable other activities to build climate resilience. Current efforts (May 2024) are focused on the production of a national 2021 update with plans of completing that mapping by the end of 2025 (at which point data would start to be updated on a regular cycle, every 4 to 6 years).
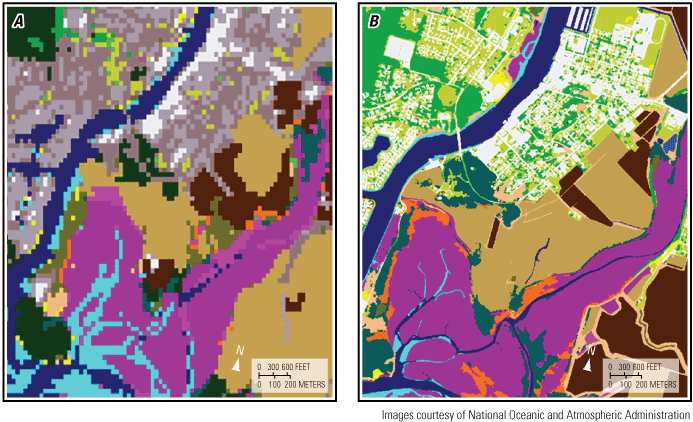
Images showing (A) 30-meter land cover data for Shelter Bay in Skagit County, Washington, and (B) the same area with 1-meter high-resolution land cover data, making the area 900 times more detailed (images courtesy of National Oceanic and Atmospheric Administration).
Cropland Data Layer
The U.S. Department of Agriculture (USDA) National Agricultural Statistics Service (NASS) Cropland Data Layer (CDL) is an NGDA for agricultural land cover (U.S. Department of Agriculture, 2024a). The CDL has been produced annually and nationally since 2008 to (1) provide monthly planted acreage estimates during the growing season for the major crops to the NASS Agricultural Statistics Board and (2) produce crop-specific land cover products (fig. 4). The CDL provides supplemental independent satellite-derived acreage estimates to the Agricultural Statistics Board in support of the NASS mission. The CDL is released to the public upon completion of the growing season at a 30-meter resolution. A transition to a 10-meter national CDL product is planned for crop year 2024 (a crop year is the period from one year’s harvest to the next) for enhanced national-scale assessments (Li and others, 2024). The CDL incorporates crop-specific ground reference data from the Farm Service Agency, Common Land Unit, ancillary reference data from the NLCD, National Elevation Dataset, tree canopy cover, and imperviousness layers to derive the nonagricultural areas and satellite imagery collected throughout the growing season from Landsats 8 and 9 and Sentinel-2 missions (table 2). The CDL product includes more than 110 crop categories with accuracies between 85 and 95 percent for major crop commodities (for example, corn, soybeans, wheat, cotton, and rice).
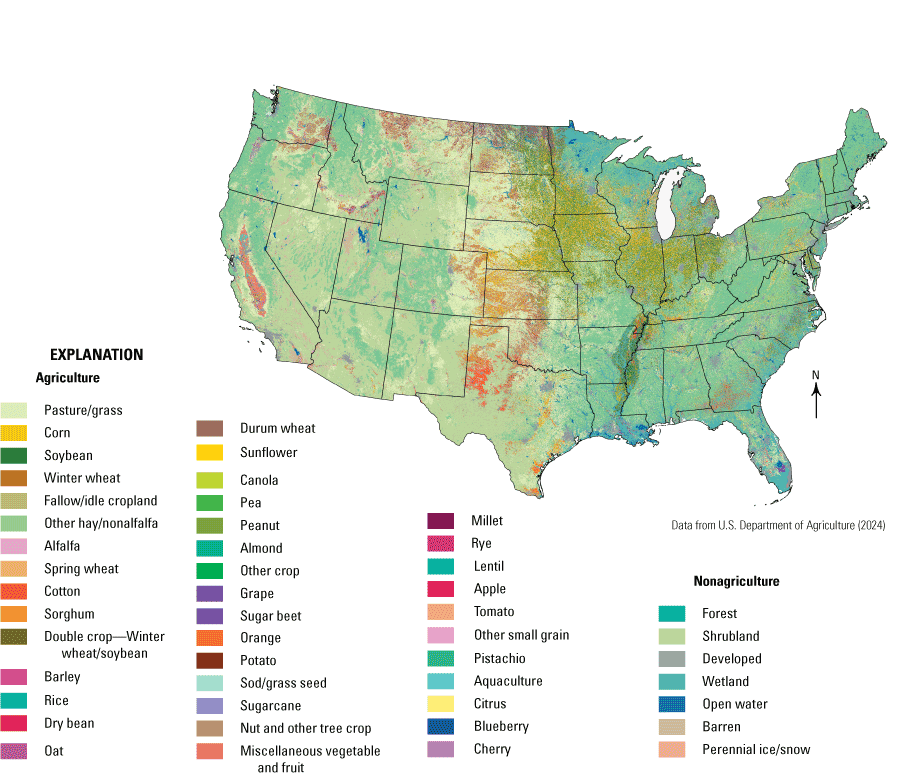
Map showing land cover classes for the conterminous United States from Cropland Data Layer 2023 (data from U.S. Department of Agriculture [2024a]).
The CDL also produces a suite of derivative products including (1) Crop Sequence Boundaries (Hunt and others, 2024), which is a product that produces estimates of field boundaries, crop acreage, and crop rotations; (2) Cultivated Layer (Boryan and others, 2012) based on the most recent 5 years of CDLs documenting cultivated areas; (3) Area Sampling Frames, which define and segment geographic regions for statistical sampling and analysis (Boryan and Yang, 2017); and (4) Crop Frequency Layer, which provides the frequency that specific crops have been planted in a given area over a designated period (Boryan and others, 2014), which identifies crop-specific planting frequency and is based on land cover information derived from the 2008 through 2023 CDLs. The CDL also serves as the basis to derive disaster assessments based on historical data to evaluate crop damage from flooding and other natural disasters.
Landscape Change Monitoring System
The FS Landscape Change Monitoring System (LCMS) consistently monitors changes in vegetation cover, land cover, and land use from 1985 to the most recently concluded growing year across the Nation. Although multiple operational mapping efforts blend land cover and land use, the LCMS distinguishes between land use and land cover in its modeling and mapping, which allows users novel and unique monitoring data solutions. Primarily, the LCMS is engineered to inform land managers and scientists, who make data-driven decisions, with data that monitor change in vegetation cover and conversion of land cover and land use.
LCMS data layers include annual probability of gain and loss changes (fig. 5), land cover, and land use at a 30-meter resolution for the conterminous United States and coastal Alaska. LCMS methods use more than 40 years of Landsat data, time-dependent sequences of training data, and a multiple classifier system with ensemble-rule stacking in Google Earth Engine (table 2). A new classified layer, in beta release (as of May 2024), specifies attribution of major change processes. Additionally, continuous annual tree canopy cover layers are being integrated into the LCMS data suite to provide users with change magnitude metrics across the Nation that are not based on spectral units alone.
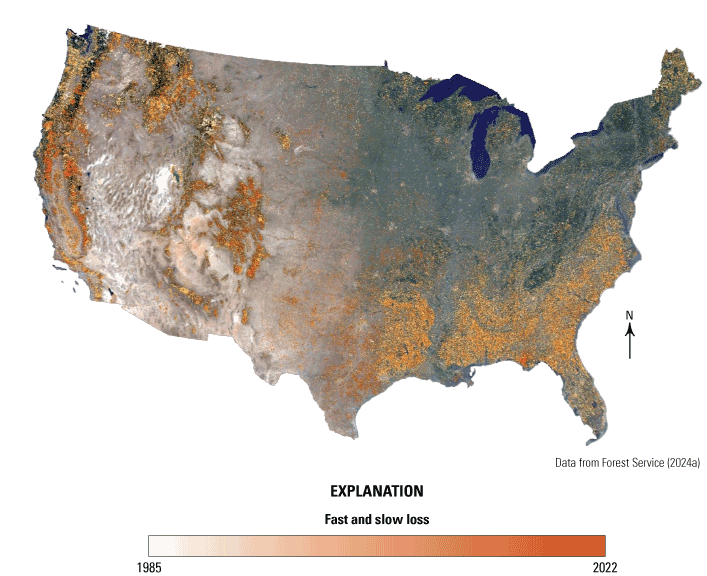
Map showing the Landscape Change Monitoring System, produced by the Forest Service, which serves annual data layers of vegetation cover, land cover, and land use change (Forest Service, 2024b). Here a map of the conterminous United States shows “fast” and “slow” loss, where fast loss represents vegetation cover loss caused by short-duration events (for example, fire or forest cutting), while slow loss represents vegetation cover loss caused ty long-duration events (for example, drought). The color represents the date in which a fast or slow loss occurred or that location. An attribution layer is in beta release (May 2024; https://apps.fs.usda.gov/lcms-viewer/).
Rangeland Condition Monitoring Assessment and Projection
Rangelands occupy huge swathes of land in the United States, providing critical wildlife habitat, forage for livestock, carbon sequestration, provision of water resources, and recreational opportunities. Rangeland ecosystems in the western United States are vulnerable to climate change, fire, invasive species, and anthropogenic disturbances. The USGS and Bureau of Land Management (BLM) developed the Rangeland Condition Monitoring Assessment and Projection (RCMAP) project (Rigge and others, 2024) to address the specific needs of rangeland managers. The RCMAP project, which was originally a value-added product from the NLCD, provides robust, long-term, and floristically detailed maps of vegetation cover at yearly time steps. These data classify the fractional (in percent) cover of rangeland components (annual herbaceous, bare ground, herbaceous, litter, nonsagebrush shrub, perennial herbaceous, sagebrush, shrub, and tree; fig. 6) and shrub height annually from 1985 to 2023 (Rigge and others, 2024; table 2). Maps are produced using ecologically comprehensive field data, Landsat imagery, and machine learning. RCMAP’s series of more than 300 high-resolution training sites was derived from WorldView imagery and focused on postprocessing to reduce temporal noise, resulting in a dataset distinct from similar products such as the Rangeland Analysis Platform (RAP; https://rangelands.app/) Additionally, RCMAP produces trend statistics using linear and structural change methods (Shi and others, 2022).
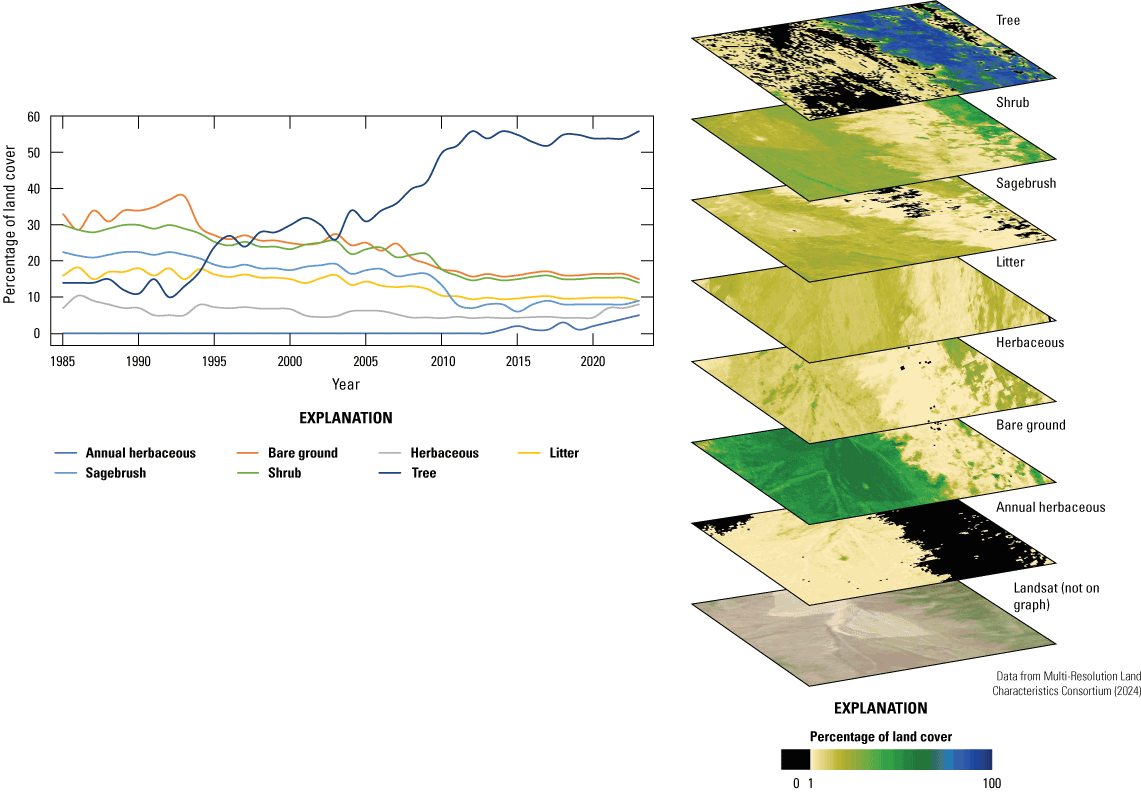
Graph and diagram showing how the Rangeland Condition Monitoring Assessment and Projection program tracks the annual temporal variation in fractional component cover from 1985 to 2023 and provides ecologically rich information on landscape change (Multi-Resolution Land Characteristics Consortium, 2024).
Land managers are tasked with balancing key land uses, from preserving habitat for species with reduced populations such as Centrocercus urophasianus (Bonaparte, 1827; the greater sage-grouse) to leasing land to ranchers for grazing. Land managers and scientists use RCMAP data to monitor changes to vegetation composition, evaluate past management practices, target future improvements, determine locations of critical wildlife habitat, assess effects of climate change and interannual variation, and appraise landscape health and fragmentation. The long-term detailed perspective of RCMAP is key to understanding the often slow and complex responses to climate change, altered management, and disturbance.
Landscape Fire and Resource Management Planning Tools
Landscape Fire and Resource Management Planning Tools (LANDFIRE) is a vegetation, fire, and fuels characteristic mapping program managed by the FS and the Department of the Interior. The USGS Earth Resources Observation and Science Center oversees spatial data production, and The Nature Conservancy is a partner. LANDFIRE was chartered in 2004 by the Wildland Fire Leadership Council and produced its first wall-to-wall U.S. maps in 2009. LANDFIRE produces a comprehensive, consistent, and credible suite of more than 25 geospatial layers (4 are NGDAs) characterizing and classifying vegetation, fuels, fire regimes, and disturbances at a 30-meter resolution for the conterminous United States, Alaska, Hawaii, and insular areas (Picotte and others, 2019; table 2). LANDFIRE maps serve as a set of common metrics for decision support with efforts such as land management prioritization exercises (Carter and others, 2021), fire behavior and risk modeling (Scott and others, 2020), identifying habitats of concern (Van Lanen and others, 2023; Woodie and others, 2023), and smoke and emissions modeling (Prichard and others, 2019). A key application of LANDFIRE is for modeling of fire behavior and effects for wild (Noonan-Wright and others, 2011) and prescribed fire. A set of eight LANDFIRE fuel and landscape layers is integrated into Federal planning tools such as the Wildland Fire Decision Support System, the Interagency Fuels Treatment Decision Support System, and the Wildfire Risk to Communities Tool. However, to aid in understanding the characteristics of fuels on the landscape in the context of fire behavior, LANDFIRE must first map detailed vegetation types, amounts, and distributions (horizontally and vertically), along with fragmentation of fuels (roads) and risk to structures (developed). Thus, most LANDFIRE data layers are applicable to a broad range of land use and land cover applications.
Relevant to greenhouse gas inventories specifically, LANDFIRE creates a spatial representation of the Fuel Characteristic Classification System (FCCS; Prichard and others, 2013), which is a representation of fuel beds, or the amount of fuels by vertical strata in each pixel. The FCCS is used in numerous smoke and emissions models including Bluesky (Larkin and others, 2009), which is part of the U.S. Environmental Protection Agency’s National Emissions Inventory (focused on fire emissions; U.S. Environmental Protection Agency, 2023) and VSMOKE (focused on prescribed fire smoke modeling; Lavdas, 1996). The FCCS contains 460 classes that are equated to 9 fuel loading categories available from the ground to the canopy. Fuel loading classes are assigned based on the existing vegetation and the types of disturbance experienced, along with the severity and the time since disturbance. LANDFIRE also maps annual disturbance types and severities as a stand-alone product to assist in adjusting fuels.
Specific to land cover and land use, LANDFIRE contains several spatial datasets that provide information at a 30-meter resolution. Two key spatial data land use and land cover classifications include the LANDFIRE Existing Vegetation Type (EVT) layers (La Puma, 2023; fig. 7). These layers include the Ecological Systems Classification and the U.S. National Vegetation Classification (NVC) System (ver. 2.0) at the group level (Comer and others, 2003). These classes are derived from plot training data in the LANDFIRE Reference Database, which contains more than 1 million plots (including FIA and National Resources Inventory [NRI] plot training data). Classes are modeled using machine learning with Landsat or Harmonized Landsat and Sentinel-2 (HLS) satellite imagery, climate, topography, and other relevant data. Detailed classes can easily be grouped to higher level categories depending on applications (for example, Ecological Systems subclass; fig. 7). The modeled vegetation classifications are supplemented by numerous other datasets, such as agricultural types from the CDL, developed and impervious types from the NLCD, coastal data from the C–CAP, and wetlands information from the NWI to generate comprehensive land cover at a 30-meter resolution for the United States.
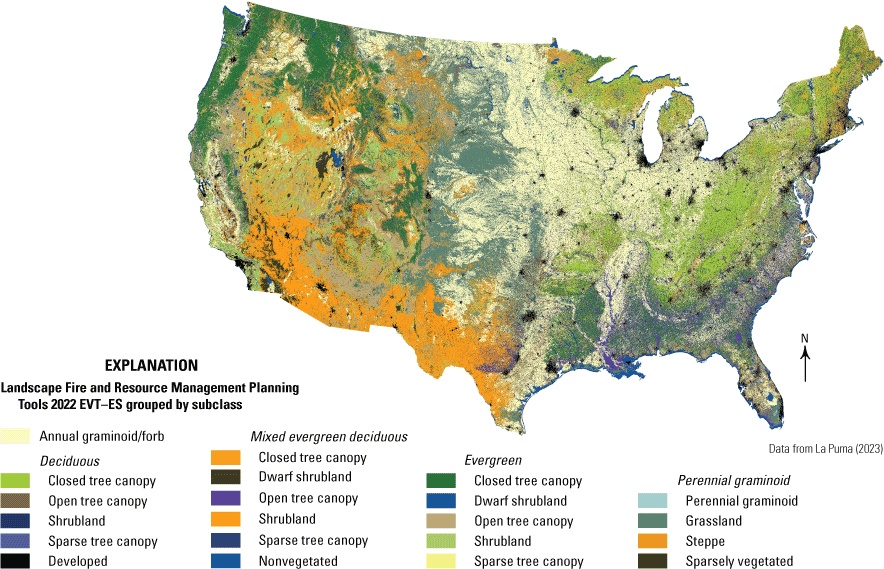
Map showing example of 849 Landscape Fire and Resource Management Planning Tools Existing Vegetation Type Ecological Systems (EVT–ES) in the conterminous United States grouped into 21 EVT–ES subclasses with a 90-kilometer buffer extending from the U.S. border into Canada and Mexico (data from La Puma [2023]).
Similarly, LANDFIRE now provides annual updates to continuous percentage values for Existing Vegetation Cover and Existing Vegetation Height of herbaceous, shrub, and tree lifeforms (Picotte and others, 2019; La Puma, 2023). These datasets are modeled using LANDFIRE Reference Database plots, light detection and ranging (lidar) training data, and seasonal HLS imagery predictors. Overall, LANDFIRE’s detailed vegetation classes for habitat and vegetation structure, fuel classes for fire behavior modeling, and maps of fuel beds for consumption and emissions models are unique contributions to national datasets of land use and land cover that leverage numerous other MRLC mapping efforts while providing the detail needed for resource management and fire and smoke modeling applications.
National Federal Inventory Datasets
The following Federal inventory programs offer authoritative information on land cover and land use (table 2), providing independent and complementary data and information to MRLC datasets while also supporting the production of MRLC products.
National Wetlands Inventory
The FWS NWI geospatial dataset serves as the Wetlands Layer of the U.S. National Spatial Data Infrastructure and has been named an NGDA. The NWI Program was established in the mid-1970s to support natural resource conservation through the mapping and monitoring of wetland and deepwater habitats. The program is mandated by Congress under the Emergency Wetlands Resources Act of 1986 (Public Law 99–645 as amended) and other legislation to produce and disseminate the NWI geospatial dataset. The dataset supports the FWS legislated responsibilities under the Endangered Species Act (Endangered Species Act, 1973), National Environmental Policy Act of 1969 (Public Law 91–190, 83 Stat. 42, U.S.C. 4321–4370h), Fish and Wildlife Coordination Act of 1934 (Public Law 73–121, 48 Stat. 401, U.S.C. 661–667e), Coastal Barrier Resources Act of 1982 (Public Law 97–348, 96 Stat. 1653, 16 U.S.C. 3501–3510), North American Wetlands Conservation Act of 1989 (Public Law 101–233, 103 Stat. 1968, 16 U.S.C. 4401–4414), and other key laws.
The NWI geospatial dataset is a component of the FGDC Water-Inland Theme. It contains more than 36 million polygons that provide spatially explicit, contiguous information on wetland and deepwater habitat type, location, and extent within the United States and its territories (fig. 8). The FGDC-endorsed wetland mapping standard requires that the dataset be produced at a fine spatial resolution (for example, 1-meter base imagery and less than or equal to 0.2-hectare polygons required except for Alaska) and categorical resolution (that is, millions of potential unique codes). The standard requires a high level of accuracy (98-percent producer’s accuracy for the lumped wetland class). This geospatial dataset supports a standardized, queryable database, providing complete coverage over the conterminous United States, U.S. territories, Hawaii, and about one-half of Alaska. Completion of Alaska is planned by about 2028.
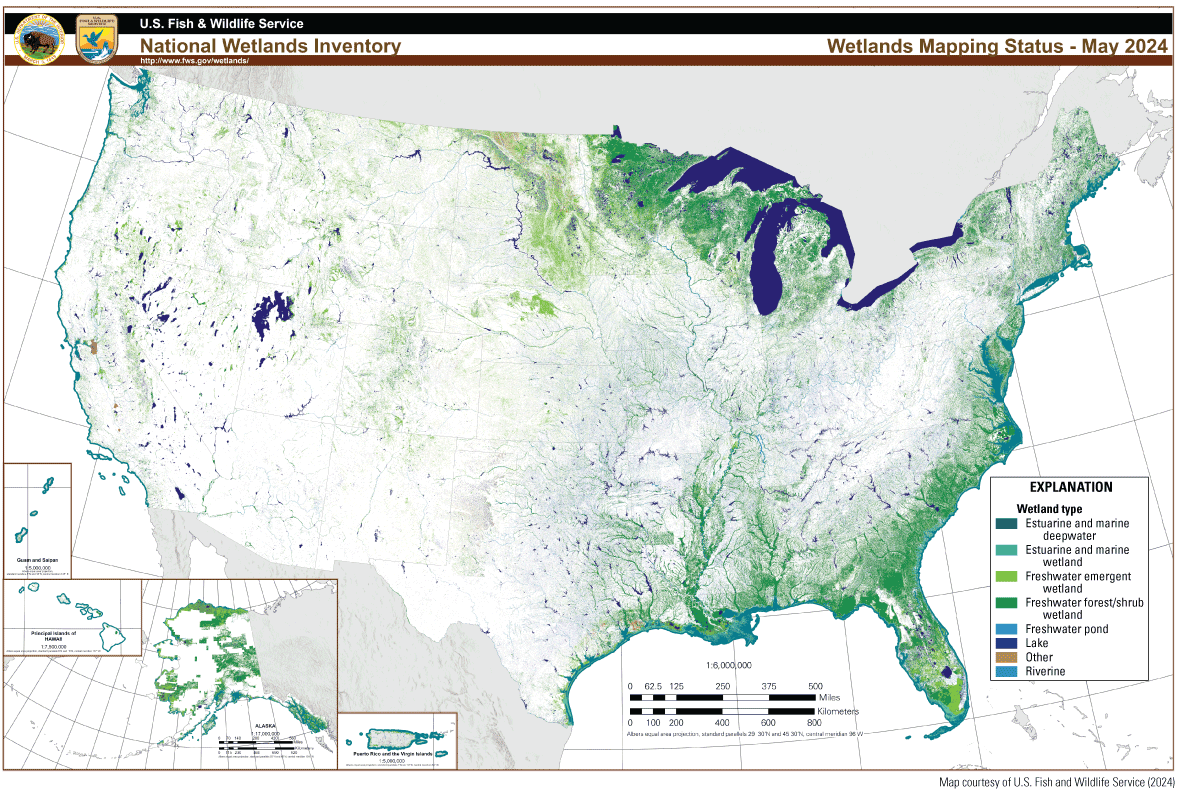
Map showing National Wetlands Inventory geospatial dataset, May 2024. Classes are simplified for display (from U.S. Fish and Wildlife Service [2024]).
The NWI dataset supports applications across government, nonprofit, and commercial organizations and meets the needs of private citizens. The dataset is applied by stakeholders to applications ranging from habitat assessment and species population modeling (Gibbs 2000; Mushet and others, 2012; Walker and others, 2013; Reeves and others, 2016) to development (Pearse and others, 2016), invasive species assessments (Pilliod and others, 2010; Marlor and others, 2014; Koncki and Aronson, 2015), natural hazard mitigation (Haddad and others, 2016), water supply and quality (Hansen and others, 2018; Lee and others, 2019), climate (Koncki and Aronson, 2015), and ecosystem restoration planning (Mushet and others, 2012; Reeves and others, 2016), as well as policy development (Tiner, 2003), research, and education. The dataset also supports a variety of Federal efforts and tools, including the FWS Information for Planning and Consultation tool (https://ipac.ecosphere.fws.gov/), North American Wetlands Conservation Fund (https://www.fws.gov/program/north-american-wetlands-conservation), and Coastal Program; the Environmental Protection Agency’s NEPAssist (https://www.epa.gov/nepa/nepassist), EnviroAtlas (https://www.epa.gov/enviroatlas), and National Estuary Program map (https://experience.arcgis.com/experience/21d284ac2563413d879d295668d38369?org=EPA); the U.S. Army Corps of Engineers online permitting system (https://www.usace.army.mil/missions/civil-works/Regulatory-Program-and-permits/Obtain-a-Permit/); the USGS’s The National Map (https://www.usgs.gov/programs/national-geospatial-program/national-map); NOAA’s Environmental Response Management Application (https://response.restoration.noaa.gov/resources/maps-and-spatial-data/environmental-response-management-application-erma); the Bureau of Reclamation’s GeoMine (https://geomine.osmre.gov/); and Housing and Urban Development’s construction grant program. The broad array of users and applications leads to extensive use of the dataset with more than 1,900 FWS Wetlands Mapper views daily and more than 37,000 dataset downloads, about 265,000 maps printed, and more than 360,000 unique users each year. The NWI geospatial data can be viewed by the public via the online Wetlands Mapper (https://www.fws.gov/wetlands/Data/Mapper.html) or brought into other decision support systems through web services and direct download.
Forest Inventory and Analysis
The FS FIA program is congressionally authorized and mandated by the McSweeney-McNary Forestry Research Act of 1928 and the Forest and Rangeland Renewable Resources Research Act of 1978 (Public Law 95–307) to keep current a comprehensive inventory and analysis of the Nation’s forest resources. The FIA program has monitored national forest resources in the United States for more than 90 years and provides unique and invaluable geospatial data that are listed as an NGDA in the land use/land cover theme. FIA has evolved from a timber-focused periodic survey to a broader inventory program with nationwide databases and annualized data collection. Data collection and reporting cover all States and territories and all ownership categories of the United States. FIA delivers current, consistent, and credible information necessary for assessing the extent and condition of forest resources in the United States through a comprehensive forest database informed by three national surveys (https://research.fs.usda.gov/programs/fia). FIA’s Nationwide Forest Inventory includes regular remeasurement of land cover and land use on its expansive field-based sample network of about 326,000 permanent inventory plots. For roughly one-third of Nationwide Forest Inventory plots that fall on forest land, forest resource and condition data are collected in situ (Westfall and others, 2022). The statistical properties and quality standards of these strategic FIA forest resource data ensure unbiased estimates with known and quantifiable uncertainty and precision, which are essential for framing policy and making sound management decisions (Bechtold and Patterson, 2005).
The FIA program provides the information needed to assess the status, trends, and sustainability of America’s forests at many scales (fig. 9). FIA data contribute to national and global reporting mechanisms including Resources Planning Act Assessment (Forest Service, 2023), The National Report on Sustainable Forests (McGinley and others, 2023), the United Nations Food and Agriculture Organization Global Forest Resources Assessment (https://www.fao.org/forest-resources-assessment/en/), the North American Forest Database (https://datosforestal.nfis.org/en/), and the Fifth National Climate Assessment (U.S. Global Change Research Program, 2023). FIA data are used to develop policy and inform management decisions at the national, State, and local levels and for a variety of science applications. FIA data were used in applications related to carbon cycle, climate, forest products, forest growth, forest health, biological diversity, and others (Rudis, 2003, 2005; Tinkham and others, 2018). FIA continues to meet emerging needs, and new ways are being developed to deliver its inventory and monitoring data and science through new reporting and geospatial and digital engagement tools.
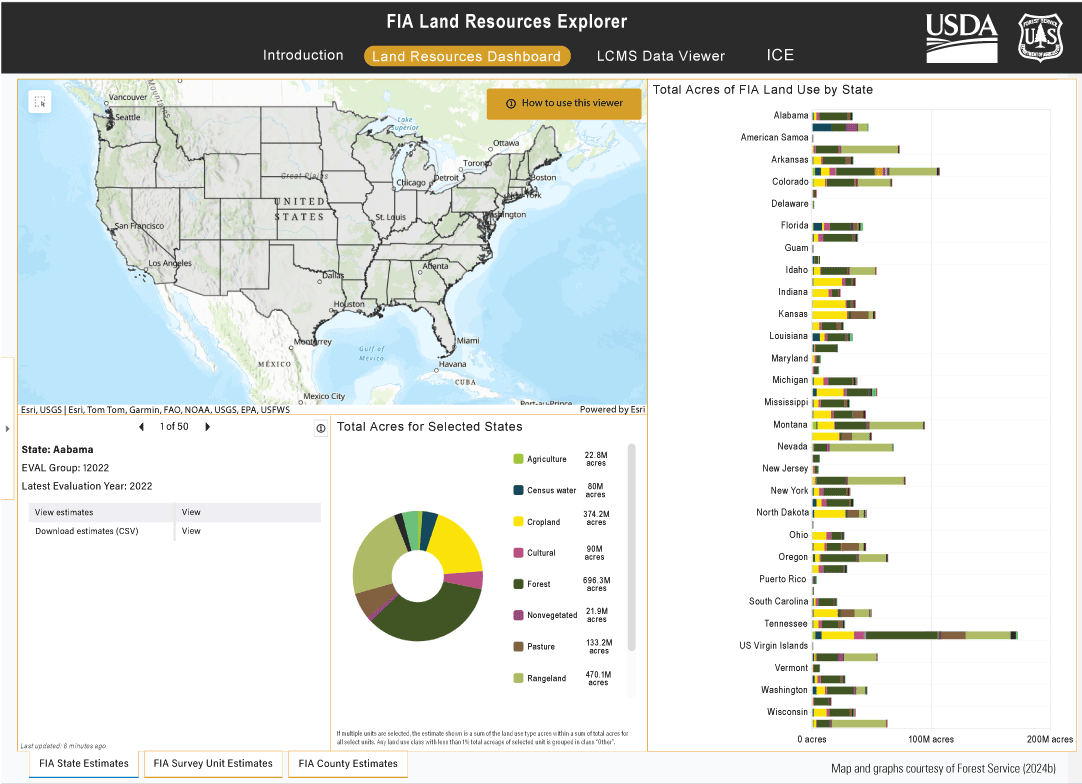
Map and graphs showing the Forest Inventory and Analysis (FIA) program is expanding the breadth of mechanisms for delivering its forest resource data to a wide range of users. For example, the FIA Land Resources Explorer Dashboard presents geospatial information on land use, land cover, and change as directed by the U.S. Department of Agriculture (USDA) Farm Bill (Public Law 115–334) and to support land management decisions (Forest Service, 2024a). More examples are in the FIA Geospatial Showcase (https://fia-usfs.hub.arcgis.com/). [LCMS, Landscape Change Monitoring System; ICE, Image-based Change Estimation; USGS, U.S. Geological Survey; FAO, United Nations Food and Agriculture Organization; NOAA, National Oceanic and Atmospheric Administration; EPA, U.S. Environmental Protection Agency; USFWS, U.S. Fish and Wildlife Service; M, million; EVAL, EVALIDator tool; CSV, comma-separated values]
National Resources Inventory
The NRI program was established under the Rural Development Act of 1972 (Public Law 92–419, 86 Stat. 657, which mandated the Secretary of Agriculture to implement a land inventory and monitoring program and to issue a report on the conditions and trends of soil, water, and related resources at intervals not exceeding 5 years. The program is an extension of previous similar, though less intensive, collections dating back to 1935. The NRI survey program is scientifically based, using recognized statistical sampling methods.
The 2017 NRI was completed by the USDA Natural Resources Conservation Service (NRCS), in cooperation with Iowa State University’s Center for Survey Statistics and Methodology, which serves as the NRI Statistical Unit providing statistical and survey method support for the NRI program. The 2017 NRI provides nationally consistent data for the 35-year period of 1982–2017 (Natural Resources Conservation Service, 2024; fig. 10). Statistical estimation and quality assurance procedures used for the NRI survey program help ensure that trends reported using NRI data reflect true changes in resource conditions.
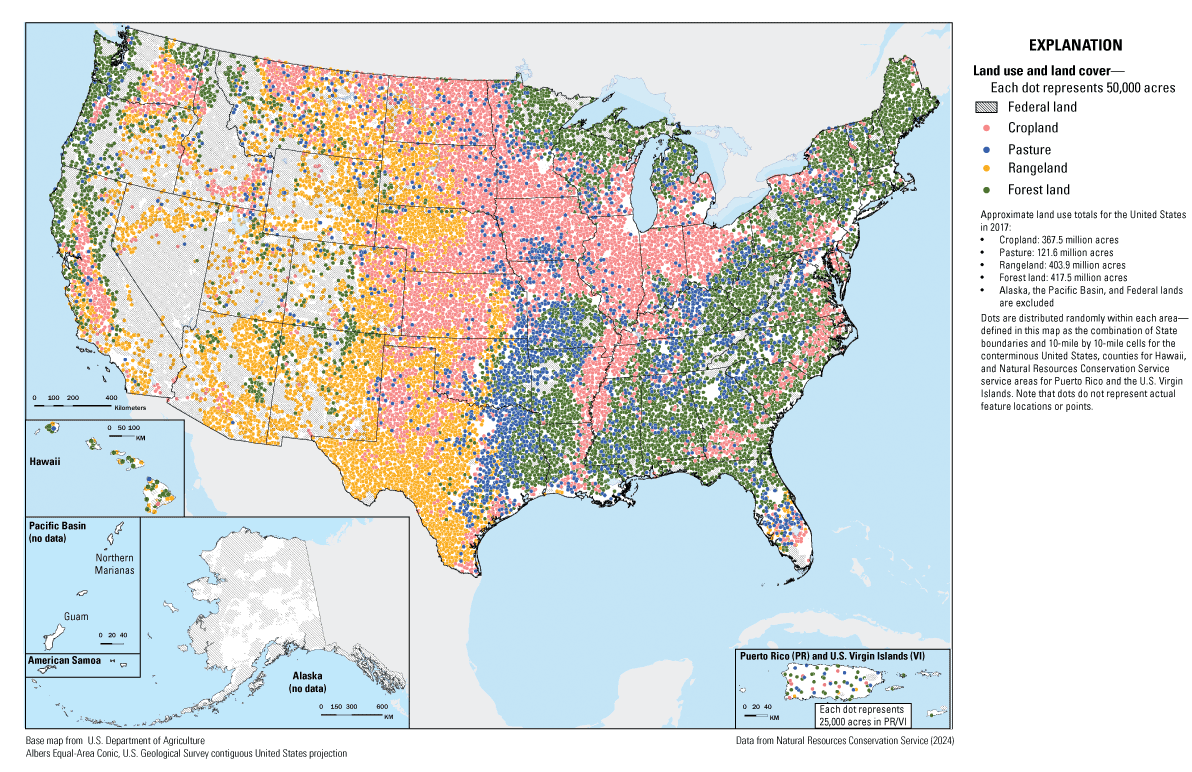
Map showing the National Resources Inventory program dominant land uses in 2017 (Natural Resources Conservation Service, 2024).
The foundation sample used in the NRI consists of more than 300,000 primary sampling units (PSUs) of area, most of which are around 160 acres. These were selected in every county (or county equivalent) in the 48 conterminous States, Hawaii, Puerto Rico, and the U.S. Virgin Islands. A similar collection for Alaska has been carried out once, and an annual collection is planned to be included with the next release, the 2022 NRI, planned for 2025. Within each of these PSUs, points were selected randomly. For most PSUs, 3 points were selected, which resulted in more than 800,000 points. Data from PSUs and from the points are primarily collected using high-resolution (15-centimeter resolution) digital aerial photography. The data are collected by specially trained personnel at the NRCS remote-sensing laboratories. Additional data are also collected from administrative records and the NRCS State Offices’ local knowledge.
The NRI included data on land cover and land use (52 classes including crops on cropland), irrigation and conservation practices, erosion, prime farmland and land capability, soils, wetlands, forest type, and other miscellaneous land use and resource concerns. Because data have been collected from the same PSUs and points in 1982, 1987, 1992, 1997, and 2000–17, the database has a wealth of information not only at each of those points in time but also on the gross change over that 35-year span (table 2).
Assessment, Inventory, and Monitoring
The BLM is tasked with multiuse land management considering livestock grazing, energy development, recreation, wildlife habitat, and more across 9.9 million square kilometers of public lands. To systematically quantify ecological resource conditions and trends, the BLM established the Assessment, Inventory, and Monitoring (AIM) program. Indicators collected by AIM measure four aspects of ecosystem health: drainage basin function, maintenance of ecological processes, water quality, and habitat characteristics for species of management concern. These indicators are rooted in policy and are thus directly relevant to decision making (Kachergis and others, 2022). Since 2011, AIM has collected data from more than 58,000 upland sites, more than 400 wetland and riparian sites, and more than 5,000 lotic sites within stream channels with repeat observations at some sites (Bureau of Land Management, 2024a, b; fig. 11).
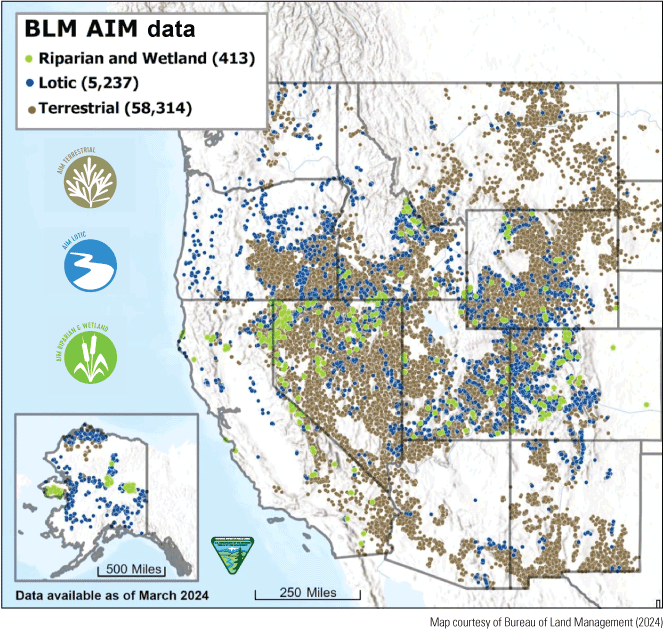
Map showing the consistent field observations of ecological resource conditions and trends collected by the Bureau of Land Management (BLM) across the western part of the conterminous United States and Alaska as part of the Assessment, Inventory, and Monitoring (AIM) program. Most observations represent terrestrial (upland) sites and have unique protocols for lotic (within stream channels) and riparian and wetland sites (Bureau of Land Management, 2024a, b).
AIM uses broadly accepted protocols (Herrick and others, 2018; Bureau of Land Management 2021, 2024a) and indicators to collect field observations. The terrestrial AIM protocol is consistent with the USDA NRI program. Because many natural resource management concerns span multiple spatial scales, AIM data have been designed to be relevant to various concerns ranging from local scale permitting renewal decisions to regional evaluations of invasive species trends. AIM methods provide flexibility to incorporate locally relevant or secondary monitoring objectives. AIM sample designs are based on regional monitoring objectives and use statistical approaches to obtain random, spatially balanced sample locations for each area of interest; however, as with indicators measured, sampling intensity can be augmented in areas of particular concern (for example, in national monuments or restoration treatment areas). AIM data are collected in a manner readily ingested by Landsat resolution mapping efforts (Kachergis and others, 2022) including RCMAP, RAP, and the Landscape Cover Analysis and Reporting Tool (https://eros.usgs.gov/doi-remote-sensing-activities/2022/blm/landcart-landscape-cover-analysis-and-reporting-tools). With remote sensing, AIM core observations such as vegetation cover can be extended through space and time.
Non-Federal Product Summary
The national-scale land cover products produced by Federal agencies have a long provenance and have served authoritative, consistent, high-quality data for many years. With the proliferation of free data, new remote-sensing platforms, and cloud computing, global land cover mapping has become increasingly feasible. The private sector and international governmental organizations are now producing global products with spatial and thematic characteristics comparable to federally produced products outlined previously (table2). As global-scale products, they provide reasonable accuracy for single date mapping, but as assessed by Wang and Mountrakis (2023), federally produced land cover such as the NLCD and LCMAP provide higher level accuracy than global level products within the conterminous United States. These federally produced land use and land cover products benefit from comprehensive country-specific training and validation data to enhance their reliability and accuracy. Some global products also offer multitemporal coverage, yet accuracy of change between multiple dates has generally not been assessed.
What follows are brief summaries of freely available global-scale land cover data including coverage in the United States. Note multiple commercially available land cover datasets are available at a higher spatial resolution (as much as a 1- to 3-meter resolution). However, these datasets are not freely available, are often produced on demand (not readily available nationally) without long-term availability, and typically come at a substantial cost for usage at scales greater than local.
European Space Agency World Cover
The European Space Agency (ESA) organized a consortium of private and academic partners that produced the first global-scale, 10-meter-resolution land cover product. The October 2021 first release provided Sentinel-1 and Sentinel-2-based global land cover datasets at a 10-meter resolution, based on 2020 imagery. The WorldCover consortium produced a new 2021 version that was released in October 2022. ESA’s product is unique for a global-scale land cover product in its use of synthetic aperture radar data from Sentinel-1, in combination with optical data from Sentinel-2. The two products were produced with different algorithms, and as such, any change between the two dates may be due to real, on-the-ground landscape change or algorithm differences.
Esri Land Cover
Esri, in partnership with the Impact Observatory, provided an Esri land cover product with annual mapping from 2017 through 2022 with nine land cover classes. The product is derived from Sentinel-2 data, with a 10-meter spatial resolution. Annual releases are planned. Accuracy of single date land cover has been completed (Venter and others, 2022), yet accuracy of change has not been completed (or is not publicly available).
Dynamic World
Dynamic World provides near real-time global land cover and uses information leveraging deep learning techniques using Sentinel-2 imagery at a 10-meter spatial resolution. Dynamic World uses the Google Earth Engine cloud-based system to provide land cover predictions as Sentinel-2 imagery becomes available. Dynamic World performed better in temperate and tree-dominated biomes and less well in shrubland/rangeland biomes. Overall, the product performance varies spatially and temporally as a function of Sentinel-2 cloud masking and various land cover types and conditions (Brown and others, 2022).
Global Land Analysis and Discovery /Land & Carbon Lab
The Global Land Analysis and Discovery laboratory at the University of Maryland, in partnership with Land & Carbon Lab convened by the World Resources Institute and the Bezos Earth Fund, has produced a Landsat-based, global land cover change dataset from 2000 through 2020. The product distinguishes eight general land cover classes, and results depict a 6-percent global change in land cover during that period. Unlike most datasets, a thorough analysis of individual date and change accuracy is also provided, and has (expected) substantially lower accuracies for change. An updated 2021 through 2026 mapping is being planned. Global Land Analysis and Discovery also provides global vegetation height data at a 30-meter spatial resolution for 2019 that are useful for carbon stocks, fluxes, and biodiversity applications.
Improving Transparency in Using Land Use, Land Cover, and Change Products
With the variety of land use and land cover products that are available, users need information that could help guide both their choice of product and how that product is used. Here we provide information on relationships among existing products, and factors users can consider when selecting products for their given application.
Synergies Among Existing Land Use and Land Cover Products
Collective Strength
MRLC products (refer to “Multi-Resolution Land Characteristics Map-Based Products” section) collectively provide authoritative national land cover and use information for the Nation. The 2023 Earth Observation Assessments (EOA) documented the societal benefits of Earth observation data (including space/airborne and in situ) and derived products. The first of thirteen 2023 EOA assessment areas—agriculture and forestry—provides great insight into maximizing societal effects of the MRLC land cover and land use products within these sectors. Key objectives include enhancing food supply, maximizing productivity while conserving ecosystem condition, bolstering resilience to disasters and disturbances, and supporting regulatory requirements and evidence-based decision making. Each MRLC product makes a unique contribution to the agriculture and forestry societal benefit area, and collectively, they reach a wide breadth and depth of governmental agencies. The MRLC product suite contributes to 8 of the 11 Federal agencies surveyed in the 2023 assessment, including key projects such as the Federal Emergency Management Agency floodplain maps, the BLM landscape monitoring framework (AIM) project, the National Aeronautics and Space Administration OpenET (evapotranspiration) platform (https://etdata.org/), the U.S. Environmental Protection Agency EnviroAtlas program (https://www.epa.gov/enviroatlas), and the FS iTree tool suite (https://www.itreetools.org/). The Sankey diagram in figure 12 shows the contribution the MRLC product suite provides to key objectives in the agriculture and forestry sectors. Sankey diagrams visualize the connections between two nodes in a network. These flow diagrams move from left to right following a data source (for example, the NLCD land cover) through its supported products (green nodes) to key societal objectives within a single sector (yellow nodes). Several MRLC products and some key agency products supported by the MRLC suite are annotated in the figure. Other Federal inventory datasets such as the NWI, FIA, and NRI also make substantial contributions to the EOA agriculture and forestry objectives (Rowe and Vanderhoof, 2024).
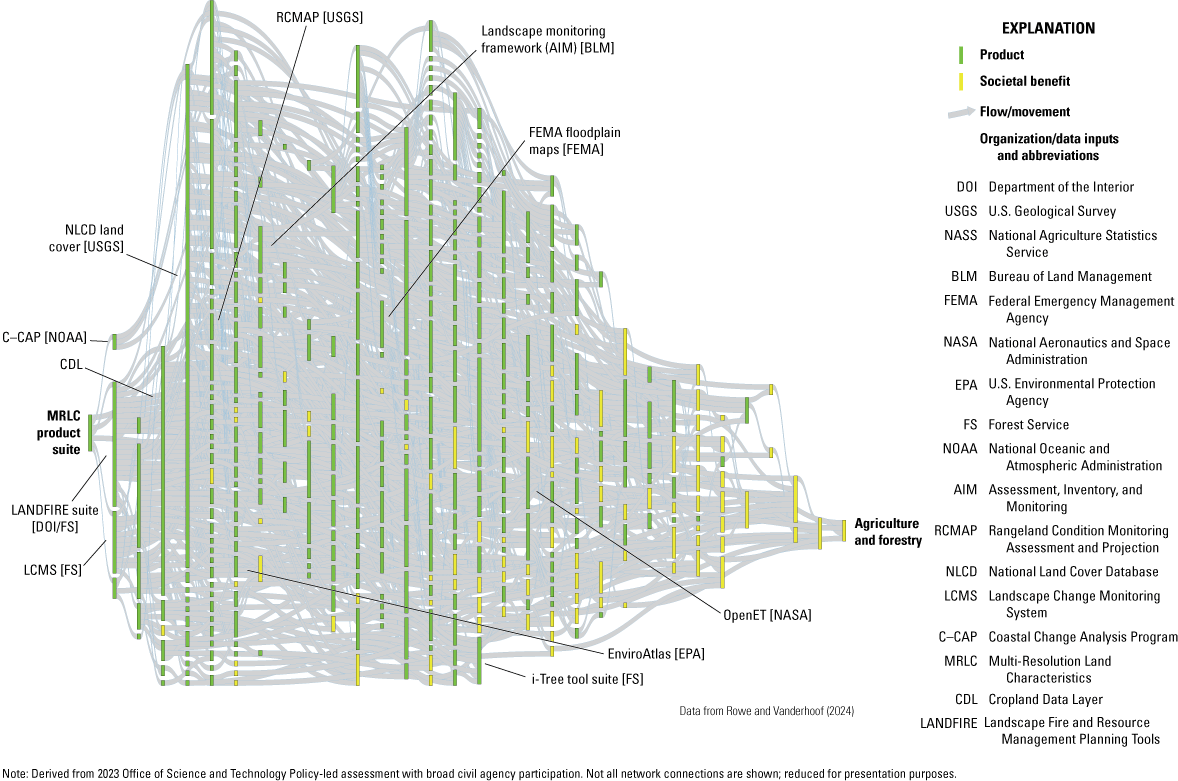
Sankey diagram showing Multi-Resolution Land Characteristics (MRLC) member products (National Land Cover Database; Land Change Monitoring, Assessment, and Projection; Landscape Fire and Resource Management Planning Tools; Landscape Change Monitoring System; Coastal Change Analysis Program; Cropland Data Layer; and Rangeland Condition Monitoring Assessment and Projection) contributions to key products, services, and objectives in the 2023 Earth Observation Assessments (EOA) agriculture and forestry societal benefit area (SBA). Green bars are products and yellow bars are societal benefits identified in the EOA 2023 agriculture and forestry SBA. Gray lines show direct and indirect contributions of MRLC products to the agriculture and forestry SBA (from Rowe and Vanderhoof [2024]).
Product Synergies and Dependencies
Federal agencies that participate in the MRLC Consortium coordinate and generate consistent and relevant land use and land cover data for a variety of research, monitoring, modeling, policy, environmental, and land management applications. To ensure consistent product information and delivery and maximize the efficiency of governmental resource use, MRLC partners leverage each other’s products for input on specific land cover types, highlighting the strength of coordinated Federal-wide land cover mapping. These important dependencies are listed in table 3. For example, the NLCD is a contributor to LCMAP, C–CAP, LANDFIRE, CDL, and RCMAP. Other data sources, such as FIA and NWI, are foundational data critical to support LANDFIRE, LCMS, and NLCD. Every MRLC and supporting product has some dependency to others in the suite. In aggregate, the broad MRLC product suite supports a comprehensive understanding of land change beyond what any one product or agency can provide in isolation.
Table 3.
Multi-Resolution Land Characteristics land cover and land use assets and other Federal product dependencies.[Input data are from the 2023 Earth Observation Assessment. X represents a dataset’s dependency on the input in the corresponding column; — represents no dependencies. C–CAP, Coastal Change Analysis Program; LCMAP, Land Change Monitoring, Assessment, and Projection; LANDFIRE, Landscape Fire and Resource Management Planning Tools; LCMS, Landscape Change Monitoring System; CDL, Cropland Data Layer; NLCD, National Land Cover Database; NRI, National Resources Inventory; RCMAP, Rangeland Condition Monitoring Assessment and Projection; FIA, Forest Inventory and Analysis; NWI, National Wetlands Inventory]
Common Input Data Sources
In addition to the interdependencies mentioned previously among the MRLC products and national inventory data, these products also leverage common input data sources and several additional ancillary datasets (table 4). Remote-sensing data such as Landsat, the National Agriculture Imagery Program (U.S. Department of Agriculture, 2024b), the 3D Elevation Program (U.S. Geological Survey, 2024b), Sentinel-2, and commercial imagery (for example, WorldView, IKONOS, GeoEye1, and Planet) all play important roles in supporting MRLC production. Additionally, in situ data, elevation datasets, and other spatial data also contribute. In all, more than 150 datasets and systems are needed to support the generation of land use and land cover datasets in table 4, highlighting the collective need for continuous access to science-quality remote-sensing data.
Table 4.
Input data sources to Multi-Resolution Land Characteristics and other Federal products.[X represents a product’s use of a data source in the corresponding column; — represents no use. NAIP, National Agriculture Imagery Program; 3DEP, 3D Elevation Program; NED, National Elevation Dataset; WV, WorldView; GAP PAD–US, Gap Analysis Project Protected Area Database of the United States; NHD, National Hydrography Dataset; STATSGO, State Soil Geographic Database; SSURGO, Soil Survey Geographic Database; USGS, U.S. Geological Survey; topo, topography; GPS, Global Positioning System; MTBS, Monitoring Trends in Burn Severity; USDA FSA CLU, U.S. Department of Agriculture Farm Service Agency Common Land Unit; FS FACTS, Forest Service Forest Activity Tracking System; C–CAP, Coastal Change Analysis Program; LCMAP, Land Change Monitoring, Assessment, and Projection; LANDFIRE, Landscape Fire and Resource Management Planning Tools; LCMS, Landscape Change Monitoring System; CDL, Cropland Data Layer; NLCD, National Land Cover Database; NRI, National Resources Inventory; RCMAP, Rangeland Condition Monitoring Assessment and Projection; FIA, Forest Inventory and Analysis; NWI, National Wetlands Inventory]
Future Improvement
Through the 2023 EOA efforts, current users of MRLC products have suggested future improvements. The most requested improvements include increased temporal frequency, improved product accuracy, increased thematic and spatial resolution, improved data accessibility, and reduced product latency. Many NLCD users desire an annual product update and improvement in classification accuracies in various thematic areas (for example, tree canopy cover). The USGS has merged LCMAP and NLCD to produce the next generation of USGS land cover and change products. Annual NLCD, released in the fall of 2024, begins a new product suite of annual periodicity, and extends the product record back to the 1980s, by leveraging new mapping techniques and science processing infrastructure in the cloud (Multi-Resolution Land Characteristics Consortium, 2024). Many users with local or site-level applications require higher spatial resolution than what is provided by Landsat-based products (for example, NLCD, LCMAP, LCMS, RCMAP, and LANDFIRE). NOAA has led efforts to provide higher spatial resolution products, with a shift towards emphasizing 1-meter data products for C–CAP (refer to “Multi-Resolution Land Characteristics Map-Based Products” section). The USDA is also shifting towards improving spatial resolution for future iterations of the CDL. Across all agencies and products, methodological advances along with cloud-based processing and data distribution have resulted in continuous improvements in data accessibility and shortened product latency.
Comparing U.S. Land Cover Products—User Considerations
No one right answer to mapping and monitoring landscapes exists because the need for land use and land cover information varies across a vast array of applications and scales. NLCD data have been cited in more than 10,000 peer reviewed journal articles and have appeared in more than 3,000 policy documents. The variety of applications for MRLC and other Federal products includes agriculture, forestry, water resources, climate and weather, biodiversity, carbon and greenhouse gases, land use planning, energy development, and many more, and needs range in scale from local to national. The combined suite of MRLC, other federally produced land cover products, and global products capture many aspects of U.S. land change at different thematic, spatial, and temporal characteristics. In concert, these datasets tell a much more comprehensive story of change than any one product alone can provide; however, the breadth of available data with different definitions and characteristics can introduce complexity and uncertainty for a user. Factors to assist users in selecting U.S. land cover products for their specific application are detailed in the following sections.
Spatial Coverage and Resolution
Users require spatial coverage and spatial resolution that meet the needs for their specific application. Spatial coverage of the MRLC and other federally produced products is most often States, but some products have expanded to insular territories or into Canada and Mexico. Broad, regional- to national-scale applications often use moderate-resolution land cover data (for example, Landsat scale) because of availability and (or) costs, and local- to regional-scale applications often require higher resolution data. The original vision of the MRLC was a multiresolution representation of land characteristics to ensure appropriate data were available to a breadth of applications. Freely available, synoptic coverage of high-resolution data to support high-resolution land cover mapping was rare when the MRLC started in the 1990s, limiting progress towards a true multiresolution vision, but publicly available data such as the National Agriculture Imagery Program from the USDA and airborne lidar data through the USGS 3D Elevation Program have eased some of the data availability resource constraints. In addition, the commercial sector offers a wide variety of moderate- to high-resolution imaging options.
Despite increasingly available high-resolution source data, moderate-resolution (10-meter to 30-meter) land cover data remain the most widely available spatial resolution. Landsat-based, 30-meter resolution data remain the most commonly used land cover data in the United States. Sentinel-2 is increasingly used for landscape mapping and monitoring, and nominal 10-meter-resolution products are available globally from multiple sources (including U.S. coverage). However, the currently available global products have a heavily filtered look to them and seem to generally have less spatial detail than the MRLC-produced 30-meter-resolution products (fig. 13A–D). Freely available high-resolution land cover data (for example, 1–5-meter resolution) are currently unavailable for the entire United States, yet NOAA is starting to produce 1-meter-resolution products for coastal zones (for example, C–CAP). High-resolution data are important for many local and regional applications, but they are more difficult and expensive to produce and may need to be targeted for specific applications to suit local and regional needs. Wetland and deepwater land cover categories are currently available for the United States and its territories at a 1-meter resolution or less through the NWI (U.S. Fish and Wildlife Service, 2024). These new datasets provide greater spatial detail than existing MRLC products and offer a potential blueprint for eventual national-scale high-resolution land cover production at the Federal level.
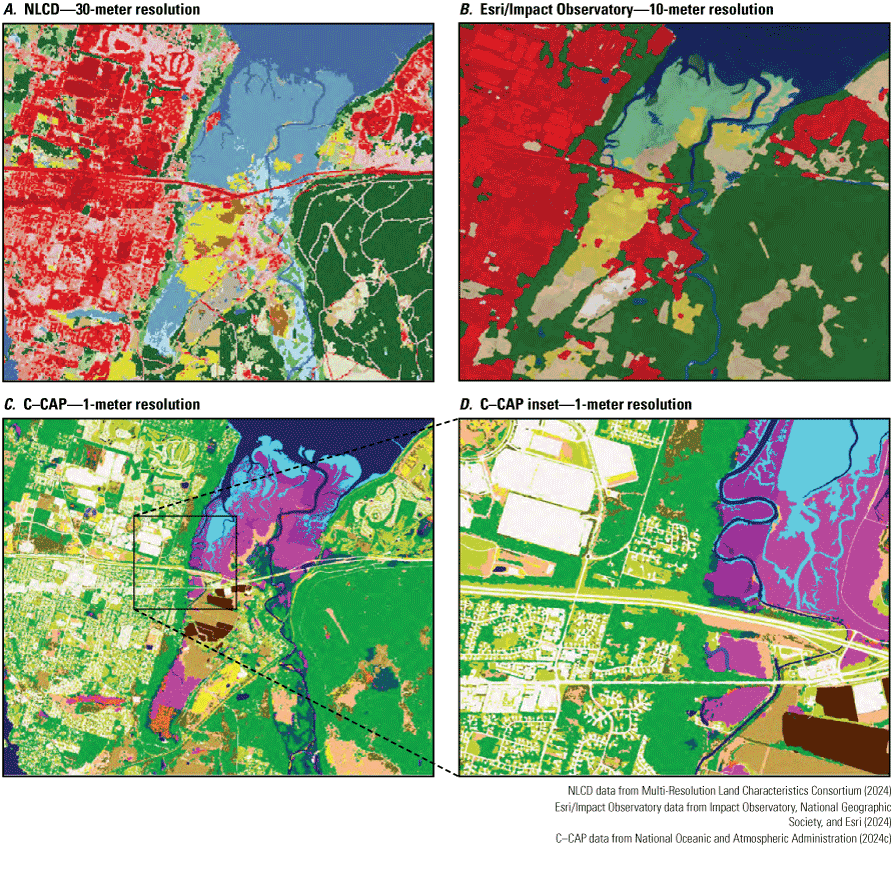
Images showing a spatial resolution comparison among multiple land cover products available for the United States. (A) The National Land Cover Database (NLCD), based on Landsat data, provides the lowest nominal spatial resolution at 30 meters (Multi-Resolution Land Characteristics Consortium, 2024). (B) The Sentinel-2 based Esri/Impact Observatory land cover data are nominally at 10-meter resolution, but processing methodologies result in a product with an effectively coarser minimum mapping unit than the NLCD (Impact Observatory and others, 2024). The NLCD seems to consistently represent more spatial detail than the nominal 10-meter-resolution Esri/Impact Observatory, WorldCover, and Dynamic World global products. (C) The Coastal Change Analysis Program (C–CAP) high-resolution land cover data, with a 1-meter resolution, are only available for select geographies of the United States (National Oceanic and Atmospheric Administration, 2024b). (D) An inset of the C–CAP scene with a 1-meter resolution clearly shows more detailed landscape features than the Landsat- and Sentinel 2-based products (National Oceanic and Atmospheric Administration, 2024b).
Note that multiple commercial entities offer on-demand production and access of high-resolution land cover products, typically at a substantial cost and with limited geographic coverage. These products are not evaluated here.
Temporal Coverage and Frequency
When the MRLC began in the mid-1990s, producing national-scale maps with single-year data releases was a challenge. Three decades later, data producers now have access to more data, new algorithms, and new cloud computing environments. For many products produced today, the frequency of temporal time steps has increased along with longer temporal coverage, or range of years in a time series.
Existing products vary widely in temporal characteristics, in terms of the temporal frequency and temporal coverage. In general, federally produced data products have a longer legacy and often offer a better representation of long-term change. For example, the FIA and NRI have a long history of data collection and robust sampling and revisit strategies that offer long-term representation of landscape change. Remote-sensing-based approaches using Landsat also offer longer term retrospective analysis of landscape change; projects such as LCMAP, LCMS, and RCMAP all provide data on more than 35 years of U.S. landscape change. Conversely, newer global products based on Sentinel-2 data are limited to less than the last 10 years, which coincides with the historical availability of Sentinel-2 data. The community for moderate-resolution (30-meter) maps is converging on annual product lines with annual releases of new data, which can be ideal for depicting short-term and long-term change.
Each product was developed for an intended use. Being aware of this can help a user select the product that best fits their needs. For example, LCMAP, LCMS, RCMAP, and LANDFIRE data all provide annually updated data; however, LCMAP, LCMS, and RCMAP were designed to monitor changes over long periods and are most suited for use in applications that assess landscape change effects and trends. These products are also best suited for evaluation of long-term (multidecadal) climate effects on the landscape. LANDFIRE data products, conversely, are primarily designed to provide the best data possible for current conditions for wildfire and smoke models but are not focused on representing long-term trends. Mapping methodology also matters in terms of being able to accurately discriminate landscape change. Products such as LCMAP, LCMS, RCMAP, NLCD, FIA, and NRI use methodologies meant to better characterize and quantify change on the landscape, and products that use post-classification comparison (comparing two independently produced land cover products for change) are generally much less effective at accurately depicting change (Serra and others, 2003; Gómez and others, 2016). Subtle changes can happen slowly over decades or centuries; therefore, monitoring long-term change, including land cover type conversions and land condition change, requires consistently calibrated science, quality data, and continuous operational programs such as Landsat to ensure the precise and consistent observations representing true change of the Earth’s surface.
Thematic Resolution
Thematic resolution of U.S. land cover products is a legacy of product history and purpose, as well as source data, and constrains the classes that can reasonably be extracted. For example, LCMAP land cover data provide a basic thematic classification system of eight classes. The goal of LCMAP is to assess landscape change over longer periods, and the ability to accurately discern change declines as thematic complexity increases. Conversely, LANDFIRE has a high number of classes in its EVT/Ecological Systems layer, given the need to attribute rates of fire spread and flame lengths to different vegetation types. The Gap Analysis Program uses LANDFIRE’s ecological system vegetation types to improve assessments of habitat condition and biodiversity. The LCMS is designed to distinguish between land cover and land use, so it uses a second system of classification.
From a user perspective, the suite of available U.S. land use and land cover products offers choices to users who must weigh considerations of available spatial, temporal, and thematic resolution and acceptable accuracy and uncertainty. Differences in thematic definition can be difficult for users to understand and can confound the ability to directly compare different datasets. Standard thematic classification frameworks are available to guide development of land cover and land use products such as the hierarchical Land Cover Classification System developed by the Food and Agricultural Organization of the United Nations (Di Gregorio and Jansen, 2000) or standards for remote-sensing applications from the Committee on Earth Observation Satellites Agriculture, Forestry, and Other Land Use committee (Ochiai and others, 2023). The U.S. NVC provides detailed vegetation classes nested within more general land cover types (such as forest and woodlands). The U.S. NVC standards were designed as a consistent and common language to allow Federal partners to produce uniform comparisons on vegetation resources across all lands and jurisdictions (Federal Geographic Data Committee, 2008). Although standard classification frameworks can improve consistency and interoperability among datasets, they also can restrict the development of unique classification systems tailored to address a specific application. What follows are some of the most difficult and confounding issues of thematic land use and land cover classification for data developers and users of land cover data.
Grassland/hay/pasture.—Land cover products typically represent a grassland class equivalent, although the definition and composition of that class can vary widely among products. From a data producer perspective, the subtle differences in management intensity from natural grassland with minimal human intervention aside from grazing, a moderate degree of management on pasture land, and often heavily managed hay land are challenging to map from remote-sensing imagery alone because the spectral characteristics of each are generally similar. The distinction often lies more with land use and land management than land cover. As a result, satellite-based products that do attempt to discriminate among various grass cover use classes often reported lower accuracy for those classes given the difficulty of differentiating the classes based on remote-sensing imagery (Wickham and others, 2021, 2023). However, management and use of grassland covers have a large effect on biodiversity, carbon and greenhouse gases, hydrology, and other ecological processes, making it desirable to distinguish among grassland use classes when possible.
From a user perspective, care is warranted in accounting for a product’s definition of a grassland class because some systems may distinguish between seminatural grasslands and more heavily managed lands and others may combine them under one thematic label. Some products with simpler thematic classification frameworks such as LCMAP, Esri/Impact Observatory land cover, WorldCover, Dynamic World, and others further confound the issue by combining grassland and shrubland into a grass/shrub or generic rangeland category, which potentially results in substantially different reported areal amounts and (or) locations for the similarly labeled grassland among products.
Forest.—As with grasslands, different forest types, conditions, and management and use on forest land have a large effect on biodiversity, carbon and greenhouse gases, hydrology, and other ecological processes, making it desirable to distinguish among the many defining characteristics of forests. Many forest land definitions blend use and cover. Temporal and land use considerations along with precise thresholds of canopy cover density, spatial arrangement, temporal extent, height, and (or) species in forest definitions vary widely among products.
Among the U.S. Federal land use and land cover products, existing forest cover is not always equivalent to forest land use. Most moderate-resolution national (for example, NLCD, LCMAP, LCMS [land cover]) and global products classify forest types (usually one to three classes) based on existing dominant vegetation cover. For example, agriculture, forestry, fire, or other activities that affect the dominant forest vegetation cover will result in that area being reclassified to a new cover type (for example, forest to grass after a harvest). However, these same products confound cover and use by exclusively categorizing urban land use into urban or developed classes, even if extensive forest cover exists. The FIA, NRI, and LCMS (land use) use blended land use and land cover forest land definitions and consider potential or historical vegetation resulting in a more stable forest land definition. The FIA tree data offer forest types and structure variables that complement MRLC data such as NLCD’s tree canopy cover and LANDFIRE’s existing cover density and vegetation height. For some users, structure data may complement or even be more valuable than coarse thematic classifications.
Given the variability in how forest is defined, potentially substantial differences exist among datasets in reported and mapped coverage of forest. Nelson and others (2020) demonstrate the confounding and complementary effects on forest land area estimates from using different products. Given the large effects persistence and changes in forest type, extent, and condition can have on applications such as carbon accounting, users need to carefully consider the land use and land cover product’s basis for forest thematic labels. MRLC data indicate how combining sample-based and remote-sensing-based data products from multiple sources can provide a well-informed characterization of forest condition, particularly if measures of forest type, coverage, and structure are coupled.
Wetlands.–As with grassland and forest classes, definitions of wetland can vary widely among products. A confounding issue for wetlands mapping and classification is the dynamic, often ephemeral, condition (for example, inundation and soil moisture) of many wetlands over time, and annual and even seasonal differences in condition result in very different measurements by remote-sensing platforms. Depending on seasonal conditions, a wetland may present as primarily open water or as complete vegetative cover. Wetlands thus are generally characterized and mapped by overall hydrologic regime rather than a true land cover type (Gallant, 2015). Given the definitional nuances of what is a wetland, different mapping approaches among land cover datasets, and the dynamic nature of wetland appearance, mapped wetland extent (and thematic class) can vary widely across products. The NWI addresses the wide variation in wetland characteristics by including numerous classes (5,000+), including information on water level variability through time. This allows users, including members of MRLC, to tailor the range of NWI classes that they use to meet their unique needs.
For applications where wetland delineation is a critical factor, two of the products identified previously are likely the most appropriate for use. The FWS has had responsibility for the NWI program for 50 years with the purpose of providing geospatial data on the extent and status of U.S. wetlands. With a dedicated focus on wetlands and increased thematic detail, the NWI likely offers improved wetland delineation over most products, although it lacks a multitemporal component. Instead, the NWI program tracks wetland change through its decadal wetlands status and trends reports to Congress. NOAA’s C–CAP data, where available (U.S. coastal zones), are another option for wetland delineation. C–CAP provides better thematic definitions of wetland types than most other products and has a focus on accurate delineation of coastal zone wetlands. Unlike the NWI, C–CAP data also provide information on change over time.
Urban/developed.—Most land cover products described here have one or more urban or developed classes. The thematic classification of urban/developed is complex and challenging because (1) urban areas represent a variety of actual surface covers with extremely variable spectral response, and (2) feature size may be a challenge for moderate-resolution sensors. Given the complexity of covers that may be detected in an urban setting (for example, concrete, asphalt, buildings, grass, trees), a thematic label of urban/developed is more a label of land use than land cover; however, although covering a small part of the total U.S. landscape, urban/developed lands have strong effects on many ecological processes.
As with other thematic classes described previously, definitions of what constitutes urban/developed can vary widely. For land cover products with a single urban/developed class (LCMAP, WorldCover, LCMS, and so on), areas classified as “urban/developed” could include anything from high-density urban centers consisting primarily of impervious surfaces to low-density residential lands where most of the landscape may be lawns, trees, and other vegetated surfaces. On the other hand, the NLCD differentiates urban land use intensity based on general thresholds of imperviousness with four distinct urban classes. Imperviousness data provide valuable complementary information with thematic land cover or may be more valuable than thematic land cover for applications such as hydrology where imperviousness drives runoff and hydrologic processes. MRLC and other federally produced data generally provide a better representation of urban/developed lands than global products with U.S. coverage and can also offer long-term trends (for example, LCMAP and NLCD).
Data Latency/Recency
Whether a project is focused on representing current conditions (for example, LANDFIRE) or characterizing long-term change (for example, LCMAP or RCMAP), the U.S. landscape is changing, and the products outlined here require periodic updates. The first NLCD took several years to produce (Vogelmann and others, 2001) and had update cycles that also were measured in multiple years (Homer and others, 2012); today, however, latency in data production has dropped substantially, and as noted previously, most moderate-resolution land use and land cover products are converging on annual data releases. The speed of release and recency of data still vary widely across projects. In general, thematic land cover changes slowly across the landscape (for example, averaging between 1 and 2 percent annually for thematic classes represented by the NLCD). Given the generally slow rate of change, the need for recency will vary by application.
The update strategy also varies across products; some products are focused on change-based updates, and others are focused on complete remapping for the most recent product version. Each approach has its advantages and disadvantages. Product lines such as RCMAP, LCMAP, LCMS, and the reworked NLCD tree canopy cover were developed with a collections approach, where with each new data release that incorporates substantial science advances or reprocessing of the Landsat archive, the entire time series is reprocessed. These products optimize for temporal coherency, a key component of environmental monitoring data that is critical for temporal trend analysis and yields fewer anomalies only because of methodological changes between product release dates; however, this approach may require longer latency from end of image acquisition to data release. Also, although a collections approach is designed to improve baseline products with each new collection, it may challenge some user communities if a new time-series record exists every few years by implying that older analysis is no longer current or is superseded by newer data.
Another example in MRLC is LANDFIRE’s releases of new data for the fire community—biennially since 2008 and annually since 2022. Additionally, LANDFIRE releases four seasonal adjustments to fuels in the Southwest and Great Basin along with daily adjustments in the Southeast. LANDFIRE concentrates on reduced latency to provide the most relevant data to users as soon as possible rather than consistency through time because this approach best meets the tactical and strategic needs of the fire and natural resources community. As with other data characteristics, users need to balance application needs when assessing a product’s recency and latency of delivery.
Accuracy
A basic premise of land cover mapping is that an inverse correlation between geographic scope (area) and local-level accuracy generally exists (Strahler and others, 2006). Tailored products covering smaller geographic areas typically demonstrate higher accuracy than broader scale products that offer overlap coverage. As such, it would be expected that the U.S.-specific land cover products offer a higher level of accuracy within the boundaries of the United States than global land cover products that are aimed at global coverage and applications. Comparisons of two USGS land-change monitoring datasets (NLCD and LCMAP) to global land cover products do back this premise, and NLCD and LCMAP indicate generally higher individual class accuracies and accuracy variability across classes than global products with U.S. coverage (Wang and Mountrakis, 2023).
Products also differ in terms of basic availability of accuracy information and the level of detail that is provided. Product validation/reference datasets and accompanied accuracy assessments can be expensive to generate but are critical. In general, U.S. federally produced land use and land cover datasets, as official FGDC NGDA datasets, offer improved characterization of data accuracies and uncertainties than most other products. Detailed information on class-by-class accuracy is often available and is often characterized at multiple spatial scales. For example, NLCD products are associated with many peer-reviewed publications that characterize accuracy at multiple scales (for example, Wickham and others [2020, 2021, 2023]). LCMAP provides detailed accuracy information over time, quantified with an extensive database of more than 27,000 reference data points that are also available for public download (Pengra and others, 2020, 2023a; Stehman and others, 2021). LANDFIRE provides accuracy assessments of the EVT–Ecological Systems and EVT–NVC group and macrogroup. The ESA also completed a rigorous validation of the global WorldCover product, yet accuracy measurement is limited to continental scales and baseline accuracy is available only in aggregate for all of North America (Tsendbazar, 2022). An independent basic accuracy assessment for the WorldCover, Esri Land Cover, and Dynamic World global products was also produced but only characterizes basic per-class accuracy at global and continental scales with aggregate accuracies reported for all of North America (Venter and others, 2022).
Uncertainty
Uncertainty is typically systematically documented in U.S. federally produced products, and class confidence (for example, LCMAP) and sampling uncertainties (for example, NRI and FIA) provide information on land use and land cover label uncertainties. FIA inventories are commonly designed to meet the specified sampling errors at the State level at the 67-percent confidence limit and are mandated that the sampling error for area cannot exceed 3-percent error per 1 million acres of timberland. The combined suite of all available land use and land cover data available for the United States provides additional yet largely untapped information on uncertainty. Ensemble approaches are an accepted practice in accounting for uncertainties in future climate conditions, using a convergence of evidence paradigm that reduces error and bias from any one model. The breadth of land use and land cover data available for the United States facilitates similar treatment of uncertainty, yet no current operational efforts are underway (as of May 2024) to characterize uncertainty across products or develop consensus land use and land cover maps for the United States.
Data Compatibility/Consistency
The variety of data products offered is a key feature of the MRLC in supporting the user community; however, challenges in the production of a suite of land-change products includes (1) maintaining consistency and (or) hierarchical nesting of multiple products and (2) introducing the potential confusion among users as to the right dataset to use for a given application. MRLC products offer some advantages in product consistency and helping a user determine the right product for use. Producers of MRLC and other Federal products made efforts to leverage MRLC products as input, but not all are hierarchical and intertwined because the intended purposes may differ and have led to products with different spatial, temporal, and thematic characteristics. However, many products are linked and have source data and thematic data that are leveraged in the coproduction of each other.
As noted previously, even among MRLC products, inconsistencies do exist. To address inconsistencies, the USGS merged LCMAP and NLCD product lines with a next-generation annual NLCD that includes the higher thematic detail of the NLCD (16 land use and land cover classes for the conterminous United States) with the temporal characteristics of LCMAP (annual time steps from 1985 to 2021). This new generation NLCD product suite supports monitoring of greenhouse gas emissions and climate effects from natural systems, with coverage from 1985 through 2023, combined with the annual updates going forward to capture emissions that are in pulses. The FS is also working towards maturing the LCMS and consistencies with the USDA RAP product lines as it continues to support its responsibilities in reporting greenhouse gas emissions. Preliminary discussions are underway among MRLC partners to revisit the original intention of the consortium with a true multiresolution product suite that more fully meets needs of the user community and ideally has hierarchical, nested products at multiple temporal and thematic scales.
Of note, a complete nesting of data may not be desired by many users. For example, the NLCD tree canopy cover and NLCD impervious cover are produced separately without nesting or hierarchical dominance. This allows users to calculate metrics of canopy over impervious surfaces using these two products, which is an important feature in urban and community forestry. Whether the land use and land cover products described here nest fully or not, users can consider them complementary and having a combined suite of characteristics that better meets the needs of the whole community than any one product could alone.
Legacy/History
The first NLCD for the United States was begun in the early 1990s and had continuous, periodic updating of national-scale land cover continuing to the present day. Other federally produced products offer a similar commitment to long-term maintenance and improvement in baseline land-change monitoring products. Other one-off, non-Federal land-change monitoring products have been occasionally produced at regional, national, and even global scales, but without the benefits of a long-term, operational land-change monitoring strategy, no assurance of continuous, consistent, updated product availability exists.
Beyond Thematic Land Cover
Thematic land cover remains the most widely mapped landscape variable, for global geospatial products and for products developed solely for the United States. Most global products in table 2 provide land cover only, although the ESA augments their WorldCover thematic land cover product with a global impervious product and global tree cover density. However, geospatial products that provide additional value, transparency, and information domains to traditional thematic classifications are finally becoming feasible to produce at the necessary thematic (including continuous), temporal, and spatial scales. The breadth of land-change variables provided by the MRLC augments basic thematic land cover with products such as percentage of impervious cover, tree cover density, rangeland vegetation components, disturbance attributes, structural vegetation information (for example, vegetation height), and land use and land cover probability classes. Not only do these products provide stand-alone information that thematic land cover data alone cannot, but they also empower users to customize their own thematic labels in accordance with the needs for their specific application (for example, categorizing vegetation classes by thematic land cover and vegetation structure).
Future Directions and Considerations
Since NLCD produced the first national scale, Landsat-based land cover product in the 1990s, the number and breadth of land use and land cover applications has grown substantially. Overall, this has improved information availability to a broad user community, yet user needs are still not being met in some vital areas. What follows are potential next steps for the land-change monitoring community, with a focus on (1) development of a national land use product, (2) developing models for historical backcasting and future forecasting, and (3) improving coordination and collaboration among Federal agencies.
National Land Use Product
About three-fourths of the world’s land surface has been directly or indirectly altered by human activities over the last millennium (Luyssaert and others, 2014), signaling the need for up-to-date land use map products at the national scale. Multiple MRLC and other Federal products have mixed land cover and land use elements, and the LCMS even provides a separate, basic seven-class land use product (with substantial overlap with other MRLC products). Customized land use maps at city or municipal levels exist, mostly through commercial providers with a cost, to meet specific resource management and planning needs at the local level. However, none provide sufficient detail or spatial coverage on land use that consistently satisfies broad national needs, such as supporting natural capital accounting or carbon accounting. The MRLC has long been the Nation’s leader in the production of consistent, accurate, national-scale land cover data with limited explicit mapping of land use. A new national-scale land use product would augment the long-term land-change monitoring core capability of the United States and provide critical information for carbon and greenhouse gas assessment, the National Climate Assessment, national natural capital accounting, and many other regional- to national-scale applications requiring data tying the landscape to the purposed human use. Given the diverse potential applications of a land use product, development ideally would be rooted in user and stakeholder requirements. A national land use product harmonized with existing land cover products would ensure consistency of land cover and land use products for scientists, land managers, policy makers, and other decision makers.
The land use product ideally would characterize major land use types including residential, business, and industrial use, recreational lands, transportation routes, and energy use. The classification system would be hierarchical and have U.S. land uses mapped into broad categories that include urban/built-up, recreational, production, and conservation lands. Where possible, land management attributes would be assigned (for example, differentiating between rainfed and irrigated croplands) with the hierarchical classification scheme potentially capturing multiple facets of human land use and land management; however, the identification of land management classes is often challenging. For example, the management of wetland hydrology (for example, inundation) is typically difficult to detect by tile drainage and the extraction of water via wells. Because of the importance of wetland hydrology in determining ecosystem functions, including carbon sequestration and emission, including related management classes in the future would be beneficial. The land use dataset could nest with the MRLC land cover dataset as appropriate, ensuring consistency and providing a powerful, comprehensive database of U.S. land condition and change.
Beyond Monitoring—Modeling Past Trends and Future Conditions
Remote sensing provides the foundation for U.S. land-change mapping and monitoring efforts outlined here, yet these data have limited temporal availability. Operational mapping land-change monitoring activities in the United States have typically been limited to the early to mid-1980s as the earliest historical date given the availability of consistent 30-meter-resolution Landsat data since that time. Modeling approaches are increasingly being used to generate longer term land cover time series and have historical and projected future land cover that allows scientists, decision makers, and other stakeholders the ability to assess the past to help understand and plan for the future. U.S. projections of future land cover change are available from multiple sources, and most use a scenario framework to capture uncertainty and multiple potential futures. A variety of spatially coarse land use scenarios are used by the Intergovernmental Panel for Climate Change to assess feedback with climate and other biophysical and socioeconomic drivers of change (Popp and others, 2017; Doelman and others, 2018; Chen and others, 2020). These datasets provide global coverage and consistency with well-vetted scenario frameworks used by the Intergovernmental Panel for Climate Change and others, yet coarse spatial resolutions and sometimes questionable local accuracies and relevance at U.S. national or regional scales limit their utility for many applications (Sohl and others, 2016). MRLC partners have produced higher resolution and more U.S.-relevant focused projections, including those associated with the Forest and Rangeland Renewable Resources Planning Act on a periodic basis by the FS (Wear and Prestemon, 2019; Brooks and others, 2023; Mihiar and others, 2023) and the USGS’s Forecasting Scenarios of Land-Use Change projections (Sohl and others, 2019; Dornbierer and others, 2021).
Although invaluable for planning, mitigation, and adaptation purposes, consistent, stakeholder-relevant land use projections are still far less developed than remote-sensing-based land-change monitoring. A strong divergence exists in overall proportions and spatial patterns of land cover change among different models and approaches, even when different parties attempt to model the same general land use scenario (Sohl and others, 2016). Additional efforts are necessary to operationalize and harmonize stakeholder-relevant land use projections across Federal and external products.
Improving Coordination and Collaboration Among Agencies
The need and opportunity for collaboration among agencies for integrated geospatial data products are higher than ever. The MRLC Consortium’s data producers have been working towards this goal for decades. The MRLC serves as a collaborative structure for the development of U.S. land-change mapping and monitoring data; however, data producers may be constrained to certain product characteristics by factors such as project legacy, targeted application focus and stakeholder needs, mapping methodologies, and (or) funding.
Frequently, inherent tradeoffs are to be considered (for example, the tradeoff between a longer period of record from 30-meter Landsat and a shorter period of record but higher spatial resolution from 10-meter Sentinel-2). Product variability can be a strength (for example, different measurement variables of landscape change that might be tailored for different applications), but a lack of consistency can cause confusion for users. Improvements can be made in cross-agency collaboration and product consistency, including the following:
-
1. Spatial resolution—Development of multiresolution product suites to support a variety of applications including nationally consistent moderate-resolution land cover coupled with nested high-resolution products for targeted geographic and (or) thematic areas.
-
2. Spatial characteristics—Common map projections, overlapping spatial coverage and extent, and nested raster grids for facilitated development of multiresolution products.
-
3. Temporal extent—Strategic approach for harmonized temporal coverage across agencies, ensuring a consistent, thorough representation of past, current, and potential future landscape conditions.
-
4. Thematic definitions—Harmonized thematic definitions with nested hierarchical classification schemes where relevant.
-
5. Input source data—Repository of harmonized common imagery and training data for all programs to use in different classification models.
-
6. Multidimensional data products—Using lidar, radar, and other multimodal sources in a machine learning environment to map and monitor structural variation and biomass more accurately in different vegetation types for carbon, habitat, and fire applications.
-
7. Accuracy and uncertainty assessment—Shared or coordinated approaches and expertise on collection and application of reference data for validation where feasible.
-
8. Model optimization—Standardization and optimization of classification models across Federal agencies, improving efficiencies in cost and product latency.
-
9. Distribution, visualization, and analysis—Shared data and information distribution, along with shared stakeholder-driven visualization and analysis tools.
-
10. Metadata and user support—Harmonized metadata and user support with guidance for users across the portfolio of Federal products.
Summary
Land use and land cover data are a foundational data product used for countless applications, by Federal, State, and local governments, private industry, academia, and nongovernmental organizations. Federal land use and land cover products is crucial for a continuous national monitoring framework for decision making and informing policy implementation, such as supporting the U.S. Greenhouse Gas Center (https://earth.gov/ghgcenter) and the national strategy to advance an integrated U.S. Greenhouse Gas Measurement, Monitoring, and Information System. For more than 30 years since its inception, the Multi-Resolution Land Characteristics Consortium and Federal programs have provided science quality national authoritative land cover and land use information products to the Nation, supporting the monitoring, inventory, and management of natural resources. Collectively, these federally produced land use and land cover products leverage each other’s unique strength to improve efficiency of product generation and quality, thereby setting the standards for operational and scientific use for a variety of applications. The breadth and depth of these products span a range of spatial, temporal, and thematic resolutions that document the most recent condition and past trends of land cover, land use, and land use and land cover change. Increasingly, additional land use and land cover products are being produced and distributed by developers outside of the U.S. Federal government, each with their own unique characteristics.
Developers of these products strive to meet evolving user needs by continuously incorporating new data sources and techniques to provide better and increasingly accurate characterization of land cover. Federal products, particularly those produced by the MRLC, have interconnections that improve interoperability among products. However, Federal agencies have various areas in which they can coordinate to provide improved land cover and land use data, information that can feed into applications such as characterizing changing greenhouse gas sources and sinks.
The user community has many considerations when deciding which product would be the most appropriate for a particular need. There is no one “right” land cover product applicable for a given application; the breadth of available products thus provides a user with a variety of choices. Choice of product and how that product can be used is application specific, and can be judged based on several criteria including (1) spatial coverage and resolution, (2) temporal coverage and frequency, (3) thematic resolution, (4) data latency/recency, (5) accuracy, (6) uncertainty, (7) data compatibility/consistency, (8) legacy/history, and (9) products beyond thematic land cover.
While the availability of a broader array of land use and land cover products has improved choice and applicability for the stakeholder community, there are several areas for potential improvement. The development of a national land use product harmonized with existing land cover products would ensure consistency of land cover and land use products for scientists, land managers, policy makers, and other decision makers. New modeling approaches can be used to generate longer-term land use and land cover time series that go beyond the remote sensing record, providing historical and future land cover that allows scientists, decision makers, and other stakeholders the ability to assess the past to help understand and plan for the future. Finally, improvements can be made in cross-agency collaboration and product consistency, improving interoperability and information content above currently available products.
References Cited
Ager, A.A., Day, M.A., Ringo, C., Evers, C.R., Alcasena, F.J., Houtman, R.M., Scanlon, M., and Ellersick, T., 2021, Development and application of the fireshed registry: Fort Collins, Colo., U.S. Department of Agriculture, Forest Service, Rocky Mountain Research Station, General Technical Report RMRS–GTR–425, 47 p., accessed June 1, 2024, at https://doi.org/10.2737/RMRS-GTR-425.
Anderson, J.R., Hardy, E.E., Roach, J.R., and Witmer, R.E., 1976, A land use and land cover classification system for use with remote sensor data: U.S. Geological Survey Professional Paper 964, 28 p. [Revision of Circular 671; https://doi.org/10.3133/pp964.]
Austin, K.G., Jones, J.P.H., and Clark, C.M., 2022, A review of domestic land use change attributable to U.S. biofuel policy: Renewable and Sustainable Energy Reviews, v. 159, article 112181, 13 p., accessed June 1, 2024, at https://doi.org/10.1016/j.rser.2022.112181.
Bechtold, W.A., and Patterson, P.L., eds., 2005, The enhanced Forest Inventory and Analysis program—National sampling design and estimation procedures: Asheville, N.C., U.S. Department of Agriculture, Forest Service, Southern Research Station, General Technical Report SRS–80, 98 p. [Also available at https://www.srs.fs.usda.gov/pubs/gtr/gtr_srs080/gtr_srs080.pdf.]
Bhattarai, R., Rahimzadeh-Bajgiran, P., and Weiskittel, A., 2022, Multi-source mapping of forest susceptibility to spruce budworm defoliation based on stand age and composition across a complex landscape in Maine, USA: Canadian Journal of Remote Sensing, v. 48, no. 6, p. 873–893, accessed June 1, 2024, at https://doi.org/10.1080/07038992.2022.2145460.
Boryan, C.G., and Yang, Z., 2017, Integration of the cropland data layer based automatic stratification method into the traditional area frame construction process: Survey Research Methods, v. 11, no. 3, p. 289–306, accessed June 1, 2024, at https://doi.org/10.18148/srm/2017.v11i3.6725.
Boryan, C., Yang, Z., and Di, L., 2012, Deriving 2011 cultivated land cover data sets using USDA National Agricultural Statistics Service historic Cropland Data Layers, in 2012 IEEE International Geoscience and Remote Sensing Symposium [Proceedings], Munich, Germany, July 22–27, 2012: New York, Institute of Electrical and Electronics Engineers, p. 6297–6300, accessed June 1, 2024, at https://doi.org/10.1109/IGARSS.2012.6352699.
Boryan, C.G., Yang, Z., and Willis, P., 2014, US geospatial crop frequency data layers, in The Third International Conference on Agro-Geoinformatics, Beijing, China, August 11–14, 2014: New York, Institute of Electrical and Electronics Engineers, p. 1–5, accessed June 1, 2024, at https://doi.org/10.1109/Agro-Geoinformatics.2014.6910657.
Brooks, E.B., Coulston, J.W., Riitters, K.H., and Wear, D.N., 2023, Spatial realizations of county-level land use projections for the conterminous United States, 2020–2070, used in the 2020 RPA assessment: Fort Collins, Colo., Forest Service Research Data Archive database, accessed June 1, 2024, at https://doi.org/10.2737/RDS-2023-0015.
Brown, C.F., Brumby, S.P., Guzder-Williams, B., Birch, T., Hyde, S.B., Mazzariello, J., Czerwinski, W., Pasquarella, V.J., Haertel, R., Ilyushchenko, S., Schwehr, K., Weisse, M., Stolle, F., Hanson, C., Guinan, O., Moore, R., and Tait, A.M., 2022, Dynamic World, near real-time global 10 m land use land cover mapping: Scientific Data, v. 9, article 251, 17 p., accessed June 1, 2024, at https://doi.org/10.1038/s41597-022-01307-4.
Brown, J.F., Tollerud, H.J., Barber, C.P., Zhou, Q., Dwyer, J.L., Vogelmann, J.E., Loveland, T.R., Woodcock, C.E., Stehman, S.V., Zhu, Z., Pengra, B.W., Smith, K., Horton, J.A., Xian, G., Auch, R.F., Sohl, T.L., Sayler, K.L., Gallant, A.L., Zelenak, D., Reker, R.R., and Rover, J., 2020, Lessons learned implementing an operational continuous United States national land change monitoring capability—The Land Change Monitoring, Assessment, and Projection (LCMAP) approach: Remote Sensing of Environment, v. 238, article 111356, 18 p., accessed June 1, 2024, at https://doi.org/10.1016/j.rse.2019.111356.
Bureau of Land Management, 2021, AIM National Aquatic Monitoring framework—Field protocol for wadeable lotic systems (ver. 2): Denver, Colo., Department of the Interior, Bureau of Land Management Technical Reference 1735–2, 142 p., accessed June 1, 2024, at https://www.blm.gov/sites/default/files/docs/2021-03/AIM%20National%20Aquatic%20Monitoring%20Framework%2C%20Field%20Protocol%20for%20Wadeable%20Lotic% 20Systems%2C%20TR1735-2.pdf.
Bureau of Land Management, 2024a, AIM National Aquatic Monitoring framework—Field protocol for lentic riparian and wetland systems: Denver, Colo., Department of the Interior, Bureau of Land Management Technical Reference 1735–3, 216 p., accessed June 1, 2024, at https://www.blm.gov/noc/blm-library/technical-reference/aim-national-aquatic-monitoring-framework-field-protocol-lentic.
Bureau of Land Management, 2024b, Assessment, Inventory, and Monitoring (AIM): Bureau of Land Management digital data, accessed June 1, 2024, at https://gbp-blm-egis.hub.arcgis.com/pages/aim.
Carter, S.K., Burris, L.E., Domschke, C.T., Garman, S.L., Haby, T., Harms, B.R., Kachergis, E., Litschert, S.E., and Miller, K.H., 2021, Identifying policy-relevant indicators for assessing landscape vegetation patterns to inform planning and management on multiple-use public lands: Environmental Management, v. 68, no. 3, p. 426–443, accessed June 1, 2024, at https://doi.org/10.1007/s00267-021-01493-8.
Chen, M., Vernon, C.R., Graham, N.T., Hejazi, M., Huang, M., Cheng, Y., and Calvin, K., 2020, Global land use for 2015–2100 at 0.05° resolution under diverse socioeconomic and climate scenarios: Scientific Data, v. 7, article 320, 11 p., accessed June 1, 2024, at https://doi.org/10.1038/s41597-020-00669-x.
Comer, P., Faber-Langendoen, D., Evans, R., Gawler, S., Josse, C., Kittel, G., Menard, S., Pyne, M., Reid, M., Schulz, K., Snow, K., and Teague, J., 2003, Ecological systems of the United States—A working classification of U.S. terrestrial systems: Arlington, Va., NatureServe, 75 p. [Also available at https://www.natureserve.org/sites/default/files/pcom_2003_ecol_systems_us.pdf.]
Crockett, E.T.H., Atkins, J.W., Guo, Q., Sun, G., Potter, K.M., Ollinger, S., Silva, C.A., Tang, H., Woodall, C.W., Holgerson, J., and Xiao, J., 2023, Structural and species diversity explain aboveground carbon storage in forests across the United States—Evidence from GEDI and forest inventory data: Remote Sensing of Environment, v. 295, article 113703, 15 p., accessed June 1, 2024, at https://doi.org/10.1016/j.rse.2023.113703.
Diao, J., Liu, J., Zhu, Z., Li, M., and Sleeter, B.M., 2020, Substantially greater carbon emissions estimated based on annual land-use transition data: Remote Sensing, v. 12, no. 7, article 1126, accessed June 1, 2024, at https://doi.org/10.3390/rs12071126.
Doelman, J.C., Stehfest, E., Tabeau, A., van Meijl, H., Lassaletta, L., Gernaat, D.E.H.J., Hermans, K., Harmsen, M., Daioglou, V., Biemans, H., van der Sluis, S., and van Vuuren, D.P., 2018, Exploring SSP land-use dynamics using the IMAGE model—Regional and gridded scenarios of land-use change and land-based climate change mitigation: Global Environmental Change, v. 48, p. 119–135, accessed June 1, 2024, at https://doi.org/10.1016/j.gloenvcha.2017.11.014.
Dornbierer, J., Wika, S., Robison, C., Rouze, G., and Sohl, T., 2021, Prototyping a methodology for long-term (1680–2100) historical-to-future landscape modeling for the conterminous United States: Land, v. 10, no. 5, p. 536, accessed June 1, 2024, at https://doi.org/10.3390/land10050536.
Dwyer, J.L., Roy, D.P., Sauer, B., Jenkerson, C.B., Zhang, H.K., and Lymburner, L., 2018, Analysis ready data—Enabling analysis of the Landsat archive: Remote Sensing, v. 10, no. 9, article 1363, 19 p., accessed June 1, 2024, at https://doi.org/10.3390/rs10091363.
Federal Geographic Data Committee, 2008, National Vegetation Classification Standard (ver. 2): Washington, D.C., Federal Geographic Data Committee, Vegetation Subcommittee, FGDC–STD–005–2008, 55 p., plus appendices, accessed June 1, 2024, at https://www.fgdc.gov/standards/projects/FGDC-standards-projects/vegetation/NVCS_V2_FINAL_2008-02.pdf/.
Forest Service, 2023, Future of America’s forest and rangelands—Forest Service 2020 Resources Planning Act assessment: Washington, D.C., U.S. Department of Agriculture, Forest Service General Technical Report WO–102, 348 p., accessed June 1, 2024, at https://doi.org/10.2737/WO-GTR-102.
Forest Service, 2024a, Forest Inventory and Analysis Database (FIADB) Online: U.S. Department of Agriculture digital data, accessed June 1, 2024, at https://apps.fs.usda.gov/fia/datamart/.
Forest Service, 2024b, Landscape Change Monitoring System: U.S. Department of Agriculture digital data, accessed June 1, 2024, at https://apps.fs.usda.gov/lcAms-viewer/home.html.
Gallant, A.L., 2015, The challenges of remote monitoring of wetlands: Remote Sensing, v. 7, no. 8, p. 10938–10950, accessed June 1, 2024, at https://doi.org/10.3390/rs70810938.
Gibbs, J.P., 2000, Wetland loss and biodiversity conservation: Conservation Biology, v. 14, no. 1, p. 314–317, accessed June 1, 2024, at https://doi.org/10.1046/j.1523-1739.2000.98608.x.
Gigliotti, L.C., Atwood, M.P., Cole, E.K., Courtemanch, A., Dewey, S., Gude, J.A., Hurley, M., Kauffman, M., Kroetz, K., Leonard, B., MacNulty, D.R., Maichak, E., McWhirter, D., Mong, T.W., Proffitt, K., Scurlock, B., Stahler, D.R., and Middleton, A.D., 2023, Multi‐level thresholds of residential and agricultural land use for elk avoidance across the Greater Yellowstone Ecosystem: Journal of Applied Ecology, v. 60, no. 6, p. 1089–1099, accessed June 1, 2024, at https://doi.org/10.1111/1365-2664.14401.
Gómez, C., White, J.C., and Wulder, M.A., 2016, Optical remotely sensed time series data for land cover classification—A review: ISPRS Journal of Photogrammetry and Remote Sensing, v. 116, p. 55–72, accessed June 1, 2024, at https://doi.org/10.1016/j.isprsjprs.2016.03.008.
Gould, N.P., Pomara, L.Y., Nepal, S., Goodrick, S.L., and Lee, D.C., 2023, Mapping firescapes for wild and prescribed fire management—A landscape classification approach: Land, v. 12, no. 12, article 2180, accessed June 1, 2024, at https://doi.org/10.3390/land12122180.
Goward, S.N., Williams, D.L., Arvidson, T., Rocchio, L.E.P., Irons, J.R., Russell, C.A., and Johnston, S.S., 2017, Landsat’s enduring legacy—Pioneering global land observation from space: Bethesda, Md., American Society for Photogrammetry and Remote Sensing, 586 p., accessed June 1, 2024, at https://doi.org/10.14358/ASPRS.1.57083.101.7.
Haddad, J., Lawler, S., and Ferreira, C.M., 2016, Assessing the relevance of wetlands for storm surge protection—A coupled hydrodynamic and geospatial framework: Natural Hazards, v. 80, no. 2, p. 839–861, accessed June 1, 2024, at https://doi.org/10.1007/s11069-015-2000-7.
Hagen, S., Nolte, C., Chang, Y., Morgan, S., Boccaletti, G., and Reddy, S.M.W., 2024, Understanding variation in impacts from private protected areas across regions and protection mechanisms to inform organizational practices: Conservation Biology, v. 38, no. 2, article e14225, 12 p., accessed June 1, 2024, at https://doi.org/10.1111/cobi.14225.
Hansen, A.T., Dolph, C.L., Foufoula-Georgiou, E., and Finlay, J.C., 2018, Contribution of wetlands to nitrate removal at the watershed scale: Nature Geoscience, v. 11, no. 2, p. 127–132, accessed June 1, 2024, at https://doi.org/10.1038/s41561-017-0056-6.
Hansen, M.C., and Loveland, T.R., 2012, A review of large area monitoring of land cover change using Landsat data: Remote Sensing of Environment, v. 122, p.66-74, accessed April 1, 2024, at https://doi.org/10.1016/j.rse.2011.08.024.
Hawbaker, T.J., Henne, P.D., Vanderhoof, M.K., Carlson, A.R., Mockrin, M.H., and Radeloff, V.C., 2023, Changes in wildfire occurrence and risk to homes from 1990 through 2019 in the Southern Rocky Mountains, USA: Ecosphere, v. 14, no. 2, article e4403, 21 p., accessed June 1, 2024, at https://doi.org/10.1002/ecs2.4403.
Herrick, J.E., Van Zee, J.W., McCord, S.E., Courtright, E.M., Karl, J.W., and Burkett, L.M., 2018, Monitoring manual for grassland, shrubland, and savanna ecosystems (2d ed.)—Volume I—Core methods: Las Cruces, N. Mex., U.S. Department of Agriculture Agricultural Research Service and Jornada Experimental Range, 77 p., accessed June 1, 2024, at https://www.landscapetoolbox.org/manuals/monitoring-manual.
Homer, C.H., Fry, J.A., and BarnesC.A., 2012, The National Land Cover Database: U.S. Geological Survey Fact Sheet 2012–3020, 4 p. [Also available at https://doi.org/10.3133/fs20123020.]
Hunt, K.A., Abernethy, J., Beeson, P.C., Bowman, M., Wallander, S., and Williams, R., 2024, Crop sequence boundaries using USDA National Agricultural Statistics Service historic cropland data layers: Statistical Journal of the IAOS, v. 40, no. 2, p. 237–246, accessed June 1, 2024, at https://doi.org/10.3233/SJI-230078.
Impact Observatory, National Geographic Society, and Esri, 2024, Esri 2021 Land Cover Map: Esri Living Atlas, accessed June 1, 2024, at https://livingatlas.arcgis.com/landcover/.
Inglis, N.C., Vukomanovic, J., Petrasova, A., and Meentemeyer, R.K., 2023, Viewscape change highlights shifting drivers of exurban development over time: Landscape and Urban Planning, v. 238, article 104833, 12 p., accessed June 1, 2024, at https://doi.org/10.1016/j.landurbplan.2023.104833.
Jesdale, B.M., Morello-Frosch, R., and Cushing, L., 2013, The racial/ethnic distribution of heat risk-related land cover in relation to residential segregation: Environmental Health Perspectives, v. 121, no. 7, p. 811–817, accessed June 1, 2024, at https://doi.org/10.1289/ehp.1205919.
Kachergis, E., Miller, S.W., McCord, S.E., Dickard, M., Savage, S., Reynolds, L.V., Lepak, N., Dietrich, C., Green, A., Nafus, A., Prentice, K., and Davidson, Z., 2022, Adaptive monitoring for multiscale land management—Lessons learned from the Assessment, Inventory, and Monitoring (AIM) principles: Rangelands, v. 44, no. 1, p. 50–63, accessed June 1, 2024, at https://doi.org/10.1016/j.rala.2021.08.006.
Koncki, N.G., and Aronson, M.F., 2015, Invasion risk in a warmer world—Modeling range expansion and habitat preferences of three nonnative aquatic invasive plants: Invasive Plant Science and Management, v. 8, no. 4, p. 436–449, accessed June 1, 2024, at https://doi.org/10.1614/IPSM-D-15-00020.1.
La Puma, I.P., ed., 2023, LANDFIRE technical documentation: U.S. Geological Survey Open-File Report 2023–1045, 103 p., accessed June 1, 2024, at https://doi.org/10.3133/ofr20231045.
Lark, T.J., Hendricks, N.P., Smith, A., Pates, N., Spawn-Lee, S.A., Bougie, M., Booth, E.G., Kucharik, C.J., and Gibbs, H.K., 2022, Environmental outcomes of the US Renewable Fuel Standard: Proceedings of the National Academy of Sciences, v. 119, no. 9, article e2101084119, 8 p., accessed June 1, 2024, at https://doi.org/10.1073/pnas.2101084119.
Larkin, N.K., O’Neill, S.M., Solomon, R., Raffuse, S., Strand, T., Sullivan, D.C., Krull, C., Rorig, M., Peterson, J., and Ferguson, S.A., 2009, The BlueSky smoke modeling framework: International Journal of Wildland Fire, v. 18, no. 8, p. 906–920, accessed June 1, 2024, at https://doi.org/10.1071/WF07086.
Lavdas, L.G., 1996, Program VSMOKE—Users manual: Asheville, N.C., U.S. Department of Agriculture, Forest Service, Southern Research Station General Technical Report SRS–6, 147 p. [Also available at https://doi.org/10.2737/SRS-GTR-6.]
Lee, S., Yeo, I.Y., Lang, M.W., McCarty, G.W., Sadeghi, A.M., Sharifi, A., Jin, H., and Liu, Y., 2019, Improving the catchment scale wetland modeling using remotely sensed data: Environmental Modelling & Software, v. 122, article 104069, 19 p., accessed June 1, 2024, at https://doi.org/10.1016/j.envsoft.2017.11.001.
Li, C., Xian, G., Wellington, D., Smith, K., Horton, J., and Zhou, Q., 2022, Development of the LCMAP annual land cover product across Hawaiʻi: International Journal of Applied Earth Observation and Geoinformation, v. 113, article 103015, 17 p., accessed June 1, 2024, at https://doi.org/10.1016/j.jag.2022.103015.
Li, Z., Mueller, R., Yang, Z., Johnson, D., and Willis, P., 2024, Cloud-powered agricultural mapping—A revolution toward 10m resolution cropland data layers, in IEEE International Geoscience and Remote Sensing Symposium, Athens, Greece, July 7–12, 2024: New York, Institute of Electrical and Electronics Engineers, p. 4081–4084, accessed June 1, 2024, at https://doi.org/10.1109/IGARSS53475.2024.10641079.
Luyssaert, S., Jammet, M., Stoy, P.C., Estel, S., Pongratz, J., Ceschia, E., Churkina, G., Don, A., Erb, K., Ferlicoq, M., Gielen, B., Grünwald, T., Houghton, R.A., Klumpp, K., Knohl, A., Kolb, T., Kuemmerle, T., Laurila, T., Lohila, A., Loustau, D., McGrath, M.J., Meyfroidt, P., Moors, E.J., Naudts, K., Novick, K., Otto, J., Pilegaard, K., Pio, C.A., Rambal, S., Rebmann, C., Ryder, J., Suyker, A.E., Varlagin, A., Wattenbach, M., and Dolman, A.J., 2014, Land management and land-cover change have impacts of similar magnitude on surface temperature: Nature Climate Change, v. 4, p. 389–393, accessed June 1, 2024, at https://doi.org/10.1038/nclimate2196.
Malakoff, K.L., and Nolte, C., 2023, Estimating the parcel-level impacts of agricultural conservation easements on farmland loss using satellite data in New England: Land Use Policy, v. 132, article 106814, 8 p., accessed June 1, 2024, at https://doi.org/10.1016/j.landusepol.2023.106814.
Marlor, K.M., Webster, C.R., and Chimner, R.A., 2014, Disturbance and wetland type alter reed canarygrass cover in northern Michigan: Invasive Plant Science and Management, v. 7, no. 1, p. 121–131, accessed June 1, 2024, at https://doi.org/10.1614/IPSM-D-13-00039.1.
McGinley, K., Murray, L., Robertson, G., and White, E.M, 2023, National report on sustainable forests, 2020: Washington, D.C., U.S. Department of Agriculture, Forest Service, Washington Office, FS–1217, 53 p. [Also available at https://doi.org/10.2737/FS-1217.]
McQuillan, K.A., Hwang, T., and Martin, K.L., 2023, Extended growing seasons and decreases in hydrologic connectivity indicate increasing water stress in humid, temperate forests: Agricultural and Forest Meteorology, v. 338, article 109525, 13 p., accessed June 1, 2024, at https://doi.org/10.1016/j.agrformet.2023.109525.
Mihiar, C.M., Lewis, D.J., and Coulston, J.W., 2023, County-level land-use projections for the conterminous United States, 2020–2070, used in the 2020 RPA Assessment: Fort Collins, Colo., U.S. Department of Agriculture Forest Service Research Data Archive database, accessed June 1, 2024, at https://doi.org/10.2737/RDS-2023-0026.
Multi-Resolution Land Characteristics Consortium, 2024, Data: Multi-Resolution Land Characteristics Consortium digital data, accessed June 1, 2024, at https://www.mrlc.gov/data/.
Mushet, D.M., Euliss, N.H., Jr., and Stockwell, C.A., 2012, Mapping anuran habitat suitability to estimate effects of grassland and wetland conservation programs: Copeia, v. 2012, no. 2, p. 321–330, accessed June 1, 2024, at https://doi.org/10.1643/CH-11-119.
National Oceanic and Atmospheric Administration, 2024a, Coastal Flood Exposure Mapper: National Oceanic and Atmospheric Administration Office for Coastal Management digital data, accessed August 9, 2024, at https://coast.noaa.gov/digitalcoast/tools/flood-exposure.html.
National Oceanic and Atmospheric Administration, 2024b, High-resolution land cover and change data, Charleston, SC: National Oceanic and Atmospheric Administration, Office for Coastal Management web page, accessed June 1, 2024, at https://coast.noaa.gov/digitalcoast/data/highresolution.html.
National Oceanic and Atmospheric Administration, 2024c, Sea Level Rise Viewer: National Oceanic and Atmospheric Administration Office for Coastal Management digital data, accessed August 9, 2024, at https://coast.noaa.gov/digitalcoast/tools/slr.html.
Natural Resources Conservation Service, 2024, National Resources Inventory (NRI) data resources: U.S. Department of Agriculture web page, accessed June 1, 2024, at https://www.nrcs.usda.gov/resources/data-and-reports/national-resources-inventory.
Nelson, M.D., Riitters, K.H., Coulston, J.W., Domke, G.M., Greenfield, E.J., Langner, L.L., Nowak, D.J., O’Dea, C.B., Oswalt, S.N., Reeves, M.C., and Wear, D.N., 2020, Defining the United States land base—A technical document supporting the USDA Forest Service 2020 RPA Assessment: Madison, Wis., U.S. Department of Agriculture, Forest Service, Northern Research Station, General Technical Report NRS–191, 70 p., accessed June 1, 2024, at https://doi.org/10.2737/NRS-GTR-191.
Nolte, C., Boyle, K.J., Chaudhry, A.M., Clapp, C.M., Guignet, D., Hennighausen, H., Kushner, I., Liao, Y., Mamun, S., Pollack, A., Richardson, J., Sundquist, S., Swedberg, K., and Uhl, J.H., 2021, Studying the impacts of environmental amenities and hazards with nationwide property data—Best data practices for interpretable and reproducible analyses: Morgantown, W. Va., West Virginia University College of Law Research Paper no. 2021–013, 38 p., accessed June 1, 2024, at https://doi.org/10.2139/ssrn.3900806.
Noonan-Wright, E.K., Opperman, T.S., Finney, M.A., Zimmerman, G.T., Seli, R.C., Elenz, L.M., Calkin, D.E., and Fiedler, J.R., 2011, Developing the US Wildland Fire Decision Support System: Journal of Combustion, v. 2011, article 168473, 14 p., accessed June 1, 2024, at https://doi.org/10.1155/2011/168473.
Ochiai, O., Poulter, B., Seifert, F.M., Ward, S., Jarvis, I., Whitcraft, A., Sahajpal, R., Gilliams, S., Herold, M., Carter, S., Duncanson, L.I., Kay, H., Lucas, R., Wilson, S.N., Melo, J., Post, J., Briggs, S., Quegan, S., Dowell, M., Cescatti, A., Crisp, D., Saatchi, S., Tadono, T., Steventon, M., and Rosenqvist, A., 2023, Towards a roadmap for space-based observations of the land sector for the UNFCCC global stocktake: iScience, v. 26, no. 4, article 106489, 27 p., accessed June 1, 2024, at https://doi.org/10.1016/j.isci.2023.106489.
Pearse, A.T., Brandt, D.A., and Krapu, G.L., 2016, Wintering Sandhill Crane exposure to wind energy development in the central and southern Great Plains, USA: The Condor, v. 118, no. 2, p. 391–401, accessed June 1, 2024, at https://doi.org/10.1650/CONDOR-15-99.1.
Pengra, B.W., Stehman, S.V., Horton, J.A., Auch, R.F., Kambly, S., Knuppe, M., Sorenson, D., Robison, C., and Taylor, J.L., 2023a, LCMAP CONUS Reference Data Product 1984–2021 land cover, land use and change process attributes: U.S. Geological Survey data release, accessed June 1, 2024, at https://doi.org/10.5066/P933Z1TK.
Pengra, B.W., Stehman, S.V., Horton, J.A., Dockter, D.J., Schroeder, T.A., Yang, Z., Cohen, W.B., Healey, S.P., and Loveland, T.R., 2020, Quality control and assessment of interpreter consistency of annual land cover reference data in an operational national monitoring program: Remote Sensing of Environment, v. 238, article 111261, 10 p., accessed June 1, 2024, at https://doi.org/10.1016/j.rse.2019.111261.
Pengra, B.W., Stehman, S.V., Horton, J.A., and Wellington, D.F., 2022, Land Change Monitoring, Assessment, and Projection (LCMAP) collection 1.0 annual land cover and land cover change validation tables (2000–2019) for Hawaii: U.S. Geological Survey data release, accessed June 1, 2024, at https://doi.org/10.5066/P99X6X7K.
Pengra, B.W., Stehman, S.V., Horton, J.A., and Wellington, D.F., 2023b, Land Change Monitoring, Assessment, and Projection (LCMAP) collection 1.3 annual land cover and land cover change validation tables (1985–2021) for the conterminous United States: U.S. Geological Survey data release, accessed June 1, 2024, at https://doi.org/10.5066/P9AQYZE0.
Picotte, J.J., Dockter, D., Long, J., Tolk, B., Davidson, A., and Peterson, B., 2019, LANDFIRE remap prototype mapping effort—Developing a new framework for mapping vegetation classification, change, and structure: Fire, v. 2, no. 2, article 35, 26 p., accessed October 8, 2021, at https://doi.org/10.3390/fire2020035.
Pilliod, D.S., Hossack, B.R., Bahls, P.F., Bull, E.L., Corn, P.S., Hokit, G., Maxell, B.A., Munger, J.C., and Wyrick, A., 2010, Non‐native salmonids affect amphibian occupancy at multiple spatial scales: Diversity and Distributions, v. 16, no. 6, p. 959–974, accessed June 1, 2024, at https://doi.org/10.1111/j.1472-4642.2010.00699.x.
Popp, A., Calvin, K., Fujimori, S., Havlik, P., Humpenöder, F., Stehfest, E., Bodirsky, B.L., Dietrich, J.P., Doelmann, J.C., Gusti, M., Hasegawa, T., Kyle, P., Obersteiner, M., Tabeau, A., Takahashi, K., Valin, H., Waldhoff, S., Weindl, I., Wise, M., Kriegler, E., Lotze-Campen, H., Fricko, O., Riahi, K., and van Vurren, D.P., 2017, Land-use futures in the shared socio-economic pathways: Global Environmental Change, v. 42, p. 331–345, accessed June 1, 2024, at https://doi.org/10.1016/j.gloenvcha.2016.10.002.
Prichard, S.J., Kennedy, M.C., Andreu, A.G., Eagle, P.C., French, N.H., and Billmire, M., 2019, Next-generation biomass mapping for regional emissions and carbon inventories—Incorporating uncertainty in wildland fuel characterization: JGR Biogeosciences, v. 124, no. 12, p. 3699–3716, accessed June 1, 2024, at https://doi.org/10.1029/2019JG005083.
Prichard, S.J., Sandberg, D.V., Ottmar, R.D., Eberhardt, E., Andreu, A., Eagle, P., and Swedin, K., 2013, Fuel Characteristic Classification System version 3.0—Technical documentation: Portland, Oreg., U.S. Department of Agriculture, Forest Service, Pacific Northwest Research Station, General Technical Report PNW–GTR–887, 79 p. [Also available at https://research.fs.usda.gov/treesearch/45283.]
Reeves, R.A., Pierce, C.L., Smalling, K.L., Klaver, R.W., Vandever, M.W., Battaglin, W.A., and Muths, E., 2016, Restored agricultural wetlands in central Iowa—Habitat quality and amphibian response: Wetlands, v. 36, p. 101–110, accessed June 1, 2024, at https://doi.org/10.1007/s13157-015-0720-9.
Reid, C.E., O’Neill, M.S., Gronlund, C.J., Brines, S.J., Brown, D.G., Diez-Roux, A.V., and Schwartz, J., 2009, Mapping community determinants of heat vulnerability: Environmental Health Perspectives, v. 117, no. 11, p. 1730–1736, accessed June 1, 2024, at https://doi.org/10.1289/ehp.0900683.
Rigge, M.B., Bunde, B., Postma, K., and Shi, H., 2024, Rangeland Condition Monitoring Assessment and Projection (RCMAP) fractional component time-series across western North America, 1985–2023: U.S. Geological Survey data release, accessed June 1, 2024, at https://doi.org/10.5066/P9SJXUI1.
Rowe, J.M., and Vanderhoof, M.K., 2024, Earth Observation Assessment (EOA) 2023 Tableau Dashboard data: U.S. Geological Survey data release, accessed June 1, 2024, at https://doi.org/10.5066/P13BNHCN.
Rudis, V.A., 2003, Comprehensive regional resource assessments and multipurpose uses of forest inventory and analysis data, 1976 to 2001—A review: Asheville, N.C., U.S. Department of Agriculture, Forest Service, Southern Research Station, GTR SRS–70, 129 p. [Also available at https://doi.org/10.2737/SRS-GTR-70.]
Rudis, V.A., 2005, A knowledge base for FIA data uses, in Proceedings of the fifth annual forest inventory and analysis symposium, New Orleans, La., November 18–20, 2003, General Technical Report WO–69: Washington, D.C., U.S. Department of Agriculture, Forest Service, 222 p. [Also available at https://research.fs.usda.gov/treesearch/14296.]
Rumsey, C.A., Hammond, J.C., Murphy, J., Shoda, M., and Soroka, A., 2023, Spatial patterns and seasonal timing of increasing riverine specific conductance from 1998 to 2018 suggest legacy contamination in the Delaware River Basin: Science of the Total Environment, v. 858, part 1, article 159691, 13 p., accessed June 1, 2024, at https://doi.org/10.1016/j.scitotenv.2022.159691.
Scott, J.H., Brough, A.M., Gilbertson-Day, J.W., Dillon, G.K., and Moran, C., 2020, Wildfire risk to communities—Spatial datasets of wildfire risk for populated areas in the United States: Fort Collins, Colo., Forest Service Research Data Archive database, accessed June 1, 2024, at https://doi.org/10.2737/RDS-2020-0060.
Serra, P., Pons, X., and Saurí, D., 2003, Post-classification change detection with data from different sensors—Some accuracy considerations: International Journal of Remote Sensing, v. 24, no. 16, p. 3311–3340, accessed June 1, 2024, at https://doi.org/10.1080/0143116021000021189.
Shi, H., Rigge, M., Postma, K., and Bunde, B., 2022, Trends analysis of Rangeland Condition Monitoring Assessment and Projection (RCMAP) fractional component time-series (1985–2020): GIScience & Remote Sensing, v. 59, no. 1, p. 1243–1265, accessed June 1, 2024, at https://doi.org/10.1080/15481603.2022.2104786.
Sohl, T., Dornbierer, J., Wika, S., and Robison, C., 2019, Remote sensing as the foundation for high-resolution United States landscape projections—The Land Change Monitoring, Assessment, and Projection (LCMAP) initiative: Environmental Modelling & Software, v. 120, article 104495, 17 p., accessed June 1, 2024, at https://doi.org/10.1016/j.envsoft.2019.104495.
Sohl, T.L., Wimberly, M.C., Radeloff, V.C., Theobald, D.M., and Sleeter, B.M., 2016, Divergent projections of future land use in the United States arising from different models and scenarios: Ecological Modelling, v. 337, p. 281–297, accessed June 1, 2024, at https://doi.org/10.1016/j.ecolmodel.2016.07.016.
Soulard, C.E., Walker, J.J., and Griffith, G.E., 2017, Forest harvest patterns on private lands in the Cascade Mountains, Washington, USA: Forests, v. 8, no. 10, p. 383–401, accessed June 1, 2024, at https://doi.org/10.3390/f8100383.
Stehman, S.V., Pengra, B.W., Horton, J.A., and Wellington, D.F., 2021, Validation of the U.S. Geological Survey’s Land Change Monitoring, Assessment, and Projection (LCMAP) Collection 1.0 annual land cover products 1985–2017: Remote Sensing of Environment, v. 265, article 112646, 16 p., accessed June 1, 2024, at https://doi.org/10.1016/j.rse.2021.112646.
Strahler, A.H., Boschetti, L., Foody, G.M., Friedl, M.A., Hansen, M.C., Herold, M., Mayaux, P., Morisette, J.T., Stehman, S.V., and Woodcock, C.E., 2006, Global land cover validation—Recommendations for evaluation and accuracy assessment of global land cover maps: Luxembourg, European Communities, GOFC-GOLD Report No. 25, 60 p, accessed June 1, 2024, at https://gofcgold.umd.edu/sites/default/files/docs/ReportSeries/GOLD_25.pdf.
Tábora-Sarmiento, S., Patiño, R., Portillo-Quintero, C., and Coldren, C., 2022, Air, land, and water variables associated with the first appearance and current spatial distribution of toxic Prymnesium parvum blooms in reservoirs of the Southern Great Plains, USA: Science of the Total Environment, v. 836, article 155567, 11 p., accessed June 1, 2024, at https://doi.org/10.1016/j.scitotenv.2022.155567.
Tiner, R.W., 2003, Estimated extent of geographically isolated wetlands in selected areas of the United States: Wetlands, v. 23, no. 3, p. 636–652, accessed June 1, 2024, at https://doi.org/10.1672/0277-5212(2003)023[0636:EEOGIW]2.0.CO;2.
Tinkham, W.T., Mahoney, P.R., Hudak, A.T., Domke, G.M., Falkowski, M.J., Woodall, C.W., and Smith, A.M.S., 2018, Applications of the United States Forest Inventory and Analysis dataset—A review and future directions: Canadian Journal of Forest Research, v. 48, no. 11, p. 1251–1268, accessed June 1, 2024, at https://doi.org/10.1139/cjfr-2018-0196.
Tsendbazar, N., comp., 2022, WorldCover product validation report (ver. 2.0): European Space Agency report WorldCover_PVR_v2.0, 31 p., accessed June 1, 2024, at https://worldcover2021.esa.int/data/docs/WorldCover_PVR_V2.0.pdf.
U.S. Department of Agriculture, 2024a, Cropland Data Layer—National download: U.S. Department of Agriculture, National Agricultural Statistics Service digital data, accessed June 1, 2024, at https://www.nass.usda.gov/Research_and_Science/Cropland/Release/.
U.S. Department of Agriculture, 2024b, National Agricultural Imagery Program (NAIP) imagery: U.S. Department of Agriculture digital data, accessed June 1, 2024, at https://www.fsa.usda.gov/programs-and-services/aerial-photography/imagery-programs/naip-imagery/.
U.S. Environmental Protection Agency, 2023, Fires—Wild, prescribed, and agricultural field burning, section 7 of 2020 National Emissions Inventory technical support document: U.S. Environmental Protection Agency report EPA–454/R–23–001g, [variously paged; 38 p.], accessed June 1, 2024, at https://www.epa.gov/air-emissions-inventories/2020-national-emissions-inventory-nei-technical-support-document-tsd.
U.S. Environmental Protection Agency, 2024, Inventory of U.S. greenhouse gas emissions and sinks—1990–2022: U.S. Environmental Protection Agency, EPA 430–R–24–004, 919 p., accessed June 1, 2024, at https://www.epa.gov/ghgemissions/draft-inventory-us-greenhouse-gas-emissions-and-sinks-1990-2022.
U.S. Fish and Wildlife Service, 2024, National Wetlands Inventory, Wetlands Data Layer: U.S. Fish and Wildlife Service web page, accessed June 1, 2024, at https://www.fws.gov/program/national-wetlands-inventory/wetlands-data.
U.S. Geological Survey, 2022a, Land Change Monitoring Assessment and Projection (LCMAP) collection 1.3 science products for the conterminous United States: U.S. Geological Survey data release, accessed June 1, 2024, at https://doi.org/10.5066/P9C46NG0.
U.S. Geological Survey, 2022b, USGS EROS archive—LCMAP—CCDC v 1.0 products (Hawaii): U.S. Geological Survey web page, accessed June 1, 2024, at https://doi.org/10.5066/P91E8M23.
U.S. Geological Survey, 2024a, LCMAP Collection 1.3 Science Product Guide: U.S. Geological Survey web page, accessed June 1, 2024, at https://www.usgs.gov/media/files/lcmap-collection-13-science-product-guide.
U.S. Geological Survey, 2024b, The 3D Elevation Program (3DEP): U.S. Geological Survey digital data, accessed June 1, 2024, at https://www.usgs.gov/3d-elevation-program.
U.S. Global Change Research Program, 2023, Fifth National Climate Assessment: Washington, D.C., U.S. Global Change Research Program, [variously paged; 1,834 p.], accessed June 1, 2024, at https://doi.org/10.7930/NCA5.2023.
Van Lanen, N.J., Shyvers, J.E., Duchardt, C.J., and Aldridge, C.L., 2023, A multi-ecosystem prioritization framework to balance competing habitat conservation needs of multiple species in decline: Landscape Ecology, v. 38, p. 2795–2813, accessed June 1, 2024, at https://doi.org/10.1007/s10980-023-01712-z.
Venter, Z.S., Barton, D.N., Chakraborty, T., Simensen, T., and Singh, G., 2022, Global 10 m land use land cover datasets—A comparison of Dynamic World, World Cover, and ESRI Land Cover: Remote Sensing, v. 14, no. 16, article 4101, 19 p., accessed June 1, 2024, at https://doi.org/10.3390/rs14164101.
Vogelmann, J.E., Howard, S.M., Yang, L., Larson, C.R., Wylie, B.K., and Van Driel, N., 2001, Completion of the 1990s National Land Cover Dataset for the conterminous United States from Landsat thematic mapper and ancillary data sources: Photogrammetric Engineering and Remote Sensing, v. 67, no. 6, p. 650–662. [Also available at https://www.asprs.org/wp-content/uploads/pers/2001journal/june/2001_jun_highlight.pdf.]
Walker, J., Rotella, J.J., Schmidt, J.H., Loesch, C.R., Reynolds, R.E., Lindberg, M.S., Ringelman, J.K., and Stephens, S.E., 2013, Distribution of duck broods relative to habitat characteristics in the Prairie Pothole Region: The Journal of Wildlife Management, v. 77, no. 2, p. 392–404, accessed June 1, 2024, at https://doi.org/10.1002/jwmg.466.
Wang, R., Ma, Y., Zhao, G., Zhou, Y., Shehab, I., and Burton, A., 2023, Investigating water quality sensitivity to climate variability and its influencing factors in four Lake Erie watersheds: Journal of Environmental Management, v. 325, part A, article 116449, accessed June 1, 2024, at https://doi.org/10.1016/j.jenvman.2022.116449.
Wang, Z., and Mountrakis, G., 2023, Accuracy assessment of eleven medium resolution global and regional land cover land use products—A case study over the conterminous United States: Remote Sensing, v. 15, no. 12, article 3186, 31 p., accessed June 1, 2024, at https://doi.org/10.3390/rs15123186.
Wear, D.N., and Prestemon, J.P., 2019, Spatiotemporal downscaling of global population and income scenarios for the United States: PLOS ONE, v. 14, no. 7, article e0219242, 19 p., accessed June 1, 2024, at https://doi.org/10.1371/journal.pone.0219242.
Westfall, J.A., Coulston, J.W., Moisen, G.G., and Andersen, H.-E., comps., 2022, Sampling and estimation documentation for the Enhanced Forest Inventory and Analysis Program—2022: Madison, Wis., U.S. Department of Agriculture, Forest Service, Northern Research Station, General Technical Report NRS–GTR–207, 129 p., accessed June 1, 2024, at https://doi.org/10.2737/NRS-GTR-207.
Wickham, J., Homer, C., Vogelmann, J., McKerrow, A., Mueller, R., Herold, N., and Coulston, J., 2014, The Multi-Resolution Land Characteristics (MRLC) Consortium—20 years of development and integration of USA National Land Cover Data: Remote Sensing, v. 6, no. 8, p. 7424–7441, accessed June 1, 2024, at https://doi.org/10.3390/rs6087424.
Wickham, J., Stehman, S.V., Neale, A.C., and Mehaffey, M., 2020, Accuracy assessment of NLCD 2011 percent impervious cover for selected USA metropolitan areas: International Journal of Applied Earth Observation and Geoinformation, v. 84, article 101955, 9 p., accessed June 1, 2024, at https://doi.org/10.1016/j.jag.2019.101955.
Wickham, J., Stehman, S.V., Sorenson, D.G., Gass, L., and Dewitz, J.A., 2021, Thematic accuracy assessment of the NLCD 2016 land cover for the conterminous United States: Remote Sensing of Environment, v. 257, article 112357, 12 p., accessed June 1, 2024, at https://doi.org/10.1016/j.rse.2021.112357.
Wickham, J., Stehman, S.V., Sorenson, D.G., Gass, L., and Dewitz, J.A., 2023, Thematic accuracy assessment of the NLCD 2019 land cover for the conterminous United States: GIScience & Remote Sensing, v. 60, no. 1, article 2181143, 16 p., accessed June 1, 2024, at https://doi.org/10.1080/15481603.2023.2181143.
Woodie, M.B., Tomcho, A., Barnhill, L.M., and McComb, B.C., 2023, Assessing golden‐winged warbler dispersal habitat in a highly parcelized landscape: Wildlife Society Bulletin, v. 47, no. 3, article e1473, 15 p., accessed June 1, 2024, at https://doi.org/10.1002/wsb.1473.
Xian, G.Z., and Shi, H., 2019, Characterizing landscape thermal feature and change in urban environment using Landsat ARD and LCMAP products [abs.], in Pecora 21/ISRSE 38—Earth observation and continuous monitoring of our changing planet—From sensors to decisions, Baltimore, Md., October 6–11, 2019: National Aeronautics and Space Administration, Astrophysics Data System web page, accessed June 1, 2024, at https://ui.adsabs.harvard.edu/abs/2019AGUFM.B11I2283X/abstract.
Xian, G.Z., Smith, K., Wellington, D., Horton, J., Zhou, Q., Li, C., Auch, R., Brown, J.F., Zhu, Z., and Reker, R.R., 2022, Implementation of the CCDC algorithm to produce the LCMAP Collection 1.0 annual land surface change product: Earth System Science Data, v. 14, no. 1, p. 143–162, accessed June 1, 2024, at https://doi.org/10.5194/essd-14-143-2022.
Ye, S., Rogan, J., Zhu, Z., Hawbaker, T.J., Hart, S.J., Andrus, R.A., Meddens, A.J.H., Hicke, J.A., Eastman, J.R., and Kulakowski, D., 2021, Detecting subtle change from dense Landsat time series—Case studies of mountain pine beetle and spruce beetle disturbance: Remote Sensing of Environment, v. 263, article 112560, 16 p., accessed June 1, 2024, at https://doi.org/10.1016/j.rse.2021.112560.
Zhu, Z., and Woodcock, C.E., 2014, Continuous change detection and classification of land cover using all available Landsat data: Remote Sensing of Environment, v. 144, p. 152–171, accessed June 1, 2024, at https://doi.org/10.1016/j.rse.2014.01.011.
Conversion Factors
Abbreviations
AIM
Assessment, Inventory, and Monitoring
BLM
Bureau of Land Management
C–CAP
Coastal Change Analysis Program
CDL
Cropland Data Layer
EOA
Earth Observation Assessments
ESA
European Space Agency
EVT
Existing Vegetation Type
FCCS
Fuel Characteristic Classification System
FGDC
Federal Geographic Data Committee
FIA
Forest Inventory and Analysis
FS
Forest Service
FWS
U.S. Fish and Wildlife Service
HLS
Harmonized Landsat and Sentinel-2
LANDFIRE
Landscape Fire and Resource Management Planning Tools
LCMAP
Land Change Monitoring, Assessment, and Projection
LCMS
Landscape Change Monitoring System
lidar
light detection and ranging
MRLC
Multi-Resolution Land Characteristics
NASS
National Agricultural Statistics Service
NGDA
National Geospatial Data Asset
NLCD
National Land Cover Database
NOAA
National Oceanic and Atmospheric Administration
NRCS
Natural Resources Conservation Service
NRI
National Resources Inventory
NVC
National Vegetation Classification
NWI
National Wetlands Inventory
PSU
primary sampling unit
RAP
Rangeland Analysis Platform
RCMAP
Rangeland Condition Monitoring Assessment and Projection
USDA
U.S. Department of Agriculture
USGS
U.S. Geological Survey
For more information about this publication, contact:
Branch Chief, Integrated Science and Applications Branch
USGS Earth Resources Observation and Science Center
47914 252nd Street
Sioux Falls, SD 57198
605–594–6537
For additional information, visit: https://www.usgs.gov/centers/eros
Publishing support provided by the
Rolla and Reston Publishing Service Centers
Disclaimers
Any use of trade, firm, or product names is for descriptive purposes only and does not imply endorsement by the U.S. Government.
Although this information product, for the most part, is in the public domain, it also may contain copyrighted materials as noted in the text. Permission to reproduce copyrighted items must be secured from the copyright owner.
Suggested Citation
Sohl, T., Schleeweis, K., Herold, N., Lang, M., La Puma, I., Wickham, J., Mueller, R., Rigge, M., Dewitz, J., Brown, J., Ingebritsen, J., Ellenwood, J., Wengert, E., Rowe, J., Flanagan, P., Kachergis, E., Garthwaite, I., and Wu, Z., 2025, An interagency perspective on improving consistency and transparency of land use and land cover mapping: U.S. Geological Survey Circular 1549, 47 p., https://doi.org/10.3133/cir1549.
ISSN: 2330-5703 (online)
Study Area
| Publication type | Report |
|---|---|
| Publication Subtype | USGS Numbered Series |
| Title | An interagency perspective on improving consistency and transparency of land use and land cover mapping |
| Series title | Circular |
| Series number | 1549 |
| DOI | 10.3133/cir1549 |
| Publication Date | January 14, 2025 |
| Year Published | 2025 |
| Language | English |
| Publisher | U.S. Geological Survey |
| Publisher location | Reston, VA |
| Contributing office(s) | Earth Resources Observation and Science (EROS) Center, Office of Land Remote Sensing (Geography) |
| Description | vi, 47 p. |
| Country | United States |
| Online Only (Y/N) | Y |
| Additional Online Files (Y/N) | N |