

U.S. Geological Survey National Shoreline Change— Summary Statistics for Updated Vector Shorelines (1800s–2010s) and Associated Shoreline Change Data for the Georgia and Florida Coasts
Links
- Document: Report (1.14 MB pdf) , HTML , XML
- Data Release: USGS data release - USGS national shoreline change—A GIS compilation of updated vector shorelines (1800s–2010s) and associated shoreline change data for the Georgia and Florida Coasts
- NGMDB Index Page: National Geologic Map Database Index Page (html)
- Download citation as: RIS | Dublin Core
Acknowledgments
The hard work and generous cooperation of many individuals made this report for updated shorelines and change rates for Georgia and Florida possible. This effort is part of the Supplemental Appropriations for Disaster Relief Requirements Act, 2018 (Public Law 115–123, 132 Stat. 64) which provided funds to support science associated with recovery and rebuilding activities in the wake of the 2017 Hurricanes Irma and Maria.
Special thanks are extended to Amy Farris, Kathy Weber, Rachel Henderson, Zehao Xue, Marie Bartlett, and Emily Himmelstoss, of the U.S. Geological Survey (USGS), for their efforts creating and contributing to the compilation of data for this update. Reviews by Alex Seymour and Ben Gutierrez (USGS) greatly improved this text, and their time is very much appreciated, as is the careful review by Julia Heslin (USGS) of the dataset that accompanies this report. This work was done under contract to the U.S. Geological Survey.
Abstract
Rates of shoreline change have been updated for the open-ocean sandy coastlines of Georgia and Florida as part of the U.S. Geological Survey’s Coastal Change Hazards programmatic focus. This work was formerly within the National Assessment of Shoreline Change project. Shorelines were compiled from the original report published in 2005, recent update reports, and additional light detection and ranging (lidar) shorelines which were extracted from lidar data collected prior to and following Hurricane Irma, which made landfall in September 2017. These shorelines were used to compute long- and short-term rates that incorporate the proxy-datum bias on a transect-by-transect basis. The proxy-datum bias accounts for the unidirectional onshore bias of proxy-based high water line shorelines relative to datum-based mean high water shorelines. In this study, the coast of Georgia exhibited the highest average rates of erosion and accretion in both the long term (approximately 150 years) and the short term (approximately 30 years). Shoreline positions from the mid-1800s through 2018 were used to update the shoreline change rates for Florida and Georgia using the Digital Shoreline Analysis System (DSAS) software.
Introduction
U.S. Geological Survey National Shoreline Change
In coastal areas, the dynamic interfaces between water and land are often locations of concentrated residential and commercial development as well as Federal, State, and local municipal landholdings managed for recreation and conservation. These areas are frequently subjected to a range of natural hazards, which include flooding, storm effects, and coastal erosion. In response, the U.S. Geological Survey (USGS) is compiling existing reliable historical shoreline data along open-ocean sandy shores of the conterminous United States and parts of Alaska and Hawaii as part of the Coastal Change Hazards priority area. One component of this research effort documents changes in shoreline position, which are used as a proxy for coastal change. Shoreline position is one of the most monitored indicators of environmental change (Morton, 1996), and it is an easily understood feature marking the location of a beach through time.
A principal focus of the shoreline change effort has been to develop a consistent methodology for calculating shoreline change rates and reporting results that may be periodically updated when additional data or improved techniques are available. Since 2004, the USGS has been publishing results of shoreline monitoring work, organized and presented by coastal region, including the U.S. Gulf of Mexico coast (Morton and others, 2004), the Southeast Atlantic coast (Morton and Miller, 2005), California sandy shorelines (Hapke and others, 2006) and California coastal cliffs (Hapke and Reid, 2007), the New England and Mid-Atlantic coasts (Hapke and others, 2011), parts of the Hawaii coast (Fletcher and others, 2012), the Pacific Northwest coast (Ruggiero and others, 2013), and parts of the Alaska coast (Gibbs and Richmond, 2015; Gibbs and others, 2019). Updates to the Southeast Atlantic, Gulf, and Alaska coasts have also been published (Kratzmann and others, 2017; Himmelstoss and others, 2017; Gibbs and Richmond, 2017).
During Hurricane Irma in September 2017, Florida and Georgia sustained significant effects on beaches, dunes, barrier islands, and coral reefs. Extensive erosion and coral losses result in increased immediate and long-term hazards to shorelines that include densely populated regions. These hazards put critical infrastructure at risk for future flooding and erosion and may cause economic losses. This storm event presented an important opportunity for the USGS Coastal and Marine Hazards and Resources Program (CMHRP) to update shoreline datasets that could be used to evaluate coastal erosion along the southeastern U.S. coastline and potential vulnerability to future storms and changes in sea level. Shoreline positions were compiled, prior to and following Hurricane Irma, along the open-ocean sandy coasts of Georgia and Florida (fig. 1). Shoreline positions from the mid-1800s through 2018 were used to update the shoreline change rates for these regions. The shoreline positions and updated change rates can provide actionable information to homeowners, coastal communities, and managers of public and private properties to improve resiliency to long-term hazards.
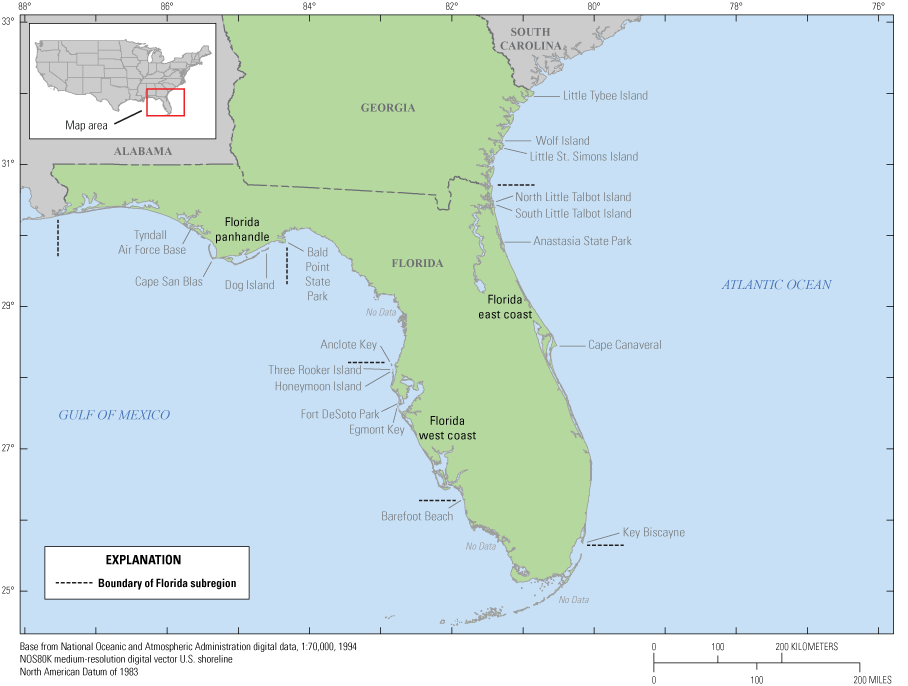
Map of the Georgia coastline and the three subregions of Florida (east coast, west coast, and panhandle).
This report is an update to previous reports for Georgia and Florida (Kratzmann and others, 2017; Himmelstoss and others, 2017) and includes updated rate-of-change calculations based on additional light detection and ranging (lidar) shoreline position data extracted using the profile method (Farris and others, 2018), improved rate metrics, and application of a proxy-datum bias correction on a transect-by-transect basis that quantifies potential bias and errors associated with integrating shorelines referenced to different proxies (Ruggiero and List, 2009). The proxy-datum bias accounts for the unidirectional onshore bias of proxy-based high water line shorelines relative to datum-based mean high water (MHW) shorelines. If this offset is not accounted for, shoreline change rates show slower shoreline retreat, progradation rather than retreat, or faster progradation than in reality (Ruggiero and List, 2009). The proxy-datum bias concept is explained further in Ruggiero and List (2009).
Several new datum-based MHW shorelines extracted from lidar elevation data are included in the analysis. Lidar dates range from 2006 to 2018. The full range of shoreline data is 1851 to 2018. The Florida coast has been divided into three subregions: Florida east coast (from the border with Georgia to Key Biscayne, Florida), Florida west coast (Anclote Key to Barefoot Beach), and Florida panhandle (Bald Point State Park to the Alabama border). Georgia is contained in a single dataset. The shoreline areas between Key Biscayne and Barefoot Beach, and Florida west coast and Florida panhandle have not been included in this study because of a lack of data and are marked as such on figure 1 between subregion boundary lines.
Calculation and Interpretation of Shoreline Change Results
Rates of long-term (approximately 150 years [yr]) and short-term (approximately 30 yr) shoreline change for the Georgia and Florida coasts (fig. 1) were computed within a geographic information system (GIS) by using the linear regression (LRR) calculation included in the Digital Shoreline Analysis System (DSAS) version 5 software (Himmelstoss and others, 2018a). DSAS was used to generate shore-orthogonal transects at 50-meter (m) spacing along the coast and to calculate change statistics (Himmelstoss and others, 2018b). The shoreline change rates and rate uncertainties at individual transect locations for Georgia and Florida are available in the data release associated with this report (Kratzmann and others, 2021). This report provides averaged rates of long-term and short-term shoreline change and the associated average rate uncertainty as a measure of broader scale trends. Maximum values of erosion and accretion are reported for both long- and short-term rates at individual locations for Georgia and each subregion of Florida.
A note regarding short-term (ST) rate data (Kratzmann and others, 2021): For ST rates, a value of 9999 in LRR, R-squared of linear regression (LR2), standard error of linear regression (LSE), and 90 percent confidence interval of linear regression (LCI90) in the shapefile’s attribute table indicates a null value. These were inserted because ArcGIS automatically changes a null value to a value of zero (which could be mistaken for a true zero) when a feature class is exported from a geodatabase to a shapefile (Esri, 2016), which was a necessary process step for the workflow of this project.
Following Ruggiero and others (2013), each transect rate uncertainty was reasoned to be partially independent of the others. Given that some cancellation of the uncertainties is likely in a regional analysis, and transect uncertainties are not likely to be independent of all the others, a partial independence approach reduces both overestimation and underestimation of the uncertainty (Ruggiero and others, 2013). To estimate the regionally averaged uncertainty of partially independent transect rates, the effective number of independent uncertainty values, n*, was evaluated. Following Garrett and Toulany (1981), n* was found based on the spatially lagged autocorrelation of measurement uncertainty. For our measurement uncertainty, we used each measure of shoreline change rate uncertainty. This method resulted in a large reduction of the original sample size, n. Assuming that the uncertainty of a region can be represented by , we found the uncertainty of a regionally averaged change rate as follows:
The reduced effective sample size (n*) was also determined for each subregion (Georgia, Florida east coast, Florida west coast, and Florida panhandle) by summing the n* values for individual subregions within the State. Average uncertainty values found using equation 1 are generally much smaller than the arithmetic mean confidence interval (CI) but larger than the quadrature-averaged CI (Ruggiero and others, 2013).
Results from Historical Shoreline Change Analysis
Shorelines compiled from previous assessments (Morton and others, 2004; Morton and Miller, 2005; Kratzmann and others, 2017; Himmelstoss and others, 2017) were combined with additional lidar shoreline position data and used to compute long- and short-term rates that incorporate the proxy-datum bias:
-
• In Georgia, the average bias value is 13.0 m.
-
• In Florida east coast, the average bias value is 10.7 m.
-
• In Florida west coast, the average bias value is 4.0 m.
-
• In Florida panhandle, the average bias value is 4.3 m.
Long-Term Shoreline Change
Averaged rates of long-term shoreline change and the associated average values of rate uncertainty for the coasts of Georgia and Florida are presented in table 1. In each subregion, the averaged long-term rates are considered statistically significant when the average rate is larger than the average reduced n CI, or in other words, when the range of the rate plus or minus (±) the uncertainty is entirely accretional (positive) or entirely erosional (negative).
The coast of Georgia exhibited the highest average rate of erosion in the long-term, −1.8±0.09 meter per year (m/yr). In Georgia, erosion occurred at 39 percent of the shoreline change transect locations (table 1). The maximum long-term erosion rate was observed at Wolf Island, Georgia, −10.6±1.8 m/yr (table 1, fig. 1). The maximum long-term accretion rate was 18.6±8.7 m/yr, at Little St. Simons Island, Georgia (table 1, fig. 1). Accretion occurred at 61 percent of the Georgia shoreline change transect locations, making this subregion the most accretional overall in the long-term (table 1).
Table 1.
Average long-term linear regression shoreline change rates, percentage of erosional transects, percentage of accretional transects, and locations of maximum values for Georgia, Florida east coast, Florida west coast, and Florida panhandle.[Positive rates indicate accretion or seaward movement; negative rates indicate erosion or landward movement. Bold text specifies confidence interval values that are less than the average rate, indicating that the rates are statistically significant. Locations are shown in figure 1. m/yr, meter per year; %, percent; n, sample size; CI, confidence interval]
The average erosion rate was −0.4±0.02 m/yr on Florida’s east coast, where erosion occurred at 42 percent of transect locations in the long-term (table 1). Here, the maximum long-term erosion rate was −8.1±4.5 m/yr at south Little Talbot Island, Florida (table 1, fig. 1). The maximum long-term accretion rate in Florida’s east coast was 9.8±3.0 m/yr at Anastasia State Park (table 1, fig. 1). Accretion occurred at 57 percent of transect locations in this subregion (table 1).
The average erosional rate was −0.7±0.03 m/yr on Florida’s west coast, where erosion occurred at 45 percent of transect locations in the long-term (table 1). The maximum long-term erosion rate on this stretch of coast was −5.1±0.8 m/yr at Egmont Key (table 1, fig. 1). The greatest long-term maximum accretion rate on the Florida west coast is 8.6±5.9 m/yr at Honeymoon Island (table 1, fig. 1). Accretion occurred at 55 percent of transect locations in this subregion (table 1).
The average erosional rate was −0.9±0.03 m/yr on the Florida panhandle, where erosion occurred at 61 percent of transect locations making this subregion the most erosional overall in the long-term (table 1). The greatest long-term erosion rate here was −7.3±4.0 m/yr at the beach at Tyndall Air Force Base (table 1, fig. 1). The maximum long-term accretion rate on the Florida panhandle was 10.3±10.9 m/yr at Cape San Blas (table 1, fig. 1). Accretion occurred at 39 percent of shoreline change transect locations in this subregion (table 1).
Short-Term Shoreline Change
Averaged rates of short-term shoreline change and the associated average values of rate uncertainty for the coasts of Georgia and Florida are presented in table 2. In each subregion, the averaged short-term rates are considered statistically significant when the average rate is larger than the average reduced n CI.
The greatest short-term average erosion rate was in Georgia, −2.7±0.13 m/yr, where erosion occurred at 44 percent of the shoreline change transect locations (table 2). The greatest maximum short-term erosion rate was observed on the Florida panhandle at Cape San Blas, −42.4±54.4 m/yr (table 2, fig. 1). While this erosion rate is large, it is not statistically significant. The greatest short-term average accretion rate was in Georgia, 3.4±0.14 m/yr (table 2). The greatest maximum short-term accretion rate was measured on the Florida panhandle at Dog Island, 29.3±44.6 m/yr (table 2, fig. 1). Several of the short-term maximum accretion rates are not statistically significant (table 2).
Table 2.
Average short-term linear regression shoreline change rates, percentage of erosional transects, percentage of accretional transects, and locations of maximum values for Georgia, Florida east coast, Florida west coast, and Florida panhandle.[Positive rates indicate accretion or seaward movement; negative rates indicate erosion or landward movement. Bold text specifies confidence interval values that are less than the average rate, indicating that the rates are statistically significant. Locations shown in figure 1. m/yr, meter per year; %, percent; n, sample size; CI, confidence interval]
The short-term average erosion rate for Florida’s east coast was −0.5±0.02 m/yr, and the average accretion rate was 0.8±0.02 m/yr (table 2). The maximum short-term erosion rate was −10.4±3.2 m/yr, observed at south Little Talbot Island, Florida (table 2, fig. 1). Greater average rates of erosion and accretion were measured on Florida’s west coast. Here, the short-term average erosion rate was −1.4 ±0.07 m/yr, and the average accretion rate was 1.6±0.06 m/yr (table 2). The maximum short-term erosion rate on Florida’s west coast was −13.5±5.4 m/yr at Three Rooker Bar (table 2, fig. 1). The short-term average erosion rate on the Florida panhandle was −1.5±0.06 m/yr, and the average accretion rate was 1.6±0.11 m/yr (table 2).
Summary
The U.S. Geological Survey presents updated calculations of long-term and short-term rates of shoreline change for Georgia and Florida as part of the Coastal Change Hazards programmatic focus. This update includes lidar shorelines before and after Hurricane Irma, which made landfall in Florida in September of 2017. The updated calculations incorporate additional lidar shoreline position data ranging from 2006 to 2018. The calculation of uncertainty associated with the long-term average rates has also been refined. The coast of Georgia exhibited the highest average rates of erosion and accretion in both the long term and short term. Individual measurement transects for the States of Georgia and Florida can be found in the data release that accompanies this report (Kratzmann and others, 2021). Data for other open-ocean shoreline regions along the United States coast can be viewed in the USGS Coastal Change Hazards portal at https://marine.usgs.gov/coastalchangehazardsportal/.
References Cited
Esri, 2016, Problem—Feature classes exported from XY data layers with null coordinate values have zeros as coordinate values: Esri Technical Support web page, accessed April 12, 2022, at https://support.esri.com/en/technical-article/000004442.
Farris, A.S., Weber, K.M., Doran, K.S., and List, J.H., 2018, Comparing methods used by the U.S. Geological Survey Coastal and Marine Geology Program for deriving shoreline position from lidar data: U.S. Geological Survey Open-File Report 2018–1121, 13 p., accessed October 21, 2019, at https://doi.org/10.3133/ofr20181121.
Fletcher, C.H., Romine, B.M., Genz, A.S., Barbee, M.M., Dyer, M., Anderson, T.R., Lim, S.C., Vitousek, S., Bochicchio, C., and Richmond, B.M., 2012, National assessment of shoreline change—Historical shoreline change in the Hawaiian Islands: U.S. Geological Survey Open-File Report 2011–1051, 55 p., accessed October 21, 2019, at https://doi.org/10.3133/ofr20111051.
Garrett, C., and Toulany, B., 1981, Variability of the flow through the Strait of Belle Isle: Journal of Marine Research, v. 39, nos. 01–09, p. 163–189, accessed October 21, 2019, at https://images.peabody.yale.edu/publications/jmr/jmr39-01-09.pdf.
Gibbs, A.E., and Richmond, B.M., 2015, National assessment of shoreline change—Historical shoreline change along the north coast of Alaska, U.S.-Canadian border to Icy Cape: U.S. Geological Survey Open-File Report 2015–1048, 96 p., accessed October 21, 2019, at https://doi.org/10.3133/ofr20151048.
Gibbs, A.E., and Richmond, B.M., 2017, National assessment of shoreline change—Summary statistics for updated vector shorelines and associated shoreline change data for the north coast of Alaska, U.S.-Canadian border to Icy Cape: U.S. Geological Survey Open-File Report 2017–1107, 21 p., accessed October 21, 2019, at https://doi.org/10.3133/ofr20171107.
Gibbs, A.E., Snyder, A.G., and Richmond, B.M., 2019, National assessment of shoreline change—Historical shoreline change along the north coast of Alaska, Icy Cape to Cape Prince of Wales: U.S. Geological Survey Open-File Report 2019–1146, 52 p., accessed April 8, 2020, at https://doi.org/10.3133/ofr20191146.
Hapke, C.J., Himmelstoss, E.A., Kratzmann, M.G., List, J.H., and Thieler, E.R., 2011, National assessment of shoreline change—Historical shoreline change along the New England and Mid-Atlantic coasts: U.S. Geological Survey Open-File Report 2010–1118, 57 p., accessed October 21, 2019, at https://doi.org/10.3133/ofr20101118.
Hapke, C.J., and Reid, D., 2007, National assessment of shoreline change part 4—Historical coastal cliff retreat along the California coast: U.S. Geological Survey Open-File Report 2007–1133, 51 p., accessed October 21, 2019, at https://doi.org/10.3133/ofr20071133.
Hapke, C.J., Reid, D., Richmond, B.M., Ruggiero, P., and List, J.H., 2006, National assessment of shoreline change part 3—Historical shoreline change and associated coastal land loss along the sandy shorelines of the California coast: U.S. Geological Survey Open-File Report 2006–1219, 72 p., accessed October 21, 2019, at https://doi.org/10.3133/ofr20061219.
Himmelstoss, E.A., Farris, A.S., Henderson, R.E., Kratzmann, M.G., Ergul, A., Zhang, O., Zichichi, J.L., and Thieler, E.R., 2018a, Digital Shoreline Analysis System (version 5.0): U.S. Geological Survey software release, accessed October 21, 2019, at https://code.usgs.gov/cch/dsas.
Himmelstoss, E.A., Henderson, R.E., Kratzmann, M.G., and Farris, A.S., 2018b, Digital Shoreline Analysis System (DSAS) version 5.0 user guide: U.S. Geological Survey Open-File Report 2018–1179, 110 p., accessed October 21, 2019, at https://doi.org/10.3133/ofr20181179.
Himmelstoss, E.A., Kratzmann, M.G., and Thieler, E.R., 2017, National assessment of shoreline change—A GIS compilation of updated vector shorelines and associated shoreline change data for the Gulf of Mexico coast: U.S. Geological Survey data release, accessed October 21, 2019, at https://doi.org/10.5066/F78P5XNK.
Kratzmann, M.G., Farris, A.S., Weber, K.M., Henderson, R.E., and Himmelstoss, E.A., 2021, USGS national shoreline change—A GIS compilation of updated vector shorelines (1800s–2010s) and associated shoreline change data for the Georgia and Florida Coasts: U.S. Geological Survey data release, accessed September 29, 2021, at https://doi.org/10.5066/P9J3CVN4.
Kratzmann, M.G., Himmelstoss, E.A., and Thieler, E.R., 2017, National assessment of shoreline change—A GIS compilation of updated vector shorelines and associated shoreline change data for the Southeast Atlantic coast: U.S. Geological Survey data release, accessed October 21, 2019, at https://doi.org/10.5066/F74X55X7.
Morton, R.A., and Miller, T.L., 2005, National assessment of shoreline change—Part 2, Historical shoreline changes and associated coastal land loss along the U.S. Southeast Atlantic Coast: U.S. Geological Survey Open-File Report 2005–1401, 35 p., accessed October 21, 2019, at https://doi.org/10.3133/ofr20051401.
Morton, R.A., Miller, T.L., and Moore, L.J., 2004, National assessment of shoreline change—Part 1, Historical shoreline changes and associated coastal land loss along the U.S. Gulf of Mexico: U.S. Geological Survey Open-File Report 2004–1043, 44 p., accessed October 21, 2019, at https://doi.org/10.3133/ofr20041043.
Ruggiero, P., Kratzmann, M.G., Himmelstoss, E.A., Reid, D., Allan, J., and Kaminsky, G., 2013, National assessment of shoreline change—Historical shoreline change along the Pacific Northwest coast: U.S. Geological Survey Open-File Report 2012–1007, 62 p., accessed October 21, 2019, at https://doi.org/10.3133/ofr20121007.
Ruggiero, P., and List, J.H., 2009, Improving accuracy and statistical reliability of shoreline position and change rate estimates: Journal of Coastal Research, v. 255, p. 1069–1081, accessed October 21, 2019, at https://doi.org/10.2112/08-1051.1.
Abbreviations
CI
confidence interval
CMHRP
Coastal and Marine Hazards and Resources Program (USGS)
DSAS
Digital Shoreline Analysis System
GIS
geographic information system
LCI
confidence interval of linear regression
LCI90
90 percent confidence interval of linear regression
lidar
light detection and ranging
LR2
R-squared of linear regression
LRR
linear regression rate
LSE
standard error of linear regression
LT
long term
MHW
mean high water
ST
short term
USGS
U.S. Geological Survey
For more information about this report, contact:
Director, Woods Hole Coastal and Marine Science Center
U.S. Geological Survey
384 Woods Hole Road
Quissett Campus
Woods Hole, MA 02543–1598
508–548–8700 or 508–457–2200
whsc_science_director@usgs.gov
or visit our website at
https://www.usgs.gov/centers/whcmsc
Publishing support provided by the
Pembroke Publishing Service Center
Disclaimers
Any use of trade, firm, or product names is for descriptive purposes only and does not imply endorsement by the U.S. Government.
Although this information product, for the most part, is in the public domain, it also may contain copyrighted materials as noted in the text. Permission to reproduce copyrighted items must be secured from the copyright owner.
Suggested Citation
Kratzmann, M.G., 2022, U.S. Geological Survey national shoreline change— Summary statistics for updated vector shorelines (1800s–2010s) and associated shoreline change data for the Georgia and Florida coasts: U.S. Geological Survey Data Report 1156, 8 p., https://doi.org/10.3133/dr1156.
ISSN: 2771-9448 (online)
Study Area
| Publication type | Report |
|---|---|
| Publication Subtype | USGS Numbered Series |
| Title | U.S. Geological Survey national shoreline change— Summary statistics for updated vector shorelines (1800s–2010s) and associated shoreline change data for the Georgia and Florida coasts |
| Series title | Data Report |
| Series number | 1156 |
| DOI | 10.3133/dr1156 |
| Publication Date | May 06, 2022 |
| Year Published | 2022 |
| Language | English |
| Publisher | U.S. Geological Survey |
| Publisher location | Reston, VA |
| Contributing office(s) | Woods Hole Coastal and Marine Science Center |
| Description | Report: vi, 8 p.; Data Release |
| Country | United States |
| State | Florida, Georgia |
| Online Only (Y/N) | Y |
| Additional Online Files (Y/N) | N |