

Groundwater and Surface-Water Data Collection for the Walla Walla River Basin, Washington, 2018–22
Links
- Document: Report (3.7 MB pdf) , HTML , XML
- Data Release: USGS data release - Dataset of groundwater and surface water data collection for the Walla Walla Basin in Washington, 2018–2022
- NGMDB Index Page: National Geologic Map Database Index Page (html)
- Download citation as: RIS | Dublin Core
Acknowledgments
The authors thank the well owners, farmers, and irrigators for providing access to wells. The authors also wish to thank the Walla Walla Basin Watershed Council, Columbia and Walla Walla Counties, Washington, and the Washington State Department of Ecology for assisting the compilation of well information.
Abstract
The semi-arid Walla Walla River Basin (WWRB) spans 1777 square miles in the states of Washington and Oregon and supports a diverse agricultural region as well as cities and rural communities that are partially reliant on groundwater. Historically, surface water and groundwater data have been collected in the WWRB by several entities including federal, state, local, and tribal governments; irrigation districts; universities; and non-profits. This report describes the surface and groundwater data collection by the U.S. Geological Survey from February 2018 to April 2022 to provide the Washington State Department of Ecology and other stakeholders basic knowledge of existing water resources in the WWRB, Washington. Additionally, the data were collected to build a long-term groundwater dataset, with the intent to provide data for better understanding to assist in informed decisions about groundwater use, management, and conservation throughout the basin, and for future inclusion in a conceptual model of the groundwater-flow system (conceptual model). Data were collected and compiled for 237 sites—191 wells and 46 surface-water discharge sites. A small annual network of deep basalt wells was established in February 2018 to commence the data collection. In March 2020 and April 2021, additional field inventories were performed by locating and measuring groundwater wells in the WWRB. A subset of the inventoried wells were selected for an annual or a quarterly water level network to be measured until July 2024. In August 2020, field reconnaissance identified 46 surface-water sites to be measured for discharge, estimating gaining and losing reaches in streams for groundwater influences.
Introduction
In the Walla Walla River Basin (WWRB) in southeastern Washington and northeastern Oregon (fig. 1), groundwater is an important resource for domestic, agricultural, municipal, and industrial use. In the WWRB, groundwater is recharged by seasonal precipitation with most falling as rain or snow in the winter (November–March) (NCEI, 2022). After the snowpack melts in spring and early summer, groundwater remains the primary water supply in the WWRB. In late summer and early autumn, groundwater discharge to streams and creeks sustains fish and aquatic ecosystems. Water supply in the WWRB does not meet existing demands, and the Washington State Department of Ecology (WDOE) recognized that declining groundwater levels and resultant decrease in summer and early autumn streamflows are of great supply and ecological concern.
In response to declining water levels and demands, WDOE recently (2019) established a multi-year, strategic planning effort with Walla Walla Water Management Partnership, Confederate Tribes of the Umatilla Indian Reservation, Washington and Oregon stakeholders, and residents that will guide water-resource decisions that address these concerns for the next 30 years in the WWRB.
One initial goal of this project was the collection of new groundwater and surface water data to establish baseline information. Monitoring groundwater levels in conjunction with streamflow is necessary to understand the complex groundwater and surface-water interactions. The data will also improve the understanding of the hydrologic system and will contribute to the development of a conceptual model for the WWRB.
Purpose and Scope
The purpose of this report is to describe the groundwater and surface water data collected from February 2018 to April 2022 by the U.S. Geological Survey (USGS) on the Washington side of the WWRB study area. The topics covered in this report consist of a description of the area, the process of groundwater well selection, the initial field well inventory along with the networks established from these sites, and a description of the methods for making low-flow stream discharge measurements. A total of 46 surface water sites were measured to calculate discharge, and 191 groundwater wells were inventoried for lithology information, with 142 of the wells with a measurable depth to water.
Description of Study Area
The Walla Walla River Basin occupies approximately 1,777 square miles in Walla Walla and Columbia Counties, Washington, and Umatilla and Wallowa County, Oregon (fig. 1). The basin drains westward from the Blue Mountains, which reach approximately 5,900 feet (ft) in elevation in the eastern region of the study area. The Horse Heaven Hills form a ridgeline that bounds the basin to the south, intersecting the Columbia River at Wallula Gap just south of the confluence with the Walla Walla River. In the northern portion of the study area, the rolling Palouse Hills support extensive dryland farming. The Walla Walla and Mill Creek Valleys are gently sloping broad plains that are home to municipalities, farms, and a growing wine industry.
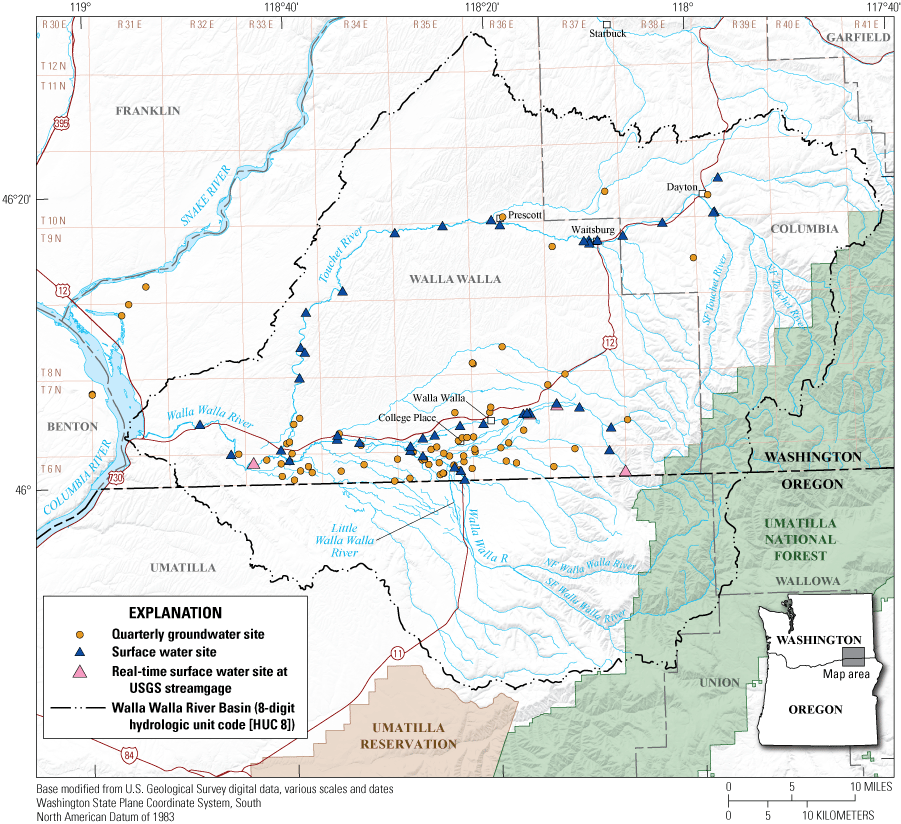
Study area, Walla Walla River Basin, Washington. For individual site labels, see figures 2 and 3.
Geologically, the WWRB consists of the Miocene-aged Columbia River Basalt Group (CRBG) overlain by Miocene-Pliocene and Quaternary sediments. The CRBG forms a thick sequence of lavas and thin sedimentary interbeds that dip westward from the Blue Mountains. Faults define the fronts of the Blue Mountains and the Horse Heaven Hills. Pleistocene sediments drape the landscape, including thick loess (windblown silt) deposits in the Palouse hills and fine-grained slackwater deposits from the Missoula Floods. Alluvial fans have filled much of the basin with clastic sediments eroded from the Blue Mountains. The CRBG and alluvium form the two major aquifers in the region (Newcomb, 1965; Derkey and others, 2006; Kahle and others, 2011).
Streams flow westward through narrow bedrock canyons in the mountainous eastern region. Broad alluvial fans form where streams spill out from the Blue Mountains. Distributary channels and springs are found along the fan surfaces. The North Fork and South Forks of the Walla Walla River converge near the city of Milton-Freewater and are joined by Mill Creek which flows from the north. In the northern part of the study area, the Touchet River flows out of the Blue Mountains near Dayton, flowing westward before turning south and joining the Walla Walla River as a major tributary. Groundwater in the WWRB is primarily found in the gravel aquifer consisting of shallow unconsolidated sediments in the central lowlands and valley bottoms and deeper fractured basalt aquifers underlying the entire basin (Pickett, 2011).
The upper reaches of the WWRB are mountainous and forested, whereas the downstream low-lying areas are semiarid and mostly agricultural. Elevations range from 340 ft at the mouth of the Walla Walla River to 6,250 ft at the highest point at the Blue Mountains. Annual precipitation across the basin varies between areas of lowlands with those in the mountains. The 30-year climate normals data from the Walla Walla Regional airport shows the middle of the WWRB winter (November–March) to be cool, with temperature between 30–56 degrees Fahrenheit and precipitation of over 16.5 inches falling in the form of rain and snow. During spring and autumn (April–October) the temperatures range from 42 to 90 degrees Fahrenheit and total precipitation of 8.5 inches of primarily rain (National Centers for Environmental Information, 2022).
The primary land cover type in the WWRB is agricultural (54 percent of the land), primarily irrigated and dryland farming. About 25 percent of the basin areas is rangeland of shrubs and grassland and 17 percent is forested. Approximately 4 percent of the WWRB is developed (Dewitz, 2019). The main crops by area grown in the WWRB are wheat for grain, vegetables, hay, dry peas, and apples (U.S. Department of Agriculture, 2017). On the Washington side of the basin, the largest towns are Walla Walla and College Place, with a combined population of approximately 44,000 (U.S. Census Bureau, 2020). Other towns in the project area include Lowden, Gardena, Touchet, Dixie, Waitsburg, Dayton, and Prescott.
Surface Water and Groundwater Measurement Methods
Synoptic streamflow measurements were collected during low-flow conditions at 42 non-gaged locations from August 10 to August 12, 2020, to augment streamflow data from 4 active USGS stream gages in the study area (fig. 2). Streamflow measurements were collected by USGS personnel using a FlowTracker handheld Acoustic Doppler Velocimeter and calculated discharge using the “mid-section measurement” method. Measurements were made by USGS personnel following procedures in outlined in the USGS Techniques and Methods report 3-A8 “Discharge Measurements at Gaging Stations” (Turnipseed and Sauer, 2010), and reported in cubic feet per second. This report provides detailed, illustrated instructions for the implementation of common field methods and equipment for measuring streamflow. We assigned a ratings accuracy to each measurement based on equipment, number of verticals, stability of stage, wind conditions, and the accuracy of depth and velocity measurements. An “excellent” accuracy rating indicated that the measurements were judged to be within 2 percent of true value, “good” indicates within 5 percent of true values, “fair” indicates within 8 percent of true values, and “poor” greater than 8 percent of true values (Turnipseed and Sauer, 2010).
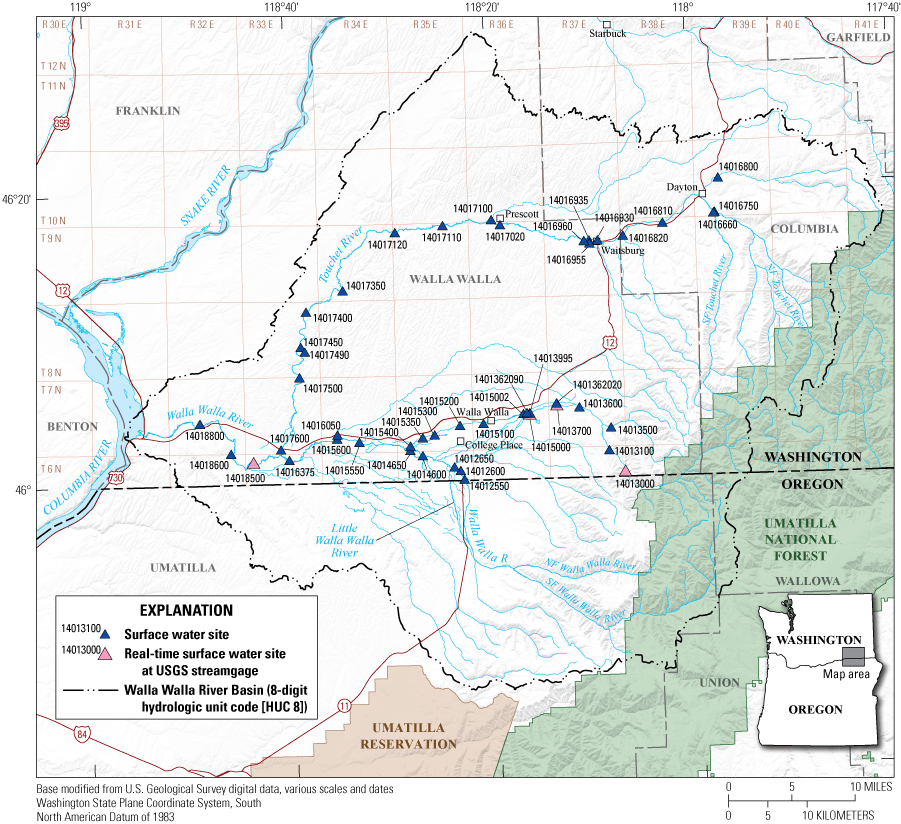
Surface water site locations, Walla Walla River Basin, Washington.
Available groundwater well records were compiled from multiple sources and sites were field located in February 2018, March 2020, and April 2021. Sources included the USGS National Water Information System database (USGS, 2022), WDOE Well Report Viewer database (WDOE, 2022), Walla Walla Basin Watershed Council (2021), and local city water departments. Well selection was prioritized on the availability of a driller’s well report, the availability of lithologic and construction information on the driller’s report, and permission from the owner or tenant to visit the well. Wells were also selected to represent a geographic and depth distribution across the Washington portion of the WWRB. At the time of the field inventory, a field form was completed noting the location, well construction information, any construction changes noted by the owner, and water level when accessible for each well.
Global Positioning System (GPS) hand-held units were used to record latitude and longitude at each site, on field sheets after water-level measurements were completed, to give sufficient time for GPS readings to stabilize. Values recorded were double-checked with the GPS unit before departing the site. Land-surface altitudes for each well were obtained from a digital elevation model with 10-square-meter cells using the GPS coordinates recorded on each field sheet. Public information for each well was either used to create a new site or update an existing site in the in the NWIS database.
A sketch map showing the location and access to the well was included on the field sheet. Sketch maps included measured distances from road intersections and estimated distances from identifiable site features such as, buildings, driveways, creeks, or fences. Additional details to access the well head were included on the maps when needed. The sketches and details assisted in subsequent visits as well as a site confirmation. Known construction changes and owners concern of water quality and quantity were also recorded on the field sheets.
In wells that were accessible, water levels were measured with USGS Hydrologic Instrumentation Facility calibrated steel or electronic tapes. All water-level measurements were made by USGS personnel, following USGS procedures outlined in USGS Techniques and Methods report 1-A1 “Groundwater Technical Procedures of the U.S. Geological Survey” (Cunningham and Schalk, 2011) and reported in feet below land surface. Water-level measurements were confirmed to with a subsequent measurement taken 3–5 minutes later. When readings varied greater than 0.02 ft, additional measurements were taken to determine the status of the water level reading, for example static, pumping, recently pumped, or nearby pumping.
Of the 191 field-inventoried wells (fig. 3), 99 wells were selected for either the annual or quarterly groundwater network operated by USGS personnel. All hydrologic data collected during this study were compiled and entered in the USGS NWIS database and present in a data release (Fasser, 2022).
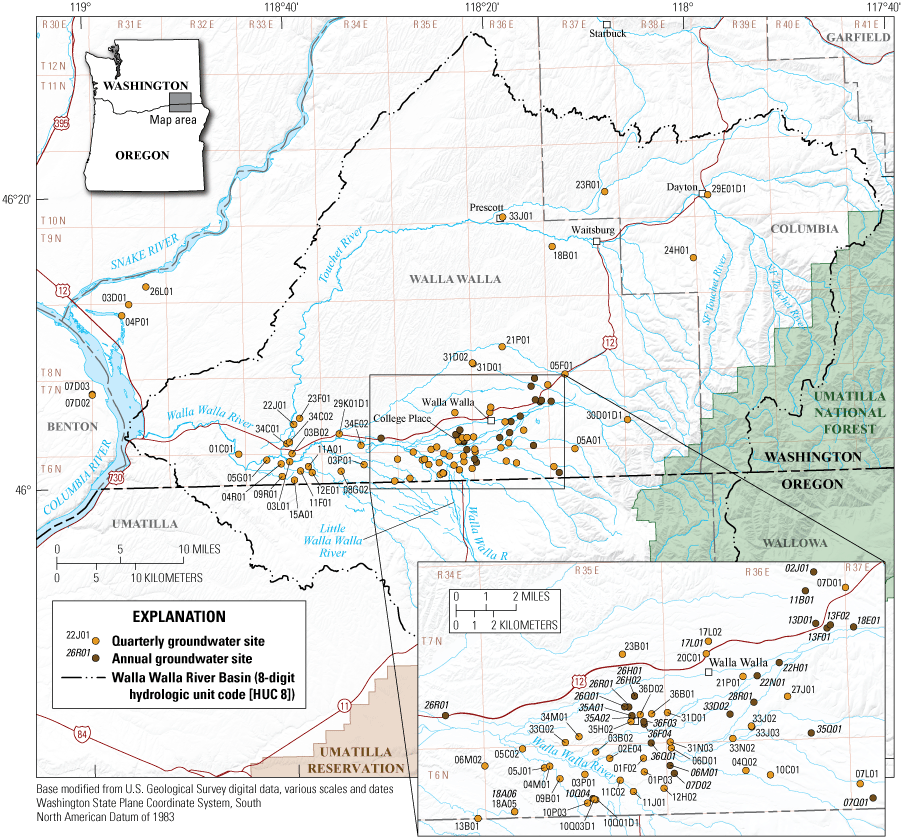
Groundwater site locations, Walla Walla River Basin, Washington.
Results
The primary components of this investigation were measuring stream discharge in low-flow conditions, a field inventory of wells, and establishing an annual and quarterly network. These data will be used to better understand the complexity of the Walla Walla River Basin and provide information to a conceptual model. Water level and stream discharge measurements are available on NWIS and in a ScienceBase Data Release (Fasser, 2022).
Streamflow Measurements
Stream measurements were collected at 42 non-gaged locations in August 2020 to supplement streamflow data collected at 4 active USGS gaging stations in the study area (fig. 2). Measured discharge ranged from “0.00,” or dry stream beds, at Whetstone Hollow at Prescott, WA (14017100) and Touchet River Tributary near Lowden, WA (14017490) to 47.6 cubic feet per second at Touchet River near Dayton, WA (14016810). The stream width ranged from 3.2 to 68.5 ft and mean velocity ranged from 0.11 to 2.56 ft per second at the measurement section. Eighty-nine percent of the measurements were rated fair or better with only 11 percent rated as poor because of low-water conditions.
Groundwater Network
In 2018, a preliminary field inventory began to verify the location and access of 62 wells in basalt bedrock units (basalt wells) in which water levels were previously measured by USGS staff in the 1970 and 1980s. Twenty-seven wells were successfully located and had either measurable or reported water levels. Annual water level measurements were made at these wells from 2019 through 2022 in winter months (February and March), before the irrigation season. In 2020, annual water level measurements were made at 18 additional wells. In April 2021, an additional field effort inventoried more than 145 wells in the Walla Walla River Basin, for a total of 191 wells visited between February 2018 and April 2022 providing a spatial and depth distribution across the Washington side of the WWBR.
The annual network of 28 wells visited from February 2018 to February 2022 with depths of wells ranged from 102 to 2,730 ft and the depths to water ranged from 331.0 ft below the land surface to flowing. The number of wells visited each year was dependent on accessibility during the field week. The quarterly network of 73 wells were measured in January, April, July, and October. Wells were added to the network as they were inventoried, therefore they might not have a complete year of water level data. The depths of the wells ranged from 30 to 1,301 ft below land surface and the depths to water level ranged from 5.2 to 447.7 ft below land surface. This network was reduced to 59 wells in April 2022 and will continue through July 2024.
Water levels fluctuations over the period of data collection can be seen when viewed in hydrographs (fig. 4). The seasonal changes can be seen in the hydrograph of 06N/34E-13B01 (460004118295301) with a completed well depth of 85 ft. Water level changes over the collection period and seasonally can be seen in the hydrograph of 06N/35E-18A06 (460014118282201) with a well depth of 235 ft.
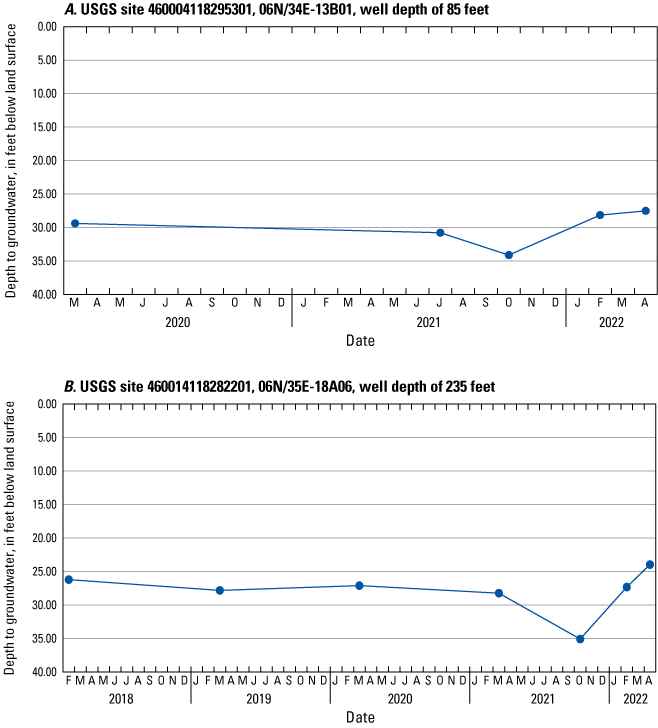
Monthly water level in wells 06N/34E-13B01 (460004118295301) and 06N/35E-18A06 (460014118282201), Walla Walla County, eastern Washington, 2018–22.
Summary
Groundwater and surface water data were collected from February 2018 to April 2022 to provide basic knowledge of existing water resources and hydrologic data needed for completion of a conceptual model of the Walla Walla River Basin. This information will inform planning and water management decisions at a basin-wide scale. Data were collected and compiled for 237 total sites—191 wells and 46 surface water sites throughout the Washington side of the Walla Walla River Basin. Annual and quarterly monitoring networks were established from the field inventories and selected wells from these networks will continue to be measured until July 2024. In August 2020, 46 sites were measured for baseflow discharge measurements to be used for estimating groundwater contribution to surface flow.
References Cited
Cunningham, W.L., and Schalk, C.W., comps., 2011, Groundwater technical procedures of the U.S. Geological Survey: U.S. Geological Survey Techniques and Methods 1–A1, 151 p. [Also available at https://pubs.usgs.gov/tm/1a1/.]
Derkey, R.E., Stradling, D., Lindsey, K.A., and Tolan, T.L, 2006, Geologic map of the College Place and Walla Walla 7.5-minute Quadrangles, Walla Walla County, Washington, and Umatilla County, Oregon: Washington State Department of Natural Resources, accessed April 25, 2022, at https://www.dnr.wa.gov/publications/ger_gm62_geol_map_collegeplace_wallawalla_24k.pdf.
Dewitz, J., 2019, National Land Cover Database (NLCD) 2016 Products (ver. 2.0, July 2020): U.S. Geological Survey data release, accessed on April 28, 2022, at https://doi.org/10.5066/P96HHBIE.
Fasser, E.T., 2022, Dataset of groundwater and surface water data collection for the Walla Walla Basin in Washington, 2018–2022: U.S. Geological Survey data release, https://doi.org/10.5066/P9D2C2DK.
Kahle, S.C., Morgan, D.S., Welch, W.B., Ely, D.M., Hinkle, S.R., Vaccaro, J.J., and Orzol, L.L., 2011, Hydrogeologic framework and hydrologic budget components of the Columbia Plateau Regional Aquifer System, Washington, Oregon, and Idaho: U.S. Geological Survey Scientific Investigations Report 2011–5124, 66 p., accessed April 22, 2022, at https://doi.org/10.3133/sir20115124.
National Centers for Environmental Information, 2022, Walla Walla Regional Airport, WA: National Centers for Environmental Information U.S. Climate normals database, accessed April 28, 2022, at https://www.ncei.noaa.gov/access/us-climate-normals/#dataset=normals-monthly&timeframe=30&location=WA&station=USW00024160.
Newcomb, R.C., 1965, Geology and Ground-water Resources of the Walla Walla River Basin Washington-Oregon: Washington Department of Ecology, Water Supply Bulletin, no. 21, 162 p., accessed April 22, 2022, at https://apps.ecology.wa.gov/publications/documents/wsb21.pdf.
Pickett, P.J., 2011, Walla Walla Watershed Planning Area, Prediction of gaged streamflows by modeling: Washington Department of Ecology, Publication No. 11-03-002, 86 p., accessed April 22, 2022, at https://apps.ecology.wa.gov/publications/documents/1103002.pdf.
Turnipseed, D.P., and Sauer, V.B., 2010, Discharge measurements at gaging stations: U.S. Geological Survey Techniques and Methods book 3, chap. A8, 87 p. [Also available at https://pubs.usgs.gov/tm/tm3-a8/.]
U.S. Census Bureau, 2020, QuickFacts—Walla Walla city, Washington—College Place city, Washington—Walla Walla County, Washington: U.S. Census Bureau webpage, accessed on April 28, 2022, at https://www.census.gov/quickfacts/fact/table/wallawallacitywashington,collegeplacecitywashington,wallawallacountywashington/PST045221.
U.S. Geological Survey [USGS], 2022, USGS Groundwater data for the Nation: U.S. Geological Survey National Water Information System, accessed April 28, 2022, at https://waterdata.usgs.gov/nwis/gw.
Walla Walla Basin Watershed Council, 2020, Groundwater and Surface Water Monitoring: Walla Walla Basin Watershed Council monitoring database, accessed March 4, 2020, at https://wwbwc.org.
Washington State Department of Ecology [WDOE], 2022, Well construction & licensing: Washington State Department of Ecology Well Report Viewer database, accessed January 15, 2020, at https://appswr.ecology.wa.gov/wellconstruction/map/WCLSWebMap/default.aspx.
Conversion Factors
Datums
Horizontal coordinate information is referenced to the North American Datum of 1983 (NAD 83).
Elevation, as used in this report, refers to distance above the vertical datum, North American Vertical Datum of 1988 (NAVD88).
For information about the research in this report, contact
Director, Washington Water Science Center
U.S. Geological Survey
934 Broadway, Suite 300
Tacoma, Washington 98402
https://www.usgs.gov/centers/wa-water
Manuscript approved on August 30, 2022
Publishing support provided by the U.S. Geological Survey
Science Publishing Network, Tacoma Publishing Service Center
Disclaimers
Any use of trade, firm, or product names is for descriptive purposes only and does not imply endorsement by the U.S. Government.
Although this information product, for the most part, is in the public domain, it also may contain copyrighted materials as noted in the text. Permission to reproduce copyrighted items must be secured from the copyright owner.
Suggested Citation
Fasser, E.T., and Dunn, S.B., 2022, Groundwater and surface-water data collection for the Walla Walla River Basin, Washington, 2018–22: Data Report 1163, 8 p., https://doi.org/10.3133/dr1163.
ISSN: 2771-9448 (online)
Study Area
| Publication type | Report |
|---|---|
| Publication Subtype | USGS Numbered Series |
| Title | Groundwater and surface-water data collection for the Walla Walla River Basin, Washington, 2018–22 |
| Series title | Data Report |
| Series number | 1163 |
| DOI | 10.3133/dr1163 |
| Publication Date | September 26, 2022 |
| Year Published | 2022 |
| Language | English |
| Publisher | U.S. Geological Survey |
| Publisher location | Reston, VA |
| Contributing office(s) | Washington Water Science Center |
| Description | Report: vi, 8 p.; Data Release |
| Country | United States |
| State | Oregon, Washington |
| Other Geospatial | Walla Walla River basin |
| Online Only (Y/N) | Y |