

Evaluating Water-Quality Conditions in the Mainstem and Tidal Reaches of the Merrimack River in Massachusetts, June to September 2020
Links
- Document: Report (1.77 MB pdf) , HTML , XML
- Data Release: USGS data release - Water quality data for discrete samples and continuous monitoring on the Merrimack River, Massachusetts, June to September 2020
- NGMDB Index Page: National Geologic Map Database Index Page (html)
- Download citation as: RIS | Dublin Core
Acknowledgments
The authors gratefully acknowledge the following people and groups for their assistance in providing access to their properties on the Merrimack River: Michael Magnifico of the Massachusetts Department of Conservation and Recreation; Jed Koehler of the Greater Lawrence Community Boating Program; Mark Leonard and Paul Morrell of Phillips Academy, Andover; Mark Frontiero of Goodwin Creek Marina, Amesbury; Kristen Corbin of Bridge Marina, Salisbury; Commodore John Manning and John Marchand of the Lowell Motor Boat Club; Chief Wesley Russell and Deputy Chief Patrick Sands of the Tyngsborough Fire Department; Professor Sheree Pagsuyoin of the University of Massachusetts, Lowell; and Jessica Winieki of Haverhill. Special thanks to the Massachusetts Department of Environmental Protection Watershed Planning Program and to U.S. Geological Survey colleagues David Armstrong, Samuel Banas, Kimberly Campo, Michael Colombo, Connor Meoli, and Jennifer Savoie for their logistical support and field assistance.
Abstract
In summer and early fall (June to September) 2020, water-quality data were collected at 13 stations along the mainstem of the Merrimack River and into the Merrimack River estuary. The data are allocated among three different datasets: discrete water sample data, discrete vertical profile data, and continuous data. The collective purpose of these datasets is to enable assessment of the overall water-quality conditions in the Merrimack River and estuary and to identify areas for potentially more targeted water-quality monitoring in the future.
The highest concentrations of nutrients—nitrogen and phosphorus—were found at the stations downstream from wastewater treatment plants in Lowell, Lawrence, and Haverhill. Nutrient concentrations measured in the Merrimack River estuary were not as high as those measured in the Merrimack River, indicating that other processes are affecting nutrient concentrations in the system. These data were collected coincident with a severe flash drought in New England. Analysis of the vertical profile and continuous data indicated that, for intermittent periods up to 5 days, water quality in some sections of the Merrimack River may not support designated uses for the waterbody as established in the Massachusetts surface water quality standards.
Introduction
The 5,010-square mile watershed of the Merrimack River is the fourth largest in New England. The Massachusetts section of the Merrimack River begins in Tyngsborough, Massachusetts, at the New Hampshire State line and travels roughly eastward to the northeastern coast of Massachusetts (fig. 1). The Merrimack River is an important resource in the area, serving as a source of public drinking water supply for seven towns in Massachusetts and the receiving water for wastewater treatment plants (WWTPs) in Lowell, Lawrence, Haverhill, Merrimac, Salisbury, and Newburyport. The river also acts as the receiving waterbody for multiple combined sewer overflow discharges in Haverhill, Lowell, and Lawrence (U.S. Environmental Protection Agency, 2018). These combined sewer overflows have been shown to affect water-quality conditions during some large storms (Merrimack River Watershed Council, 2020).
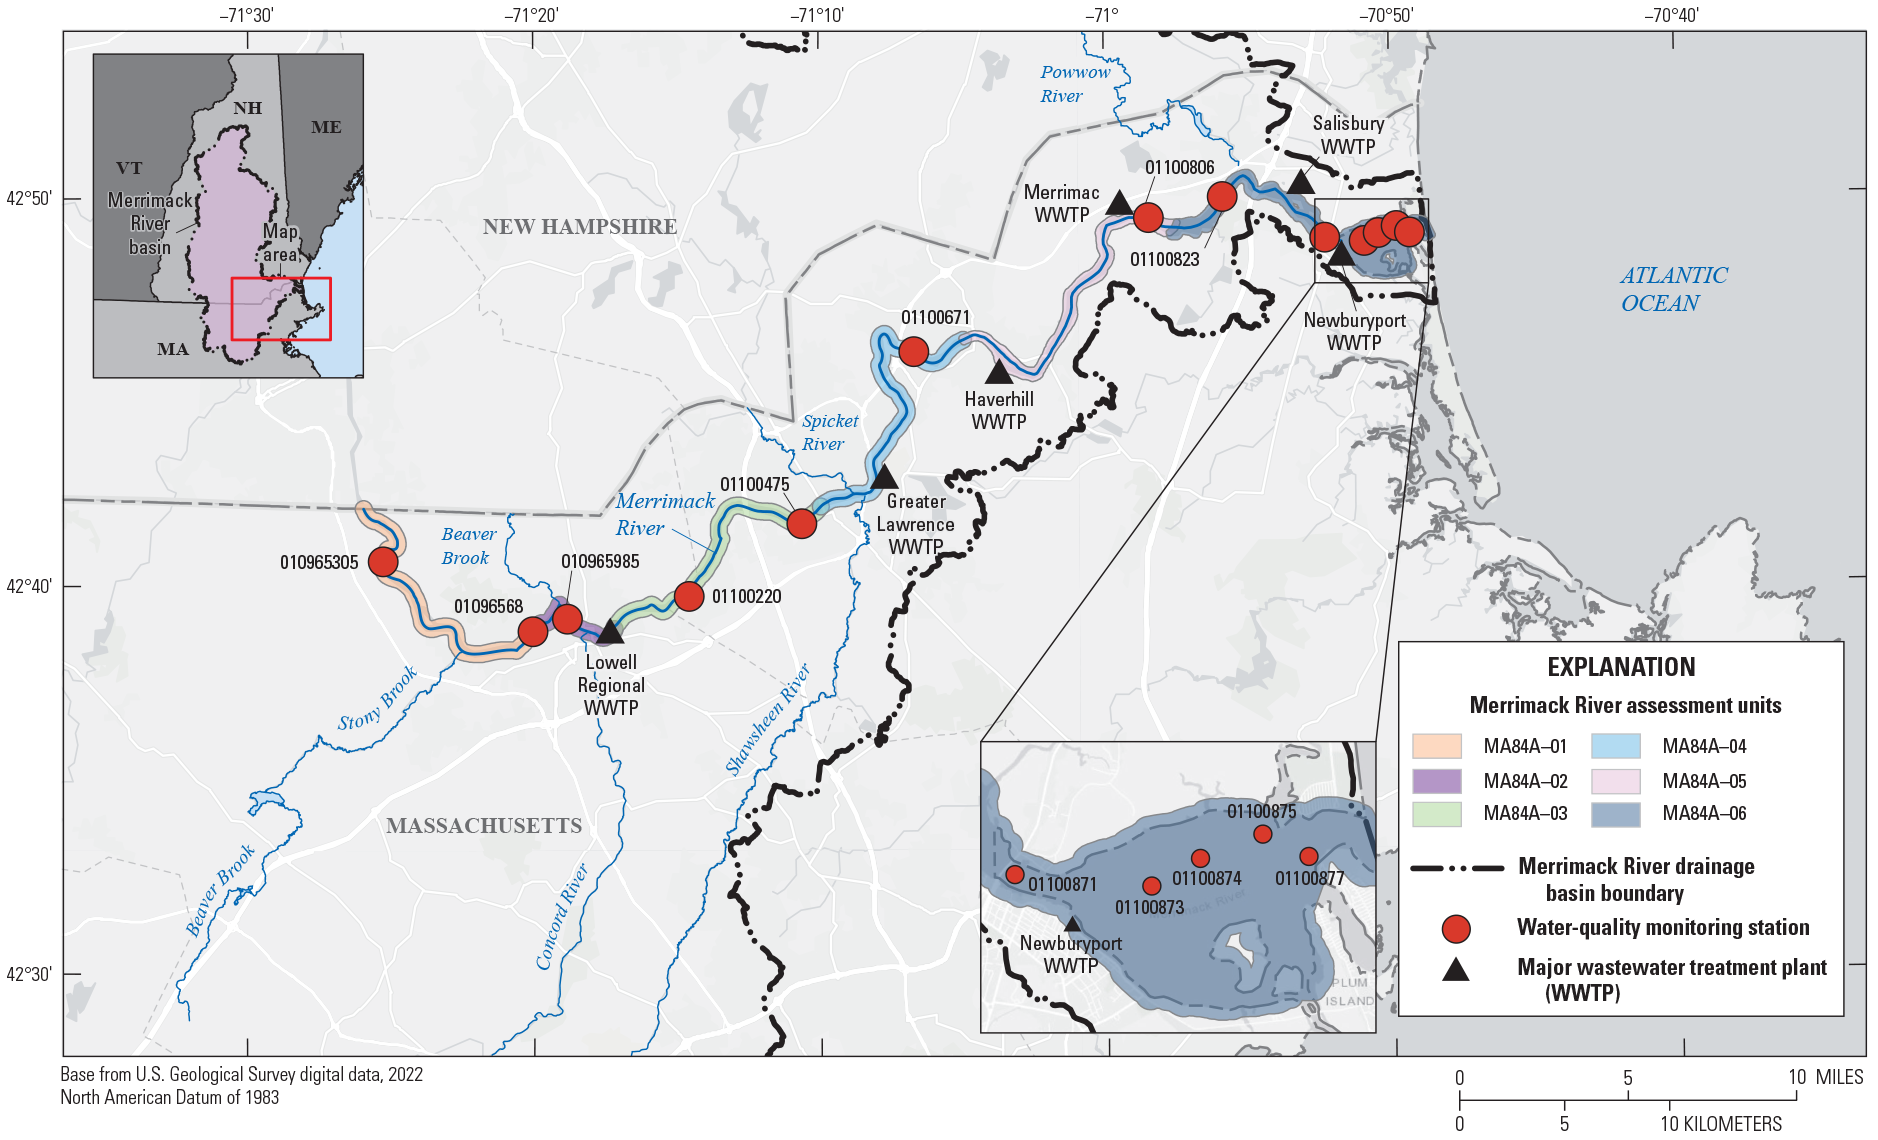
Map of study area of the Merrimack River in Massachusetts showing the section of the Merrimack River in Massachusetts, the Merrimack River assessment units, sampling and data-collection stations, and major wastewater treatment plants in the study area.
The Massachusetts Department of Environmental Protection (MassDEP) designated the freshwater part of the Merrimack River as a class B inland water in the Massachusetts surface water quality standards (MassDEP, 2021). This designation requires that the river meet established water-quality criteria to support multiple uses, including habitat for aquatic life and wildlife, as well as for human recreational use. The lower brackish reach of the river is designated as a class SB coastal and marine water with criteria and uses for coastal and marine systems. Class B (inland) criteria for warm water fisheries include requirements that the concentration of dissolved oxygen not fall below 5.0 milligrams per liter (mg/L), water temperature not rise above 28.3 degrees Celsius (°C), and pH to range between 6.5 and 8.3 standard units. Class SB (coastal and marine) criteria include requirements that the concentration of dissolved oxygen not fall below 5.0 mg/L, water temperature not rise above 29.4 °C, and pH to range between 6.5 and 8.5 standard units (MassDEP, 2021).
In order to accurately assess the water-quality conditions of the Merrimack River to meet Clean Water Act requirements, MassDEP has divided the mainstem of the Merrimack River into multiple hydrologic assessment units (MassDEP, 2022). The assessment unit system classifies reaches of river by changes in water-quality as well as by classifications in the Massachusetts surface water quality standards (MassDEP, 2021). Each individual assessment unit is assumed to be of relatively uniform water-quality, and a new assessment unit is delineated where water-quality is potentially affected (such as by dams, tributary inputs, or wastewater inputs) to help track the sources of changes in water-quality. Dividing the Merrimack River into assessment units better enables water resource managers to identify and address differences in the water-quality within a river reach and tailor monitoring to the specific needs of the reach.
This report presents the results of a cooperative study between MassDEP and the U.S. Geological Survey (USGS) to (1) describe water-quality conditions in the Merrimack River and estuary and compare those conditions to water-quality criteria in the Massachusetts surface water quality standards (MassDEP, 2021), (2) address gaps in information about that water-quality, and (3) support potential future management initiatives in the river and estuary. Discrete water samples and water-quality related data were collected at 13 stations to characterize potential differences in the quality of the water in the Merrimack River and estuary owing to various point and nonpoint contributions within each of the 6 assessment units of interest (table 1). Of the 13 stations at which samples and other data were collected, 9 were along the mainstem of the river, and 4 were open water stations within the estuary (fig. 1). Six WWTPs within the study area discharge directly into the Merrimack River, and three of those six—Lowell Regional WWTP, Greater Lawrence WWTP, and Haverhill WWTP—service large communities and are important factors in the delineations of assessment units MA84A–03, MA84A–04, and MA84A–05.
Table 1.
Hydrologic assessment units and U.S. Geological Survey stations used to evaluate water-quality conditions in the mainstem and tidal reaches of the Merrimack River in Massachusetts from June to September 2020.[The Massachusetts surface water quality standards are from Massachusetts Department of Environmental Protection (MassDEP, 2021)]
Water-Quality Data Collection and Analyses
Collection and Analysis of Discrete Water Samples
Discrete water samples were collected at each of the 13 stations at approximately monthly intervals from June to September 2020, with two samples being collected in June: one at the beginning and one near the end of the month. The samples were analyzed for various forms of nitrogen, phosphorus, particulate carbon, and chlorophyll-a (table 2). One of two analytical methods was used to analyze the samples for their total nitrogen content depending on the field-measured salinity of the sample. When the field-measured salinity was less than 8.0 practical salinity units (PSU), the freshwater version of the total nitrogen laboratory analysis was requested. When the measured salinity was greater than 8.0 PSU, the saltwater version of the total nitrogen lab analysis was requested. The reporting levels for the freshwater and saltwater analysis methods were both 0.10 mg/L. Field parameters related to water-quality, including water temperature, specific conductance, concentration of dissolved oxygen, pH, salinity, and barometric pressure were measured at each station at the time of sample collection using laboratory calibrated sensors. Concentrations of analyzed constituents and the measured field parameters were reviewed, approved, and are included in the USGS National Water Information System (NWIS) database (U.S. Geological Survey, 2022) as well as in Laabs (2022).
Table 2.
Constituents, laboratory reporting levels, and methods used for the analysis to evaluate water-quality conditions in the mainstem and tidal reaches of the Merrimack River in Massachusetts from June to September 2020.[Parameter codes are from the U.S. Geological Survey (USGS) National Water Information System (U.S. Geological Survey, 2022)]
| Constituent | National Water-Quality Laboratory information | ||
|---|---|---|---|
| USGS parameter code | Laboratory reporting level | Method description | |
| Ammonia, filtered, in milligrams per liter | 00608 | 0.01 | Stetson and others (2019) |
| Nitrite, filtered, in milligrams per liter | 00613 | 0.002 | Fishman (1993) |
| Nitrate plus nitrite (filtered) as nitrogen, in milligrams per liter | 00631 | 0.08 | Patton and Kryskalla (2011) |
| Total nitrogen (filtered, fresh water), in milligrams per liter | 62854 | 0.1 | Patton and Kryskalla (2011) |
| Total nitrogen (filtered, saline water), in milligrams per liter | 62854 | 0.1 | Stetson and others (2019) |
| Total particulate nitrogen, in milligrams per liter | 49570 | 0.06 | Zimmerman and others (1997) |
| Orthophosphate, filtered, in milligrams per liter | 00671 | 0.008 | Fishman (1993) |
| Phosphorus, filtered, in milligrams per liter | 00666 | 0.008 | Stetson and others (2019) |
| Phosphorus, unfiltered, in milligrams per liter | 00665 | 0.008 | Stetson and others (2019) |
| Total particulate carbon, in milligrams per liter | 00694 | 0.1 | Zimmerman and others (1997) |
| Chlorophyll-a, phytoplankton, in micrograms per liter | 70953 | 0.1 | Arar and Collins (1997) |
| Pheophytin-a, phytoplankton, in micrograms per liter | 62360 | 0.1 | Arar and Collins (1997) |
Discrete Sample and Vertical Profile Data Collection Methods
Samples were collected as single point samples using either a 2.5-liter (L) Van Dorn sampler or a 2-L plastic bottle. Total depth of the water column at the sampling point was measured at the time of sample collection to determine the collection method. If the total depth was less than 5 ft, a 2-L plastic bottle was used to collect a single point sample at the midpoint between the top and bottom of the water column. If the measured depth exceeded 5 ft, two separate water samples were collected using a Van Dorn sampler. Samples were collected at approximately 1.5 ft from the bottom and 1.5 ft from the top of the water column to help assess possible vertical stratification in the column. All samples were collected and the sample equipment handled according to protocols specified in the USGS National Field Manual for the Collection of Water-Quality Data (Wilde, 2002; U.S. Geological Survey, 2006, 2008, 2020b; Wilde and others, 2014). Samples were shipped to the USGS National Water-Quality Laboratory (NWQL) in Denver, Colorado, for analysis within 1 week of collection (table 2).
At the stations at which the depth of the water column was greater than 5 ft, selected field parameters were measured at several depths from near the top to near the bottom of the water column. These vertical profiles were collected to assess the mixing and potential vertical stratification in water-quality conditions. A multiparameter sensor was lowered through the water column to record the values for water temperature, specific conductance, dissolved oxygen, and pH at various depths. Profiles were not collected when station and weather conditions did not allow for the steady vertical transition of the sensor through the water column.
Continuous Water-Quality Monitoring
Continuous water-quality sensors were deployed on a rotational schedule at 10 of the 13 sampling stations where discrete samples were collected. The stations at which continuous sensors were deployed, the schedule of their deployment, and the water properties recorded, are outlined in table 3 (in back of report). The water-quality sensors recorded water temperature and dissolved oxygen at 15-minute intervals. At a subset of those 10 stations, additional sensors were deployed to record specific conductance, also at 15-minute intervals. Sensors were programmed to log the data internally while deployed. The data on the sensors were downloaded upon each monthly retrieval, and the collected data were uploaded to the NWIS database. The sensors were then redeployed at a different location. Between deployments, the sensors were cleaned and calibrations verified following methods described by Wagner and others (2006).
Two types of sensors were used to collect the continuous water-quality data: a HOBO conductivity unit and a MiniDOT unit. The HOBO conductivity loggers were used to record continuous specific conductance values at an accuracy of ±5 percent of the recorded value. The MiniDOT sensors were used to record continuous water temperature measurements and concentrations of dissolved oxygen; the accuracy of the dissolved oxygen concentration is within ±0.3 mg/L of the recorded value and the accuracy of the water temperature values are within ±0.2 °C of the recorded value. At stations where water depth was greater than 5 ft, sensors were deployed near the top and near the bottom of the water column; where water depth was less than 5 ft, a single sensor was deployed at the midpoint of the water column.
HOBO barometric pressure sensors were deployed at the USGS Merrimack River near Tyngsborough Bridge, Tyngsborough, Mass. (010965305) and Merrimack River at Bridge Marina, Salisbury, Mass. (01100871) monitoring stations through the duration of the project to collect continuous atmospheric pressure data. Stations with continuous water temperature, specific conductance, and dissolved oxygen records were used to calculate an additional continuous time series data for salinity. Stations with continuous water temperature, dissolved oxygen, salinity, and barometric pressure time series records were used to calculate an additional continuous time series record for dissolved oxygen percent saturation. USGS rounding standards are applied to published continuous water-quality data as indicated in U.S. Geological Survey (2020b).
Quality Assurance and Quality Control Data for Discrete Samples and Vertical Profile
Approximately 5 percent of the 159 samples collected for this project were quality-control samples. Quality-control samples consisted of two field blanks: one at the beginning and one at the end of the sampling to quantify any potential contamination from the sampling equipment used. Replicate samples were collected each sample round with a total of six replicate samples collected during the project. Deionized water produced in the laboratory at the USGS New England Water Science Center in Northborough, Mass., was used to prepare the field blanks. The deionized water system is tested annually for the presence and concentration of selected nutrients, major ions, and trace elements to ensure the water is acceptable for use in blank samples. Analyses of the blank samples (table 4) indicated no apparent systematic bias or contamination that would have affected the interpretation of the analyses of the discrete environmental samples. Low levels of particulate carbon and nitrite were detected in one of the two field blanks, and ammonia was detected in both blanks. The resulting blank concentrations were greater than the laboratory detection limit (except for nitrite), but generally equal to or less than the laboratory reporting limit (except for ammonia in the blank from September 29, 2020). The environmental concentrations associated with the blank sample detections had a relative percent difference of greater than or equal to 10 percent of the blank concentrations. As such, the environmental concentrations associated with those field blanks were approved. This quality assurance information indicates that the detections of nitrite and ammonia in environmental samples at concentrations near the reporting level for those analytes may be less accurate than detections of higher concentrations (table 5, in back of report). The associated blank and replicate quality control data can be reviewed in Laabs (2022).
Table 4.
Concentrations of constituents reported in field blank quality control samples used to evaluate water-quality conditions in the mainstem and tidal reaches of the Merrimack River in Massachusetts from June to September 2020.[mg/L, milligram per liter]
The salinity in the 6 field replicates adequately bracketed the wide range in salinity that was recorded at the 13 discrete monitoring stations. In general, the ranges in concentrations of most of the analytes were accurately replicated, with relative percent difference values between concentrations in the environmental samples and the replicates of less than 10 percent. However, for three individual analytes—total particulate carbon, total particulate nitrogen, and pheophytin-a—the relative percent difference values were near 20 percent. For the data quality objectives of this study, a relative percent difference of 20 percent for these constituents was deemed acceptable to assume replication accuracy. Due to inherent variability in sampling and processing procedures for particulate samples, total particulate carbon and total particulate nitrogen can be difficult to accurately replicate (Medalie and Bexfield, 2020). The same difficulty in replication as with the particulate samples was assumed with the pheophytin-a sample. The corresponding environmental sample data were deemed valid, and no actions were taken to qualify them.
Owing to a filter supply issue, a subset of the samples collected in July were processed through a 0.65-micrometer (µm) filter in the field instead of the standard 0.45-µm filter recommended in USGS guidelines (Wilde, 2002). The analyses for these samples were compared with those for other sampling events to ensure comparability between the analytical results for samples processed through the different filter sizes. It was determined that the use of two filter sizes produced similar analytical results for nutrients in the samples, and the data were deemed valid. A result-level comment describing the use of the 0.65-µm filter was added to these samples in the NWIS database (U.S. Geological Survey, 2022).
The instruments (water-quality monitors and sensors) used to collect discrete sample and vertical profile data were calibrated following protocols and techniques outlined in chapter A6 of the National Field Manual (U.S. Geological Survey, 2008). Instruments were checked for calibration accuracy each morning and calibrated against known standards if needed before use in the field. Standards were selected to bracket expected field values in order to verify the accuracy and range of the instruments.
Barometric pressure data were recorded in the field at the time of sampling. Barometric pressure readings from sensors used in the field were compared with barometric pressure readings at local airports to determine accuracy, with the requirements that the sensors read within 5 millimeters of mercury of readings at the airport. During this check, it was found after conclusion of the project that one field barometric pressure sensor was reading erroneously; associated field data collected with that sensor were deemed invalid and are not publicly available in the database.
Quality Assurance and Quality Control Procedures for Continuous Sensor Data
The MiniDOT and HOBO sensors used cannot be calibrated locally. Instead, they are calibrated in the factory and certified for accuracy and precision to a specified range of conditions. Before deployment in the field, the performance of the MiniDOT and HOBO sensors were verified by comparing sensor readings to certified calibration standards or equipment in the USGS laboratory. The HOBO and MiniDOT sensors calibrations were also checked to track and verify instrument performance between each deployment at a field station.
In addition to these standard laboratory and field calibration checks, the 15 MiniDOT sensors used during the project were checked in a zero dissolved oxygen solution to verify the accuracy of near-zero readings. The procedures used to perform the zero dissolved oxygen checks followed those specified in chapter A6.2 of the National Field Manual (U.S. Geological Survey, 2020a). The sensor readings ranged from 0.03 mg/L to 0.135 mg/L, with a median value of 0.045 mg/L in a zero dissolved oxygen solution.
To evaluate the performance of the thermistors on the field sondes, MiniDOT, and HOBO sensors, a five-point calibration check was performed in the USGS laboratory at the beginning of the project and again at the conclusion. The water temperature sensors were compared with a National Institute of Standards and Technology (NIST) calibrated thermometer to evaluate the accuracy of the measurements. The deployed sensors were also compared in the field against secondary USGS laboratory calibrated sensors that had been checked against a NIST thermometer. Water temperature sensors were found to be accurate within 0.2 °C of the calibrated NIST thermometer, and no sensor drift was apparent at the conclusion of the study.
To determine the degree of fouling of the water-quality sensors that may have occurred during deployment, at the end of each deployment they were compared with a laboratory calibrated sensor. Continuous monitoring in coastal environments can be challenging because of rapid biofouling from microscopic and macroscopic organisms, corrosion of electronic components from salt and high humidity, and wide ranges in values of field parameters associated with changing weather and tidal conditions. However, because of rapidly changing physical conditions at some monitoring stations, particularly the brackish water monitoring stations within assessment unit MA84A–06 (fig. 1), it was difficult to obtain accurate in-place comparison readings. At such stations, the standard protocol for the operation and maintenance of continuous water-quality sensors was modified as suggested by Wagner and others (2006). In lieu of in-place comparisons, the readings of the deployed sensors were compared before and after cleaning with those of a laboratory sensor while both were placed in a bucket of water (dipped from the monitoring station). The still water in a bucket provides a more stable environment for the sensors and ensures a more accurate check of the degree of fouling of the deployed sensor.
After each deployment, fouling corrections were calculated using the readings taken from before and after the deployed sensors were cleaned. Similarly, calibration corrections were calculated based on how the sensors performed during each of the field calibration checks. When necessary, the calculated fouling and calibration corrections were then applied to the data collected by the deployed sensor to correct for any fouling or drift. Data for which the correction exceeded the maximum allowable limit specified in Wagner and others (2006) were considered erroneous and are not publicly available in the NWIS database (U.S. Geological Survey, 2022).
Analyses of data for water temperature and dissolved oxygen recorded by the MiniDOT sensor deployed during June 2020 at the near-bottom location at the Merrimack River at Lowell Motorboat Club, Lowell, Mass. (01096568) monitoring station indicated that the sensor was excessively fouled for several days during its period of deployment, and that the calculated correction to the data for some days exceeded the maximum allowable limit. The erroneous data are not publicly available, and water temperature and dissolved oxygen data for this station are available only for June 2–17, 2020.
To determine the degree of potential calibration drift during deployment, the deployed sonde was compared to a laboratory calibrated field meter (Wagner and others, 2006). The field calibration checks performed indicated that the readings of the MiniDOT sensors met USGS criteria and factory recalibration was unnecessary. Field calibration checks of the HOBO sensors, however, indicated significant error (as much as 36 percent) in readings of values of specific conductance greater than 25,000 microsiemens per centimeter at 25 degrees Celsius (μS/cm). At the conclusion of the study, when a thorough calibration check of the HOBO conductivity sensors was performed in the USGS office laboratory, the sensor readings were found to be substantially in error at values greater than 25,000 μS/cm, as much as 20 to 30 percent from the 50,000-μS/cm laboratory standard used. In response to the inaccuracy observed in the postdeployment calibration checks of the HOBO conductivity sensors in certified conductivity standards, continuous data recorded that were greater than 25,000 µS/cm did not meet USGS and project data quality objectives and are not publicly available.
At three of the brackish water stations (Merrimack River estuary near Buoy 15, Newburyport, Mass. [01100873], Bridge Marina [01100871], and Merrimack River at Goodwin Creek, Amesbury, Mass. [01100823] monitoring stations), a large number of specific conductance values exceeded the 25,000-μS/cm threshold. Absence of the use of those data significantly biased the remaining data, and as a consequence, the continuous specific conductance data for the three stations were not published (table 3). The associated salinity and dissolved oxygen saturation data that were calculated on the basis of the specific conductance values for the three stations were subsequently deemed to be erroneous and are not publicly available in the dataset.
Findings From Analysis of Water-Quality Data
The freshwater reach of the Merrimack River is designated by the Massachusetts Department of Environmental Protection as a class B water, and the lower brackish reach as a class SB water in the Massachusetts surface water quality standards (MassDEP, 2021). Many types of water-quality information were collected in each of the six assessment units during this study to help determine if the water in those reaches is meeting established water-quality criteria in the Massachusetts surface water quality standards (MassDEP, 2021).
Discharge and gage height data from the Merrimack River at Lowell, Mass. (01100000) and Merrimack River at Lawrence, Mass. (01100500) monitoring stations were used to assess flow conditions on the river during the collection of samples. Discharge was not a determining factor when scheduling the sample collection. In general, samples were collected under base flow or lower conditions. During summer 2020, Massachusetts was experiencing a severe flash drought, with warmer than average daily temperatures and lower than average streamflows (Lombard and others, 2020). This drought created a situation in which there were few storms large enough to cause the combined sewer overflows to discharge to the Merrimack River during the period of the study, making it difficult to assess whether combined sewer overflows are a major contributing factor to overall water-quality in the Merrimack River.
Discrete Sample and Vertical Profile Data
Discrete water data collected during the study are summarized in tables 5 through 9 (in back of report) and USGS rounding standards are applied to all discrete field parameters and continuously recorded data as indicated in U.S. Geological Survey (2020b). Concentrations of total nitrogen, ammonia, nitrate, and nitrite were generally consistent throughout the sampling period, with only nitrite showing a slight increase in concentration from June to September. The highest concentrations of nitrogen and phosphorus were found at the stations downstream from wastewater treatment plants in Lowell, Lawrence, and Haverhill (fig. 1). Concentrations of total nitrogen ranged from 0.07 mg/L at the Merrimack River estuary near Plum Island, Newburyport, Mass. (01100877) monitoring station to 2.79 mg/L at the Merrimack River downstream Stanley Island, Haverhill, Mass. (01100671) monitoring station (table 5, in back of report). Concentration of ammonia ranged from less than (<) 0.01 mg/L at multiple stations to 0.61 mg/L (estimated value) in a top sample at the Tyngsborough Bridge (010965305) monitoring station. Concentrations of nitrate plus nitrite ranged from <0.04 mg/L at multiple stations to 2.14 mg/L in a top sample at the Merrimack River near power lines, Merrimac, Mass. (01100806) monitoring station. Concentrations of nitrite ranged from <0.001 mg/L at multiple stations to 0.130 mg/L at the Stanley Island (01100671) monitoring station.
Concentrations of unfiltered phosphorus ranged from 0.013 mg/L at multiple stations to 0.136 mg/L in a bottom sample at the Tyngsborough Bridge (010965305) monitoring station (table 6, in back of report). Concentrations of filtered phosphorus ranged from 0.004 mg/L (estimated value) at multiple stations to 0.096 mg/L in a bottom sample at the Tyngsborough Bridge (010965305) monitoring station. Concentrations of orthophosphate ranged from <0.004 mg/L at multiple stations to 0.088 mg/L in a bottom sample at the Tyngsborough Bridge (010965305) monitoring station. Concentrations of total particulate carbon ranged from 0.19 mg/L in a bottom sample at the Bridge Marina (01100871) monitoring station to 2.98 mg/L in a top sample at the Merrimack River near power lines, Methuen, Mass. (01100220) monitoring station.
Concentrations of chlorophyll-a and pheophytin-a varied during the study period, with both detected at higher concentrations in samples collected in July and September than in the June and August samples. Concentrations of chlorophyll-a and pheophytin-a were generally higher in samples collected at riverine stations than in samples from estuarine stations (table 7, in back of report). Concentrations of chlorophyll-a ranged from 1.30 micrograms per liter (µg/L) at two stations to 37.4 µg/L in a top sample at the Tyngsborough Bridge (010965305) monitoring station. Concentrations of pheophytin-a ranged from <0.10 µg/L at two stations to 42.0 µg/L in a top sample at the Goodwin Creek (01100823) monitoring station.
The minimum criterion for concentration of dissolved oxygen of 5.0 mg/L in class B waters (MassDEP, 2021) was exceeded at three stations while collecting discrete water-quality data: the Tyngsborough Bridge (010965305), the Lowell Motorboat Club (01096568), and the Methuen (01100220) monitoring stations. None of the discrete samples collected in the stations classified as class SB waters exceeded the minimum dissolved oxygen criterion.
The maximum criterion for pH in class B waters of 8.3 standard units (MassDEP, 2021) was exceeded at three stations: the Tyngsborough Bridge (010965305), the Lowell Motorboat Club (01096568), and the Merrimack River near Aiken Street Bridge (010965985) monitoring stations. None of the stations classified as class SB waters exceeded the maximum pH criterion of 8.5 standard units, and the minimum criterion of 6.5 was not exceeded at any of the stations in class B and class SB waters.
The maximum criterion for water temperature in class B waters of 28.3 °C (MassDEP, 2021) was found to be exceeded at one station: the Stanley Island (01100671) monitoring station. None of the stations classified as class SB waters had samples that exceeded the maximum water temperature criterion of 29.4 °C.
The data collected in the vertical profiles indicated that most stations were well mixed, with minimum stratification. At the stations where mixing was indicated, the values for the properties measured in the profiles showed little variation through the water column. Water temperature showed variations of 2 °C or less, concentrations of dissolved oxygen varied by 0.5 mg/L or less, pH varied by 0.5 standard unit or less, and specific conductance values varied by 10 percent or less. Two stations had collected profile data that indicated there was poor mixing: the Tyngsborough Bridge (010965305) and Lowell Motorboat Club (01096568) monitoring stations. The samples collected at the Tyngsborough Bridge monitoring station, in particular, showed notable differences in water temperature measurements and concentrations of dissolved oxygen with depth. Data from vertical profiles are published in Laabs (2022).
Concentrations of dissolved oxygen at the Goodwin Creek (01100823) monitoring station were representative of those found at most sampling stations, consistent through the water column at levels greater than 5.0 mg/L (fig. 2). In comparison, concentrations of dissolved oxygen decreased with depth in profiles measured in June and September at Tyngsborough Bridge (010965305) monitoring station (fig. 3) and the Lowell Motorboat Club (01096568) monitoring station (fig. 4), both in assessment unit MA84A–01 (fig. 1). The vertical profiles measured in June that documented concentrations of dissolved oxygen at levels below the class B criterion of 5.0 mg/L (figs. 3 and 4) corroborate the field data collected in concert with the discrete samples and with the continuously recorded data for these stations.
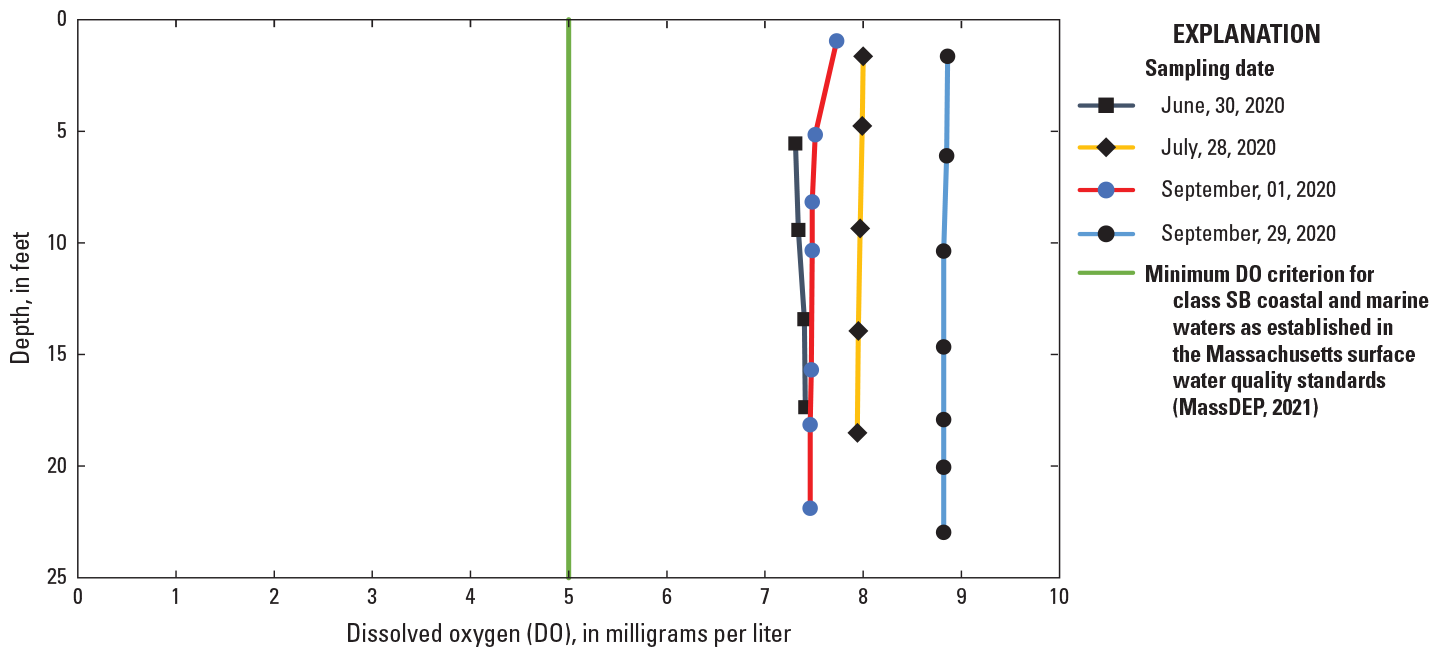
Concentrations of dissolved oxygen measured in vertical profiles at the Merrimack River at Goodwin Creek, Amesbury, Mass. (station number 01100823) monitoring station, June to September 2020.
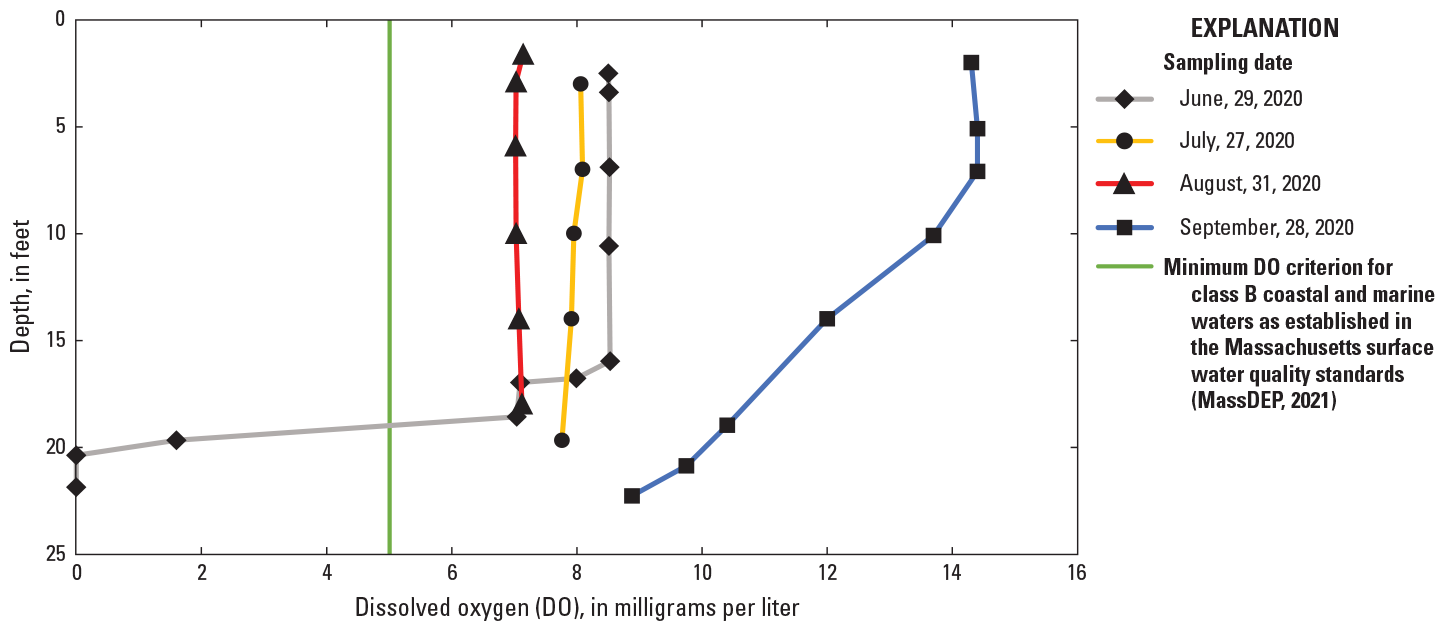
Concentrations of dissolved oxygen measured in vertical profiles at the Merrimack River near Tyngsborough Bridge, Tyngsborough, Mass. (station number 010965305) monitoring station, June to September 2020.
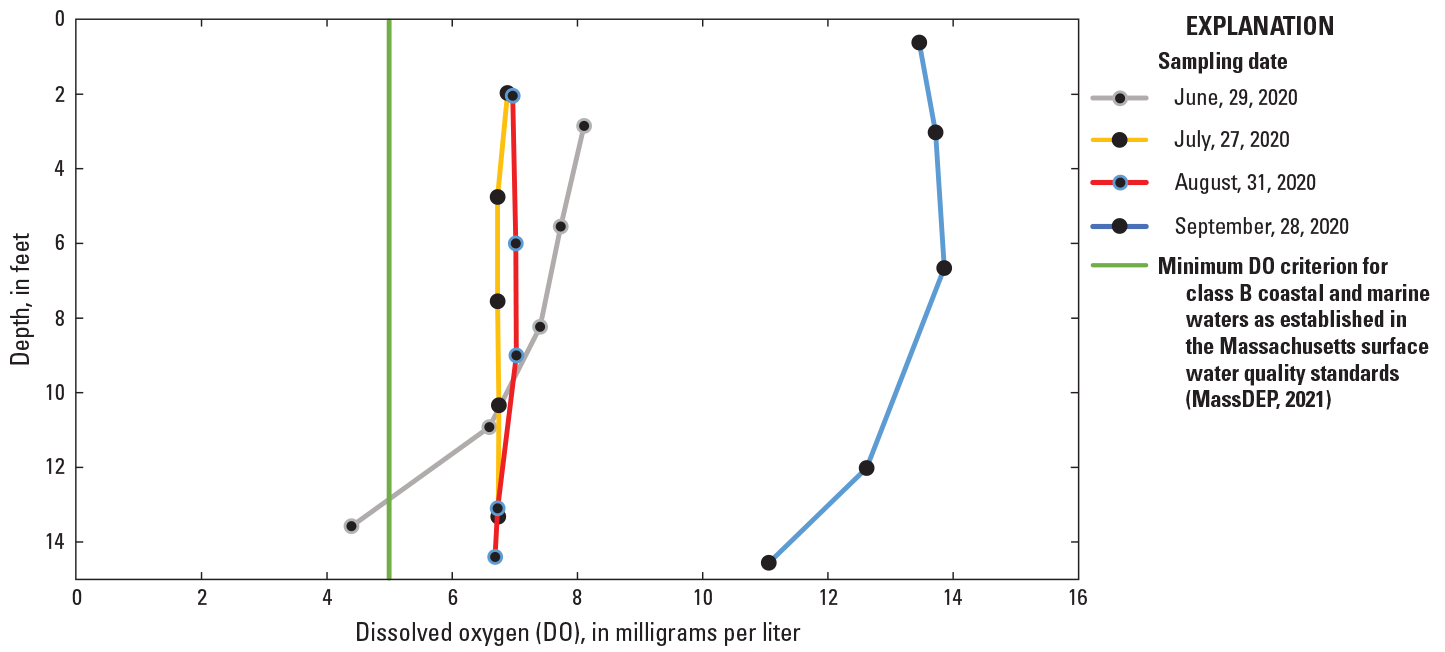
Concentrations of dissolved oxygen measured in vertical profiles at the Merrimack River at Lowell Motorboat Club, Lowell, Mass. (station number 01096568) monitoring station, June to September 2020.
Continuous Water-Quality Data
Data recorded by the top and bottom continuous sensors generally indicated vertical stratification of water temperature and dissolved oxygen at some stations. Vertical stratification of water temperature and dissolved oxygen was observed primarily at the upstream stations in assessment units MA84A–01 and MA84A–02, particularly at the Tyngsborough Bridge (010965305) and Lowell Motorboat Club (01096568) monitoring stations. Data from the top and bottom sensors deployed at stations in assessment units MA84A–03 through MA84A–06 indicated that the river was relatively well mixed vertically with no apparent differences between the top and bottom sensors (fig. 1.).
Concentrations of dissolved oxygen varied among and within the stations continuously monitored during this study (table 9, in back of report). At 6 of the 10 monitored stations, the recorded concentration of dissolved oxygen never fell below the 5.0 mg/L criterion. At the Merrimac (01100806) monitoring station, however, concentrations of dissolved oxygen were near the criterion for many days, with recorded readings as low as 5.1 mg/L. At 4 of the 10 stations, recorded concentration of dissolved oxygen fell below the 5.0 mg/L criterion: Tyngsborough Bridge (010965305), Lowell Motorboat Club (01096568), Methuen (01100220), and Stanley Island (01100671). All four of these stations are in class B waters. The lowest concentrations of dissolved oxygen in the study were observed at the Tyngsborough Bridge station, with a concentration of dissolved oxygen of 0.0 mg/L recorded by the bottom sensor for a 5-day period during June 2020. This recorded absence of dissolved oxygen in the water at the bottom of the water column was confirmed by a vertical profile measured in June (fig. 4).
Water temperature at five of the six monitoring locations in class B waters had recorded values that exceeded the maximum temperature criterion of 28.3 °C. None of the four continuously monitored stations in class SB waters exceeded the maximum temperature criterion of 29.4 °C, though several stations in class SB waters had a maximum recorded water temperature of 29.4 °C.
These findings indicated that some reaches of the Merrimack River were at times not meeting the permissible lower limit for dissolved oxygen and upper limit for temperature in class B waters. The rotation deployment of the continuous sensors provided high-frequency information at several different monitoring stations along the Merrimack River that provided useful information on water-quality conditions throughout the study area. The relatively short deployments, however, were insufficient to describe the duration and frequency of these exceedances. More continuous data collection is needed to identify the frequency and duration of these exceedances.
Table 3.
Water-quality sensors deployed on the Merrimack River and estuary in Massachusetts between June and September 2020.[Top and bottom in the sensor depth in water column table indicate location of sensor. WT, water temperature; DO, dissolved oxygen; %DO saturation, percent dissolved oxygen saturation; SC, specific conductance; —, no data]
Table 5.
Summary of measurements of field-collected water-quality properties for nitrogen compounds analyzed at monitoring stations on the Merrimack River in Massachusetts from June to September 2020.[mg/L, milligram per liter; min, minimum; max, maximum; e, estimated data; <, less than]
Table 6.
Summary of measurements of field-collected water-quality properties for phosphorus compounds and total particulate carbon analyzed at monitoring stations on the Merrimack River in Massachusetts from June to September 2020.[mg/L, milligram per liter; e, estimated data; <, less than]
Table 7.
Summary of measurements of field-collected water-quality properties for pheophytin-a and chlorophyll-a at monitoring stations on the Merrimack River in Massachusetts from June to September 2020.[µg/L, microgram per liter; min, minimum; max, maximum]
Table 8.
Summary of measurements of field-collected water-quality properties at monitoring stations on the Merrimack River in Massachusetts from June to September 2020.[°C, degree Celsius; µS/cm, microsiemens per centimeter at 25 degrees Celsius; mg/L, milligram per liter; PSU, practical salinity unit]
Table 9.
Summary of measurements of field-collected continuous water-quality properties at monitoring stations on the Merrimack River in Massachusetts from June to September 2020.[°C, degree Celsius; mg/L, milligram per liter; µS/cm, microsiemens per centimeter at 25 degrees Celsius; PSU, practical salinity unit; —, no data]
References Cited
Arar, E.J., and Collins, G.B., 1997, Method 445.0 in vitro determination of chlorophyll a and pheophytin a in marine and freshwater algae by fluorescence (revision 1.2): U.S. Environmental Protection Agency, 22 p., accessed June 21, 2022, at https://cfpub.epa.gov/si/si_public_record_report.cfm?Lab=NERL&dirEntryId=309417.
Fishman, M.J., ed., 1993, Methods of analysis by the U.S. Geological Survey National Water Quality Laboratory—Determination of inorganic and organic constituents in water and fluvial sediments: U.S. Geological Survey Open-File Report 93–125, 217 p., accessed July 27, 2022, at https://doi.org/10.3133/ofr93125.
Laabs, K.L., 2022, Water quality data for discrete samples and continuous monitoring on the Merrimack River, Massachusetts, June to September 2020: U.S. Geological Survey data release, https://doi.org/10.5066/P9H19THP.
Lombard, P.J., Barclay, J.R., and McCarthy, D.E., 2020, 2020 drought in New England (ver. 1.1, February 2021): U.S. Geological Survey Open-File Report 2020–1148, 12 p. accessed May 17, 2021, at https://doi.org/10.3133/ofr20201148.
Massachusetts Department of Environmental Protection [MassDEP], 2021, Massachusetts surface water quality standards: Massachusetts Department of Environmental Protection 314 CMR 4.00, 117 p., accessed September 26, 2022, at https://www.mass.gov/doc/314-cmr-400/download.
Massachusetts Department of Environmental Protection [MassDEP], 2022, Massachusetts consolidated assessment and listing methodology guidance manual for the 2022 reporting cycle: Massachusetts Department of Environmental Protection CN 564.0, 166 p., accessed June 6, 2023, at https://www.mss.gov/doc/2022-consolidated-assessment-and-listing-methodology-guidance/download.
Medalie, L., and Bexfield, L.M., 2020, Quality of data from the U.S. Geological Survey National Water Quality Network for water years 2013–17: U.S. Geological Survey Scientific Investigations Report 2020–5116, 21 p., accessed April 8, 2022, at https://doi.org/10.3133/sir20205116.
Merrimack River Watershed Council, 2020, Water quality monitoring program—2020 year-end report: Merrimack River Watershed Council, 35 p., accessed May 17, 2021, at https://merrimack.org/wp-content/uploads/2021/03/MRWC-2020-Water quality-Monitoring-Report.pdf.
Patton, C.J., and Kryskalla, J.R., 2011, Colorimetric determination of nitrate plus nitrite in water by enzymatic reduction, automated discrete analyzer methods: U.S. Geological Survey Techniques and Methods, book 5, chap. B8, 34 p., accessed January 19, 2022, at https://doi.org/10.3133/tm5B8.
Stetson, S.J., Patton, C.J., Guaglione, N., and Chestnut, Z., 2019, Measurement of nutrients in saline and hypersaline waters by discrete analyzer colorimetry without matrix matched calibration standards: Talanta, v. 203, p. 297–304, accessed May 17, 2021, at https://doi.org/10.1016/j.talanta.2019.05.066.
U.S. Environmental Protection Agency, 2018, Merrimack River watershed story map series: U.S. Environmental Protection Agency web page, accessed February 23, 2021, at https://epa.maps.arcgis.com/apps/MapSeries/index.html?appid=922e1c016c6e42b199f902d1cfb84bbd#.
U.S. Geological Survey, 2006, Collection of water samples (ver. 2.0, September 2006), chap. A4 of Wilde, F.D., ed., National field manual for the collection of water quality data: U.S. Geological Survey Techniques of Water-Resources Investigations, book 9, chap. A4, 166 p., accessed May 17, 2021, at https://doi.org/10.3133/twri09A4.
U.S. Geological Survey, 2008, Field measurements, chap. A6 of Wilde, F.D., ed., National field manual for the collection of water quality data: U.S. Geological Survey Techniques of Water-Resources Investigations, book 9, chap A6, 9 p., accessed November 29, 2021, at https://doi.org/10.3133/twri09A6.
U.S. Geological Survey, 2020a, Dissolved oxygen, chap. A6.2 of Wilde, F.D., ed., National field manual for the collection of water quality data: U.S. Geological Survey Techniques and Methods, book 9, chap. A6.2, 33 p., accessed April 29, 2021, at https://doi.org/10.3133/tm9A6.2. [Supersedes USGS Techniques of Water-Resources Investigations, book 9, chap. A6.2, version 3.0.]
U.S. Geological Survey, 2020b, Suggestions to authors of the U.S. Geological Survey (8th ed.): U.S. Geological Survey, 279 p., accessed April 29, 2021, at https://internal.usgs.gov/publishing/sta/.
U.S. Geological Survey, 2022, USGS water data for the nation: U.S. Geological Survey National Water Information System database, accessed April 29, 2021, at https://doi.org/10.5066/F7P55KJN.
Wagner, R.J., Boulger, R.W., Jr., Oblinger, C.J., and Smith, B.A., 2006, Guidelines and standard procedures for continuous water quality monitors—Station operation, record computation, and data reporting: U.S. Geological Survey Techniques and Methods, book 1, chap. D3, 51 p., accessed May 17, 2021, at https://doi.org/10.3133/tm1D3.
Wilde, F.D., ed., 2002, Processing of water samples, chap. A5 of Wilde, F.D., ed., National field manual for the collection of water quality data: U.S. Geological Survey Techniques of Water-Resources Investigations, book 9, chap. A5, 166 p., accessed May 17, 2021, at https://doi.org/10.3133/twri09A5.
Wilde, F.D., Sandstrom, M.W., and Skrobialowski, S.C., 2014, Selection of equipment for water sampling, chap. A2 of Wilde, F.D., ed., National field manual for the collection of water quality data: U.S. Geological Survey Techniques of Water Resources Investigations, book 9, chap. A2, 78 p., accessed May 17, 2021, at https://doi.org/10.3133/twri09A2.
Zimmerman, C.F., Keefe, C.W., and Bashe, A.N.D.J., 1997, Method 440.0 determination of carbon and nitrogen in sediments and particulates of estuarine/coastal waters using elemental analysis: U.S. Environmental Protection Agency EPA/600/R–15/009, 10 p., accessed May 17, 2021, at https://cfpub.epa.gov/si/si_public_record_Report.cfm?Lab=NERL&dirEntryId=309418.
Supplemental Information
Specific conductance is given in microsiemens per centimeter at 25 degrees Celsius (µS/cm at 25 °C).
Concentrations of chemical constituents in water are given in either milligrams per liter (mg/L) or micrograms per liter (µg/L).
For more information, contact
Director, New England Water Science Center
U.S. Geological Survey
10 Bearfoot Road
Northborough, MA 01532
dc_nweng@usgs.gov
or visit our website at
https://www.usgs.gov/centers/new-england-water
Publishing support provided by the Pembroke and Reston Publishing Service Centers
Disclaimers
Any use of trade, firm, or product names is for descriptive purposes only and does not imply endorsement by the U.S. Government.
Although this information product, for the most part, is in the public domain, it also may contain copyrighted materials as noted in the text. Permission to reproduce copyrighted items must be secured from the copyright owner.
Suggested Citation
Laabs, K., Beaudoin, C., Sorenson, J., and Bissell, A., 2023, Evaluating water-quality conditions in the mainstem and tidal reaches of the Merrimack River in Massachusetts, June to September 2020: U.S. Geological Survey Data Report 1166, 19 p., https://doi.org/10.3133/dr1166
ISSN: 2771-9448 (online)
Study Area
| Publication type | Report |
|---|---|
| Publication Subtype | USGS Numbered Series |
| Title | Evaluating water-quality conditions in the mainstem and tidal reaches of the Merrimack River in Massachusetts, June to September 2020 |
| Series title | Data Report |
| Series number | 1166 |
| DOI | 10.3133/dr1166 |
| Publication Date | December 20, 2023 |
| Year Published | 2023 |
| Language | English |
| Publisher | U.S. Geological Survey |
| Publisher location | Reston, VA |
| Contributing office(s) | New England Water Science Center |
| Description | Report: vi, 19 p.; Data Release |
| Country | United States |
| State | Massachusetts |
| Other Geospatial | Merrimack River |
| Online Only (Y/N) | Y |
| Additional Online Files (Y/N) | N |