

Distribution of Large Boulders on the Deposit of the West Salt Creek Rock Avalanche, Western Colorado
Links
- Document: Report (33.3 MB pdf) , HTML , XML
- Data Release: USGS data release - Distribution of large boulders on the deposit of the West Salt Creek rock avalanche, western Colorado
- NGMDB Index Page: National Geologic Map Database Index Page (html)
- Download citation as: RIS | Dublin Core
Abstract
On May 25, 2014, a 54.5-million cubic meter rock avalanche in the West Salt Creek valley, Mesa County, Colorado, traveled 4.6 kilometers, leaving a deposit that covers about 2.2 square kilometers. To check the particle-size distribution of the deposit for information about the high mobility of the avalanche, we estimated boulder distribution density for the entire deposit by counting 1-meter (m) or larger diameter boulders of sedimentary rock derived from the Green River Formation that are visible in high-resolution imagery collected from the area in July 2014. Basalt boulders were excluded from the count because field observations indicated that they generally stayed intact as the avalanche moved downslope, whereas sedimentary boulders showed evidence of fragmentation during downslope movement. Variable clarity, contrast, and resolution of the imagery precluded mapping smaller boulders. Experimentation with 5-, 10-, and 20-m resolution grids indicated that a 20-m resolution grid showed the spatial pattern of boulder density across the deposit at a scale that allowed statistically meaningful variations to be determined. In addition to counting the boulders in each 20×20-m grid cell, six categories of successively increasing boulder distribution density were created to help visualize variations in the distribution of 1 meter or larger boulders across the avalanche deposit. Analysis indicates that boulder distribution density gradually decreases with increasing distance from the avalanche source.
Introduction
On May 25, 2014, the West Salt Creek valley, located east of Mesa, Colorado (fig. 1), experienced a 54.5-million cubic meter rock avalanche (Coe and others, 2016a). The avalanche traveled 4.6 kilometers, leaving a deposit that covers about 2.2 square kilometers (fig. 2). Following the original mapping and mechanical analysis of the West Salt Creek rock avalanche (Coe and others, 2016a), we studied this area using high-resolution images to determine the distribution of boulders that were 1 meter (m) or larger in diameter on the surface of the avalanche deposit. Based on studies of rock avalanches elsewhere, others have hypothesized that rock fragmentation may contribute to avalanche mobility (Davies and McSaveney, 2009). Although field observations seemed to indicate that deposits at the toe of the avalanche might be finer grained, with fewer boulder-sized (greater than [>] 264 millimeters [mm]) and cobble-sized (64–264 mm) clasts than elsewhere in the avalanche, the large range of particle sizes makes conventional methods for evaluating size distribution impractical. Thus, we mapped the spatial pattern of boulder distribution density using high-resolution imagery to assess the abundance of the largest particles throughout the deposit.

Satellite image showing the location of West Salt Creek valley area, Colorado, with the rock avalanche area outlined by a white polygon.
Methods
Following the May 25 avalanche, high-resolution (about 0.1 m) unoccupied aircraft system (UAS) imagery was collected from the area in July of 2014 (Coe and others, 2016b). The imagery taken for the West Salt Creek rock avalanche deposit consisted of three parts that were merged into one image (fig. 3). The three separate images can be distinguished in figure 3 by the different tones in the mosaic image. The lower third of the avalanche imagery in figure 3 covers 557,000 square meters (m2), the middle third covers an area of 1,021,000 m2, and the upper third covers 757,000 m2.
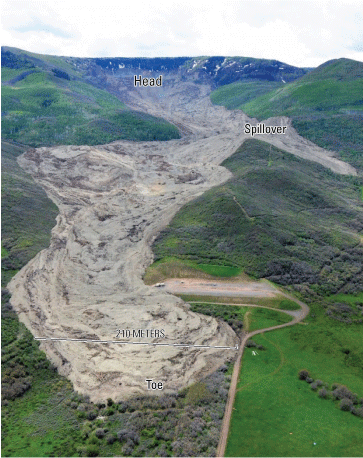
Photograph of the West Salt Creek rock avalanche deposit taken on May 30, 2014; view to the south. Labels indicate the head (top), toe (terminus), and a spillover lobe where part of the avalanche ran over the crest of a high ridge. The avalanche deposit is about 210 meters wide along the line marked in the photograph. Photograph by Jeff Coe.
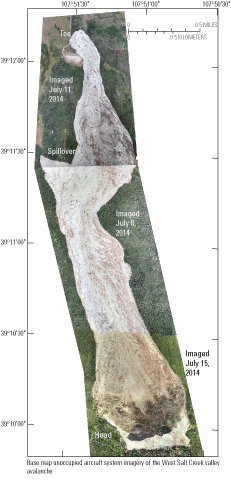
Merged image created from three unoccupied aircraft system (UAS) images of the West Salt Creek valley avalanche deposit. The three separate images can be distinguished by the different tones in the mosaic image and are labeled with the date each was acquired. A distinct contrast in color of the avalanche deposit occurs at the boundary between adjacent images. The lower third of the combined avalanche imagery (acquired 12 p.m. MDT July 11, 2014) covers 557,000 square meters (m2), the middle third (acquired 12 p.m. MDT July 8, 2014) covers an area of 1,021,000 m2, and the upper third (acquired 12 p.m. MDT July 15, 2014) covers 757,000 m2. Labels indicate the head (top), toe (terminus), and a spillover lobe where part of the avalanche ran over the crest of a high ridge.
To begin our analysis of boulder distribution density, the UAS imagery was imported into ArcMap (Esri). We examined the imagery in different parts of the deposit, considered the variable quality (contrast, resolution, and clarity) of the images, and determined that 1 meter was a reasonable lower limit for identifying boulders on the surface of the deposit. Next, a fishnet (square mesh) was created using the Create Fishnet tool in ArcMap. Originally, we tried to use 5×5-m or 10×10-m cells; however, after creating these fishnets, we determined that these sizes were too small to provide meaningful data. The smaller cell sizes did not show enough variation in the boulder distribution density in an area to provide a useful representation of the difference in distribution density across the entire avalanche area. Additionally, the smaller cell sizes would have taken an extensive amount of time to input and analyze data. To balance the resolution of the boulder distribution density map against the required time and effort to produce it and the need for a statistically meaningful sample size, 20×20-m cells were created for the entire UAS imagery area of the avalanche. Then, cells that did not contain any part of the avalanche deposit were deleted manually. The final fishnet consisted of 5,387 cells, where each cell is 400 m2 (fig. 4).
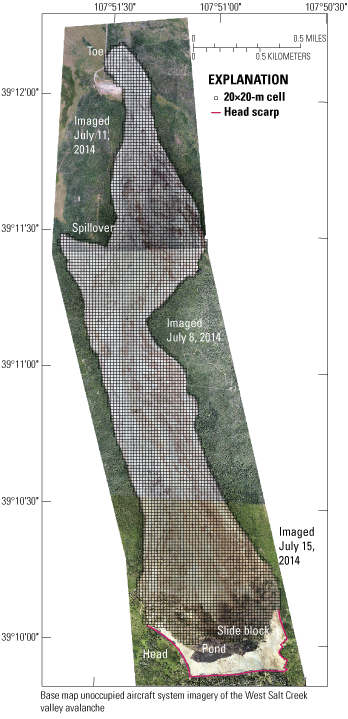
Merged image from three unoccupied aircraft system (UAS) photographs with a fishnet overlay for the West Salt Creek valley avalanche deposit. The images were acquired at 12:00 p.m. MDT on July 8, 11, and 15, 2014. Labels indicate the head (top), toe (terminus), and a spillover lobe where part of the avalanche ran over the crest of a high ridge. No boulder count was performed for the head scarp and top of the slide block, which was covered by a pond. The approximate location of the head scarp is indicated; see Coe and others (2016a, b) for greater detail.
To log the number of boulders greater than or equal to 1 meter (≥1 m) in size in each cell, two new fields were added to the fishnet shapefile attribute table in ArcMap (Lewis and others, 2022). These fields were BoulderNum, which was used to input the number of boulders ≥1 m (as determined by comparing visible boulder faces against a 1-m square in ArcMap) that were counted for each cell, and BoulderTH, which was used to assign a boulder-count range to each cell. The threshold limits for the ranges were greater than or equal to (≥) 0, ≥5, ≥10, ≥20, ≥40, and ≥80 boulders per cell, so that boulder count thresholds increase by powers of two for counts ≥5. For a visual representation, each range was assigned a different shade of red that becomes progressively darker as higher thresholds are reached.
Boulders within the West Salt Creek valley avalanche were sourced from either a red, basalt-rich colluvium or derived from bedrock of the Eocene Green River Formation, which is primarily shale in this area (Ellis and Gabaldo, 1989) and is exposed in the head scarp (fig. 4) and underlies much of the avalanche deposit. We observed in the field that few basalt boulders that had been transported by the avalanche were fractured. Basalt boulder surfaces were rounded and weathered, with few nicks, scrapes, or other signs of fragmentation during transport. The boulders derived from the Green River Formation were brittle and weaker than the basalt boulders, contained bedding, were blocky with angular surfaces; and many contained networks of fine cracks. Thus, the only boulders that were counted were those derived from the Green River Formation. Boulders from the Green River Formation were distinguished in the imagery from the basalt boulders by their color and shape. The Green River Formation boulders are light in color and more angular than the basalt boulders, which are red and rounded. To determine which Green River Formation boulders were ≥1 m, boulders in the imagery were compared to a 1×1-m square that was made using the drawing feature in ArcMap. By placing the square over each boulder, each boulder that was enclosed by the square or touched it on opposite sides was counted as ≥1 m. Boulders in each cell of the fishnet were manually counted in ArcMap.
After the fishnet was created and the reference square was drawn, six square sections (5×5 cells) were spaced out along the centerline of the avalanche deposit for analysis. These sections provided a basic overview of the deposit and were used to determine if there was a boulder distribution density pattern. After confirming that a pattern existed, boulders in all remaining cells were counted. Once the number of boulders in each cell was determined and the corresponding count range was assigned to each cell, areas that appeared to have artificial or sharp boundaries were examined again to ensure accuracy. The final map product showing the count range distribution of boulders ≥1 m on the surface of the avalanche deposit is shown in figure 5.
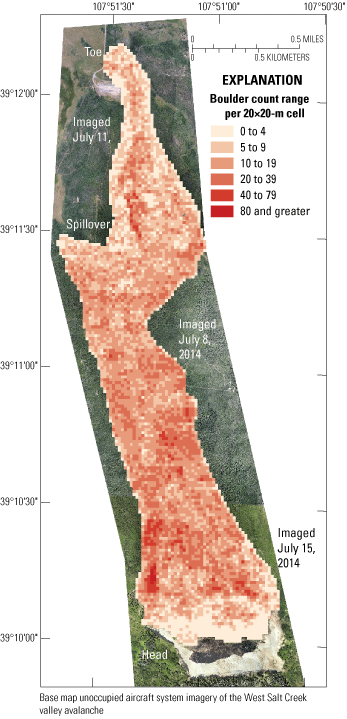
Merged image from three unoccupied aircraft system (UAS) photographs with boulder count ranges for counts of surface boulders sourced from the Green River Formation that were greater than or equal to 1 meter imposed on the West Salt Creek valley avalanche deposit. The images were acquired at 12:00 p.m. MDT on July 8, 11, and 15, 2014. Labels indicate the head (top), toe (terminus), and a spillover lobe where part of the avalanche ran over the crest of a high ridge.
Results
After completing all mapping of the distribution density for boulders sourced from the Green River Formation and ≥1 m (fig. 5; Lewis and others, 2022), we divided the avalanche deposit into thirds and calculated the relative abundance of the boulder-count ranges in each third. Analysis of the cell attributes (Lewis and others, 2022) from the map (fig. 5) yielded the total number of 20×20-m cells in each third of the map and the number of cells in each boulder-count range for each third. Dividing the number of cells in each range by the total number of cells in each third indicated the relative abundance (expressed as a percentage) of each boulder-count range for boulders ≥1 m within each third of the mapped deposit area (fig. 6). For count ranges of 40–79 and 80 and greater boulders per cell, the upper third of the deposit has the highest percentage of cells (fig. 6). This is somewhat masked by the many low-count (<10 boulders per cell) cells near the head, but the relative abundance of high-count cells in the upper third of the avalanche deposit is apparent in figure 5. For cells having 10 to <40 boulders per cell, the middle third of the avalanche deposit has the highest percentages of cells. The lower third of the avalanche deposit has the highest concentrations of cells for count ranges <10 boulders per cell. These patterns are consistent with the hypothesis that boulder concentrations on the surface of the deposit decrease with increasing distance from the head. Concentrations of large boulders are also found in known drainage paths along the entire avalanche deposit.
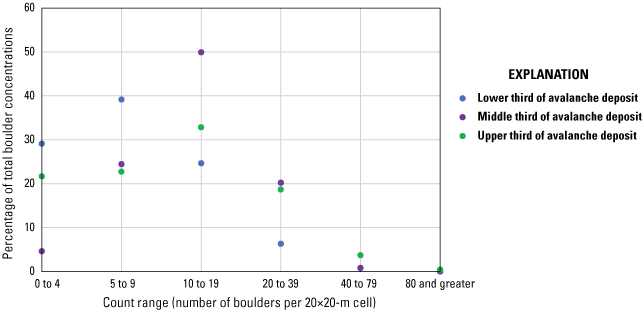
Graph of large (greater than or equal to 1 meter) boulder concentrations by count range for each third of the avalanche deposit.
Discussion
The quality of the imagery collected and the possibility of human error while virtually counting the number of large boulders in each grid cell introduced minor uncertainty in number of boulders counted. However, we are confident that the relative abundance of boulders in each cell is accurate. Boulders were most difficult to count in areas of high reflectance and low contrast (lighter toned areas of the avalanche deposit image) because boulders sourced from the Green River Formation are primarily light in color. A few large boulders might have been overlooked because they blended into the surface, or they could have been overestimated in a few locations where it was difficult to distinguish boulders from artifacts in the imagery. The edges of some boulders were obscured by shadows of fallen trees, shadows from large rock outcrops, or imperfections in the UAS imagery. Thus, the uncertainty about the true edges of such boulders indicates that some boulders could have been miscounted during the mapping process. These factors could contribute to the miscounting of large boulders in the mapping area; however, we expect that errors in boulder counts within any 20×20-m cell would usually be less than ±5 percent, and in most cells, the errors likely are considerably less. Areas of differing boulder concentrations are readily distinguishable in the imagery even if relatively few boulders or boulder edges may be obscured or partially obscured as noted above. Two of us (Coe and Baum) walked over the entire surface of the deposit in the months following the avalanche while using the imagery to conduct detailed mapping of avalanche structural features (Coe and others, 2016a). Although we did not map individual boulders at that time, we observed patterns of boulder distribution and are confident that the distribution is well-expressed in the UAS imagery (fig. 3) and final map of boulder distribution density (fig. 5). The boulders sourced from the Green River Formation were rapidly disintegrating into rock chips and clayey soil during the summers of 2014 and 2016 when we were conducting fieldwork. Thus, any attempt to field-check the boulder count or to repeat it using future high-resolution imagery would find small heaps of soil and rock chips instead of boulders.
By setting the lower limits of boulder-count ranges to increase by a factor of two (except for the first range of 0 to 4), we ensured that even with substantial errors, the ranges would correctly portray the boulder density distribution. Using these limits, boulder counts are usually assigned to the correct range or, at worst, to one of the nearest-neighbor ranges. If boulders were undercounted by less than 50 percent, the count would be assigned to either the correct range or the range below. For example, if the correct boulder count was 28 and it was undercounted by 50 percent (14), the cell would be assigned to the 10–19 range rather than the correct 20–39 range. If undercounted by 25 percent (21 boulders), the 28 boulders would be assigned to the correct 20–39 range. Similarly, if boulders were overcounted by less than 100 percent, the count would be assigned either to the correct range or the range above. Continuing the example above, if the 28 boulders are overcounted by 100 percent (56 boulders), the count would be assigned to the 40–79 range, but if overcounted by 40 percent (39 boulders) the count would still be assigned to the correct 20–39 range. Despite imperfections in the imagery and other sources of uncertainty described previously, we are confident that counting errors are much smaller than those in the example above. Also, as noted previously, areas with apparently sharp boundaries were recounted to ensure greater accuracy. Consequently, the count-range limits used enable the final map (fig. 5) to provide a realistic representation of the boulder distribution density on the surface of the avalanche deposit.
Conclusion
Analysis of the aerial imagery and the corresponding count range abundance (fig. 6), support the original hypothesis that 1-m-sized and greater boulders are less abundant near the toe than at the head of the avalanche. The general patterns of decreasing boulder abundance with increasing distance from the head depicted in figures 5 and 6 are consistent with field observations (Baum and others, 2016; Coe and others, 2016a). However, additional studies on other rock avalanche deposits would be beneficial to confirm the observations of this work. Additional studies could be used to determine the likely cause(s) of the observed pattern of boulder distribution.
References Cited
Baum, R.L., Coe, J.A., Geiger, J.W., and Bessette-Kirton, E.K., 2016, Outburst flood creates opportunity to look inside the West Salt Creek rock avalanche deposit, Mesa County, Colorado: Geological Society of America Abstracts with Programs, v. 48, no. 7, accessed April 19, 2023, at https://doi.org/10.1130/abs/2016AM-283901.
Coe, J.A., Baum, R.L., Allstadt, K.E., Kochevar, B.F., Jr., Schmitt, R.G., Morgan, M.L., White, J.L., Stratton, B.T., Hayashi, T.A., and Kean, J.W., 2016a, Rock-avalanche dynamics revealed by large-scale field mapping and seismic signals at a highly mobile avalanche in the West Salt Creek valley, western Colorado: Geosphere, v. 12, no. 2, p. 607–631, accessed February 12, 2016, at https://doi.org/10.1130/GES01265.1.
Coe, J.A., Baum, R.L., Allstadt, K.E., Kochevar, B.F., Schmitt, R.G., Morgan, M.L., White, J.L., Stratton, B.T., Hayashi, T.A., and Kean, J.W., 2016b, Map data and unmanned aircraft system imagery from the May 25, 2014 West Salt Creek rock avalanche in western Colorado: U.S. Geological Survey data release, accessed October 1, 2020, at https://doi.org/10.5066/F74J0C55.
Davies, T.R., and McSaveney, M.J., 2009, The role of rock fragmentation in the motion of large landslides: Engineering Geology, v. 109, no. 1–2, p. 67–79, accessed April 18, 2023, at https://doi.org/10.1016/j.enggeo.2008.11.004.
Lewis, A.C., Coe, J.A., and Baum, R.L., 2022, Distribution of large boulders on the deposit of the West Salt Creek rock avalanche, western Colorado: U.S. Geological Survey data release, https://doi.org/10.5066/P9MWDI9P.
Publishing support provided by the Science Publishing Network,
Denver and Reston Publishing Service Centers
For more information concerning the research in this report, contact the
Center Director, USGS Geologic Hazards Science Center
Box 25046, Mail Stop 966
Denver, CO 80225
(303) 273-8579
Or visit Geologic Hazards Science Center website at
Disclaimers
Any use of trade, firm, or product names is for descriptive purposes only and does not imply endorsement by the U.S. Government.
Although this information product, for the most part, is in the public domain, it also may contain copyrighted materials as noted in the text. Permission to reproduce copyrighted items must be secured from the copyright owner.
Suggested Citation
Lewis, A.C., Baum, R.L., and Coe, J.A., 2023, Distribution of large boulders on the deposit of the West Salt Creek rock avalanche, western Colorado: U.S. Geological Survey Data Report 1178, 6 p., https://doi.org/10.3133/dr1178.
ISSN: 2771-9448 (online)
Study Area
| Publication type | Report |
|---|---|
| Publication Subtype | USGS Numbered Series |
| Title | Distribution of large boulders on the deposit of the West Salt Creek rock avalanche, western Colorado |
| Series title | Data Report |
| Series number | 1178 |
| DOI | 10.3133/dr1178 |
| Publication Date | July 14, 2023 |
| Year Published | 2023 |
| Language | English |
| Publisher | U.S. Geological Survey |
| Publisher location | Reston, VA |
| Contributing office(s) | Geologic Hazards Science Center |
| Description | Report: iv, 6 p.; Data Release |
| Country | United States |
| State | Colorado |
| Online Only (Y/N) | Y |