

Quality of Surface Water in Missouri, Water Year 2021
Links
- Document: Report (7.7 MB pdf) , HTML , XML
- Dataset: USGS National Water Information System database —USGS water data for the Nation
- NGMDB Index Page: National Geologic Map Database Index Page (html)
- Download citation as: RIS | Dublin Core
Acknowledgments
The author would like to thank the Missouri Department of Natural Resources for providing technical guidance throughout the report series.
The author would like to acknowledge the staff from the U.S. Geological Survey Central Midwest Water Science Center who supported the project by assisting with data collection, administration, and technical reviews.
Abstract
The U.S. Geological Survey, in cooperation with the Missouri Department of Natural Resources, maintains a statewide group of stations known as the Ambient Water-Quality Monitoring Network, which includes selected streams and springs in Missouri. During water year 2021 (October 1, 2020, through September 30, 2021), the U.S. Geological Survey collected water-quality data at 72 stations: 70 Ambient Water-Quality Monitoring Network stations and 2 U.S. Geological Survey National Water Quality Network stations. Four of the stations have data from additional sampling completed in cooperation with the U.S. Army Corps of Engineers. Water-quality data provided in this report include dissolved oxygen, specific conductance, water temperature, suspended solids, suspended sediment, Escherichia coli bacteria, fecal coliform bacteria, dissolved nitrate plus nitrite as nitrogen, total phosphorus, dissolved and total recoverable lead and zinc, and selected pesticide compounds. Monitoring stations have been classified based on the physiographic province or primary land use in the drainage basin or based on the unique hydrologic characteristics of the waterbodies (springs, large rivers) monitored. A summary of hydrologic conditions, including peak streamflows, monthly mean streamflows, and 7-day low flows, also is provided for representative streamgages in the State.
Introduction
In the State of Missouri, implementation of the Federal Clean Water Act (33 U.S.C. §1251 et seq.) is the responsibility of the Missouri Department of Natural Resources (MDNR). Section 305(b) of the Clean Water Act requires that each State develop a water-quality monitoring program and periodically generate a report providing a description of the water quality of all navigable waters in the State (U.S. Environmental Protection Agency, 1997). Water-quality status is described in terms of the suitability of these navigable waters for various uses, such as drinking, fishing, swimming, and supporting aquatic life. These uses formally were defined as “designated uses” in State and Federal regulations. Section 303(d) of the Clean Water Act requires States to identify impaired waters and determine the total maximum daily loads of contaminants that can be present in waterbodies and still meet applicable water-quality standards for their designated uses (U.S. Environmental Protection Agency, 2022). A total maximum daily load addresses a single contaminant for each waterbody.
Missouri has an area of about 69,000 square miles and an estimated population of 6.15 million people as of 2020 (U.S. Census Bureau, 2021). Within Missouri, 115,701 miles (mi) of classified streams support a variety of uses, including wildlife, recreation, agriculture, industry, transportation, and public utilities. About 11,673 mi (about 10 percent) of these classified streams had data available for assessment in the State’s most recent water-quality report (Missouri Department of Natural Resources, 2020). Of the 11,673 mi of assessed streams, an estimated 6,099 mi (about 52 percent) fully support the designated uses, an estimated 5,574 mi (about 48 percent) are impaired, and the remaining stream miles were unassessed or did not have recent data within the past 5 years. Impairments may be caused by various physical changes or chemical contaminants leading to the inability of the waterbody to meet the criteria for at least one of the designated uses (Missouri Department of Natural Resources, 2020).
The purpose of this report is to summarize surface-water-quality data collected for the MDNR–U.S. Geological Survey (USGS) cooperative Ambient Water-Quality Monitoring Network (AWQMN) for water year 2021 (October 1, 2020, through September 30, 2021). The annual summary of data for selected constituents provides the MDNR with current information to assess the quality of surface water within the State. This report is one in a series of annual summaries (Otero-Benitez and Davis, 2009a, b; Barr, 2010, 2011, 2012, 2014, 2015; Barr and Schneider, 2014; Barr and Heimann, 2016; Barr and Bartels, 2018, 2019; Kay, 2019, 2021; Buckley 2022). Data on the physical characteristics and water-quality constituents in samples collected during water year 2021 are provided in figures and tables for 72 surface-water stations throughout the State.
The Ambient Water-Quality Monitoring Network
As part of the Missouri AWQMN, the USGS, in cooperation with the MDNR, collects surface-water-quality data to assess water resources in Missouri each water year. The MDNR and the USGS established the fixed-station AWQMN in 1964 with 18 stations, 5 of which were still being sampled during water year 2021. The number and location of AWQMN stations since 1964 have varied as the State’s needs have changed. Data collected at AWQMN stations during water year 2021 are stored and maintained in the USGS National Water Information System (NWIS) database and are available for public access (U.S. Geological Survey, 2022). These data are a permanent source of accessible, accurate, impartial, and timely information.
The AWQMN data provide an understanding of the State’s current water resources, including spatial and temporal trends of the water resources. Historical surface-water-quality data have been published annually in the Water Data Report series since water year 1964 and can be accessed at https://wdr.water.usgs.gov/ (U.S. Geological Survey, 2006b–2010). Beginning in water year 2011, discrete water-quality data were no longer published annually but can be accessed through NWIS (U.S. Geological Survey, 2022).
The objectives of the AWQMN are to (1) obtain sufficient data to provide an accurate representation of the quality and quantity of surface water throughout the State; (2) provide a database of water-quality data accessible by the public and government agencies; and (3) provide consistent methodology in data collection, laboratory analysis, and data reporting, allowing for accurate comparison of data between sites and through time, and to identify anthropogenic effects (mining, agriculture, urban) on water resources (Missouri Department of Natural Resources, 2022). Data from the AWQMN are critical to meeting information needs of the public and Federal, State, and local agencies involved in water-quality planning and management by supporting the design, implementation, and evaluation of preventive and remediation programs. Recently, constituent concentration data from the AWQMN have been used to determine the statewide water-quality status and identify trends in water quality over 25 years (Barr and Davis, 2010; Richards and Barr, 2021).
Samples were collected from the 72 primary AWQMN stations; no alternate sampling sites were needed for the water year 2021 sampling schedule. Sampling frequency at each station is determined by several factors: drainage basin size, anthropogenic activities (such as mining, agriculture, and urban), volatility of chemical conditions through time, request for annual data, and cost. Each of the streams in the AWQMN is classified for one or more designated uses. For specific information on the designated uses applicable to the streams sampled in the AWQMN, refer to Missouri Department of Natural Resources (2020, 202222).
Constituents collected within the AWQMN have been established by the MDNR based on their data needs at each station. Samples were collected by USGS personnel using published methods and techniques (U.S. Geological Survey, 2006a). Onsite measurements of dissolved oxygen, specific conductance, and water temperature were collected at each station according to procedures described in Wilde (variously dated). Water samples were collected and processed for fecal indicator bacteria (Escherichia coli [E. coli] and fecal coliform) densities using the membrane filtration procedure described in Myers and others (2014). Methods from the USGS (U.S. Geological Survey, 2006a), Guy (1969), Wilde and others (2002), and Sandstrom and Wilde (2014) were used by the USGS to collect and process representative samples for analyses of nutrients, primary chemical constituents, trace elements, suspended solids, suspended sediment, and pesticides. All laboratory analyses were done by the USGS National Water Quality Laboratory (NWQL) in Lakewood, Colorado, according to procedures described in Garbarino and others (2006), Fishman (1993), Patton and Kryskalla (2011), Patton and Truitt (1992, 2000), Sandstrom and others (2001, 2015), and Zaugg and others (1995). Suspended-sediment concentrations were analyzed at the USGS Central Midwest Water Science Center Sediment Laboratory in Rolla, Missouri, and processed and computed according to procedures described in Guy (1969).
In addition to the surface-water-quality data collected for the AWQMN, data collected as part of other cooperative efforts are included in this report to improve the summary of water-quality conditions for the State. Additional data-collection efforts include water samples collected by the USGS at 2 USGS National Water Quality Network (NWQN, a national water-quality sampling network operated by the USGS) stations and suspended-sediment samples collected at 4 USGS streamgages on the Mississippi and Missouri Rivers (not shown). The suspended-sediment samples are collected in cooperation with the U.S. Army Corps of Engineers as part of a larger monitoring effort. The suspended-sediment concentration data in this report are provided for comparison to the State’s total suspended-solids criteria and consist of composited cross-sectional concentrations and mean cross-sectional concentrations computed from five depth-integrated samples within the cross section (Edwards and Glysson, 1999).
The unique eight-digit number used by the USGS to identify each surface-water station is assigned when a station is first established. The eight-digit number for each station includes a two-digit prefix that designates the primary river system (05 is the upper Mississippi River, 06 is the Missouri River, and 07 is the lower Mississippi River) plus a six-digit downstream-order number; for example, the station number 05587455 indicates the station is in the upper Mississippi River system (05), and the remaining six digits (587455) indicate the location of the station in downstream order. In this system, the station numbers increase downstream along the main stem. A station on a tributary that enters between two main stem stations is assigned a station number between the numbers on the main stem.
The total planned number of samples at all sites in the AWQMN may not have been collected during water year 2021. The 2019 novel coronavirus global pandemic, as identified by the World Health Organization (World Health Organization, 2022), continued during water year 2021 and occasionally impeded the timely sampling of the AWQMN stations because some sampling trips were canceled because of safety requirements within the USGS. Every effort was made to collect the required number of samples at all AWQMN stations, and in some cases, additional makeup samples were collected during water year 2021. A summary of collected versus planned samples is provided in table 1.
Table 1.
U.S. Geological Survey station number, station name, contributing drainage area, sampling frequency, station class, and station type for selected surface-water-quality monitoring stations in Missouri, water year 2021.[Water year 2021 is defined as October 1, 2020, through September 30, 2021. USGS, U.S. Geological Survey; mi2, square mile; DTPL, Dissected Till Plains; ag, agriculture; OTHER, station does not fit into any category; BRMIG, Big River—Mississippi River below Grafton, Illinois; wi, watershed (drainage area) indicator; BRMOSJ, Big River—Missouri River at St. Joseph, Missouri; BRMOS, Big River—Missouri River at Sibley, Missouri; MINING, mining; OSPL, Osage Plains; pr, prairie; OZPLSP, Ozark Plateaus—Springfield Plateau; fo, forest; OZPLSA, Ozark Plateaus—Salem Plateau; NA, not applicable; SPRING, spring; BRMOH, Big River—Missouri River at Hermann, Missouri; URBAN, urban; BRMIT, Big River—Mississippi River at Thebes, Illinois; MIALPL, Mississippi Alluvial Plain]
| USGS station number (figs. 1 and 3) |
Station namea | Contributing drainage area (mi2) | Water year 2021 sampling frequency—Collected/planned | Station class and type (fig. 1; table 2)b |
|||||
|---|---|---|---|---|---|---|---|---|---|
| 05495000 | Fox River at Wayland, Missouri | 400 | 6/6 | DTPL ag | |||||
| 05496000 | Wyaconda River above Canton, Missouri | 393 | 6/6 | DTPL ag | |||||
| 05497150 | North Fabius River near Ewing, Missouri | 471 | 6/6 | DTPL ag | |||||
| 05500000 | South Fabius River near Taylor, Missouri | 620 | 9/9 | DTPL ag | |||||
| 05514500c | Cuivre River near Troy, Missouri | 903 | 5/6 | OTHER | |||||
| 05587455d | Mississippi River below Grafton, Illinois | 171,300 | 12/12 | BRMIG | |||||
| 06817700 | Nodaway River near Graham, Missouri | 1,520 | 6/6 | DTPL wi ag | |||||
| 06818000d | Missouri River at St. Joseph, Missouri | 426,500 | 12/12 | BRMOSJ | |||||
| 06821190 | Platte River at Sharps Station, Missouri | 2,380 | 6/6 | DTPL wi ag | |||||
| 06894100 | Missouri River at Sibley, Missouri | 426,500 | 9/9 | BRMOS | |||||
| 06896187 | Middle Fork Grand River near Grant City, Missouri | 82.4 | 6/6 | DTPL ag | |||||
| 06898100 | Thompson River at Mount Moriah, Missouri | 891 | 6/6 | DTPL ag | |||||
| 06898800 | Weldon River near Princeton, Missouri | 452 | 6/6 | DTPL ag | |||||
| 06899580 | No Creek near Dunlap, Missouri | 34 | 9/9 | DTPL ag | |||||
| 06899950 | Medicine Creek near Harris, Missouri | 192 | 10/9 | DTPL ag | |||||
| 06900100 | Little Medicine Creek near Harris, Missouri | 66.5 | 10/9 | DTPL ag | |||||
| 06900900 | Locust Creek near Unionville, Missouri | 77.5 | 9/9 | DTPL ag | |||||
| 06902000 | Grand River near Sumner, Missouri | 6,880 | 7/9 | DTPL wi ag | |||||
| 06905500 | Chariton River near Prairie Hill, Missouri | 1,870 | 6/6 | DTPL wi ag | |||||
| 06905725 | Mussel Fork near Mystic, Missouri | 24 | 9/9 | DTPL ag | |||||
| 06906300 | East Fork Little Chariton River near Huntsville, Missouri | 220 | 6/6 | MINING | |||||
| 06907300c | Lamine River near Pilot Grove, Missouri | 949 | 6/9 | OTHER | |||||
| 06917630 | East Drywood Creek at Prairie State Park, Missouri | 3.38 | 4/6 | OSPL pr | |||||
| 06918070 | Osage River above Schell City, Missouri | 5,410 | 4/6 | OSPL wi ag | |||||
| 06918600 | Little Sac River near Walnut Grove, Missouri | 119 | 8/9 | OZPLSP ag/fo | |||||
| 06921070 | Pomme de Terre River near Polk, Missouri | 276 | 9/9 | OZPLSA fo/ag | |||||
| 06921590 | South Grand River at Archie, Missouri | 356 | 6/6 | OSPL ag | |||||
| 06923700 | Niangua River at Bennett Spring, Missouri | 441 | 6/6 | OZPLSA fo/ag | |||||
| 06926510 | Osage River below St. Thomas, Missouri | 14,584 | 6/6 | OZPLSA wi fo/ag | |||||
| 06927850 | Osage Fork of the Gasconade River near Lebanon, Missouri | 43.6 | 6/6 | OZPLSA fo/ag | |||||
| 06928440 | Roubidoux Spring at Waynesville, Missouri | NA | 6/6 | SPRING | |||||
| 06930450 | Big Piney River at Devils Elbow, Missouri | 746 | 8/9 | OZPLSA fo/ag | |||||
| 06930800 | Gasconade River above Jerome, Missouri | 2,570 | 8/9 | OZPLSA wi fo/ag | |||||
| 06934500d, e | Missouri River at Hermann, Missouri | 522,500 | 14/14 | BRMOH | |||||
| 07014000 | Huzzah Creek near Steelville, Missouri | 259 | 5/6 | OZPLSA fo/ag | |||||
| 07014200 | Courtois Creek at Berryman, Missouri | 173 | 6/6 | OZPLSA fo/ag | |||||
| 07014500 | Meramec River near Sullivan, Missouri | 1,475 | 8/9 | OZPLSA wi fo/ag | |||||
| 07016400 | Bourbeuse River above Union, Missouri | 808 | 9/9 | OZPLSA fo/ag | |||||
| 07018100 | Big River near Richwoods, Missouri | 735 | 9/9 | MINING | |||||
| 07019280 | Meramec River at Paulina Hills, Missouri | 3,920 | 9/9 | URBAN wi | |||||
| 07020550 | South Fork Saline Creek near Perryville, Missouri | 55.3 | 5/6 | OZPLSA fo/ag | |||||
| 07021020 | Castor River at Greenbriar, Missouri | 423 | 6/6 | OZPLSA fo/ag | |||||
| 07022000d, e | Mississippi River at Thebes, Illinois | 713,200 | 14/14 | BRMIT | |||||
| 07036100 | St. Francis River near Saco, Missouri | 664 | 5/9 | OZPLSA fo/ag | |||||
| 07037300 | Big Creek at Sam A. Baker State Park, Missouri | 189 | 4/6 | OZPLSA fo/ag | |||||
| 07042450 | St. Johns Ditch at Henderson Mound, Missouri | 313 | 9/9 | MIALPL | |||||
| 07046250 | Little River Ditches near Rives, Missouri | 1,620 | 8/9 | MIALPL | |||||
| 07050150 | Roaring River Spring at Cassville, Missouri | NA | 5/6 | OZPLSP ag/fo | |||||
| 07052152 | Wilson Creek near Brookline, Missouri | 51 | 9/9 | URBAN | |||||
| 07052160 | Wilson Creek near Battlefield, Missouri | 58.3 | 11/12 | URBAN | |||||
| 07052250 | James River near Boaz, Missouri | 462 | 6/6 | URBAN | |||||
| 07052345 | Finley Creek below Riverdale, Missouri | 261 | 9/9 | OZPLSP ag/fo | |||||
| 07052500 | James River at Galena, Missouri | 987 | 9/9 | URBAN | |||||
| 07052820 | Flat Creek below Jenkins, Missouri | 274 | 9/9 | OZPLSP ag/fo | |||||
| 07053700c | Lake Taneycomo at Branson, Missouri | NA | 6/6 | OTHER | |||||
| 07053900 | Swan Creek near Swan, Missouri | 148 | 6/6 | OZPLSA fo/ag | |||||
| 07057500 | North Fork River near Tecumseh, Missouri | 561 | 4/6 | OZPLSA fo/ag | |||||
| 07057750 | Bryant Creek below Evans, Missouri | 214 | 4/6 | OZPLSA fo/ag | |||||
| 07061600 | Black River below Annapolis, Missouri | 493 | 3/6 | OZPLSA fo/ag | |||||
| 07066110 | Jacks Fork above Two River, Missouri | 425 | 6/9 | OZPLSA fo/ag | |||||
| 07067500 | Big Spring near Van Buren, Missouri | NA | 3/4 | SPRING | |||||
| 07068000 | Current River at Doniphan, Missouri | 2,038 | 9/9 | OZPLSA wi fo/ag | |||||
| 07068510 | Little Black River below Fairdealing, Missouri | 194 | 6/6 | OZPLSA fo/ag | |||||
| 07071000 | Greer Spring at Greer, Missouri | NA | 2/4 | SPRING | |||||
| 07071500 | Eleven Point River near Bardley, Missouri | 793 | 6/6 | OZPLSA fo/ag | |||||
| 07185764 | Spring River above Carthage, Missouri | 425 | 7/9 | OZPLSP ag/fo | |||||
| 07186480 | Center Creek near Smithfield, Missouri | 303 | 6/9 | MINING | |||||
| 07186600 | Turkey Creek near Joplin, Missouri | 41.8 | 6/9 | URBAN | |||||
| 07187000 | Shoal Creek above Joplin, Missouri | 427 | 7/9 | OZPLSP ag/fo | |||||
| 07188838 | Little Sugar Creek near Pineville, Missouri | 195 | 7/9 | OZPLSP ag/fo | |||||
| 07189000 | Elk River near Tiff City, Missouri | 851 | 11/9 | OZPLSP ag/fo | |||||
| 07189100 | Buffalo Creek at Tiff City, Missouri | 60.8 | 6/9 | OZPLSP ag/fo | |||||
Station names were obtained from the USGS National Water Information System database (U.S. Geological Survey, 2022).
Station classifications are based on physiography, land use, or unique station types, following the convention used in annual data summaries since water year 2007 (October 1, 2006, through September 30, 2007; Otero-Benitez and Davis, 2009a).
Station data are not included in this report because this station does not fit within the classification system used for this report.
Laboratory Reporting Conventions
The USGS NWQL uses method reporting conventions (Foreman and others, 2021) to establish the minimum concentration for which more than one quantitative measurement can be made. These reporting conventions are the minimum reporting level (MRL), the laboratory reporting level (LRL), the detection limit by DQCALC software (DLDQC), the reporting level by DQCALC software, and the detection limit by blank data. The MRL is defined by the NWQL as the smallest measured concentration of a substance that can be measured reliably using a given analytical method. The DLDQC is the lowest concentration of a substance that, with 90-percent confidence, will not exceed a blank sample concentration more than 1 percent of the time. The reporting level by DQCALC software is equal to two times the DLDQC or more, and the chance for a false positive is less than 1 percent. The detection limit by blank data is the lowest concentration that will not be exceeded more than 1 percent of the time. A long-term method detection limit (LT–MDL) is a detection level obtained by determining the standard deviation of 24 or more method detection limit spiked-sample measurements for an extended period. The LRL is computed as twice the LT–MDL.
Surface-Water-Quality Data Analysis Methods
The distribution of data for selected constituents is shown graphically using side-by-side boxplots (box and whiskers distributions). The plots show the center of the data (median, the center line of the boxplot), the variation (interquartile range [25th to 75th percentiles] or the height of the box), the skewness (quartile skew, which is the relative size of the box halves). The spread (upper and lower adjacent values are the vertical lines or whiskers and represent 1.5 times the interquartile range greater than the 75th and less than the 25th percentiles) and the presence or absence of unusual values or outliers (denoted by open circles) are also shown in the plots. If the median equals the 25th and 75th percentiles, the boxplot is represented by a single horizontal line. Boxplots with censored data (suspended solids, dissolved nitrate plus nitrite as nitrogen, total phosphorus, and dissolved and total recoverable lead and zinc) were modified by making the lower limit of the box equal to the MRL or LT–MDL, as appropriate.
All data collected from the stations during water year 2021 were obtained from the NWIS database (U.S. Geological Survey, 2022). These data can be compiled, by the public, from NWIS using search criteria such as the USGS station number and the desired date range (October 1, 2020, through September 30, 2021). In some instances, pesticide concentrations are reported as estimated or as a result that is less than the compound’s LRL. For use in this report, values reported at a concentration less than the LRL, whether censored or not, are reported as “<LRL” to aid in the identification of compounds with results greater than the LRL.
Station Classification for Data Analysis
The stations used in this report are located throughout the State of Missouri (fig. 1) and monitor drainage areas with a variety of geologic settings, land uses (fig. 2), and unique hydrologic systems. Most of the stations were grouped into first-order classifications according to the physiographic region (Fenneman, 1938; fig. 1) or the primary land use in the drainage area monitored by the station (fig. 2). The remaining stations were grouped into first-order classifications according to the unique hydrologic characteristics of the waterbody they monitor (fig. 1).
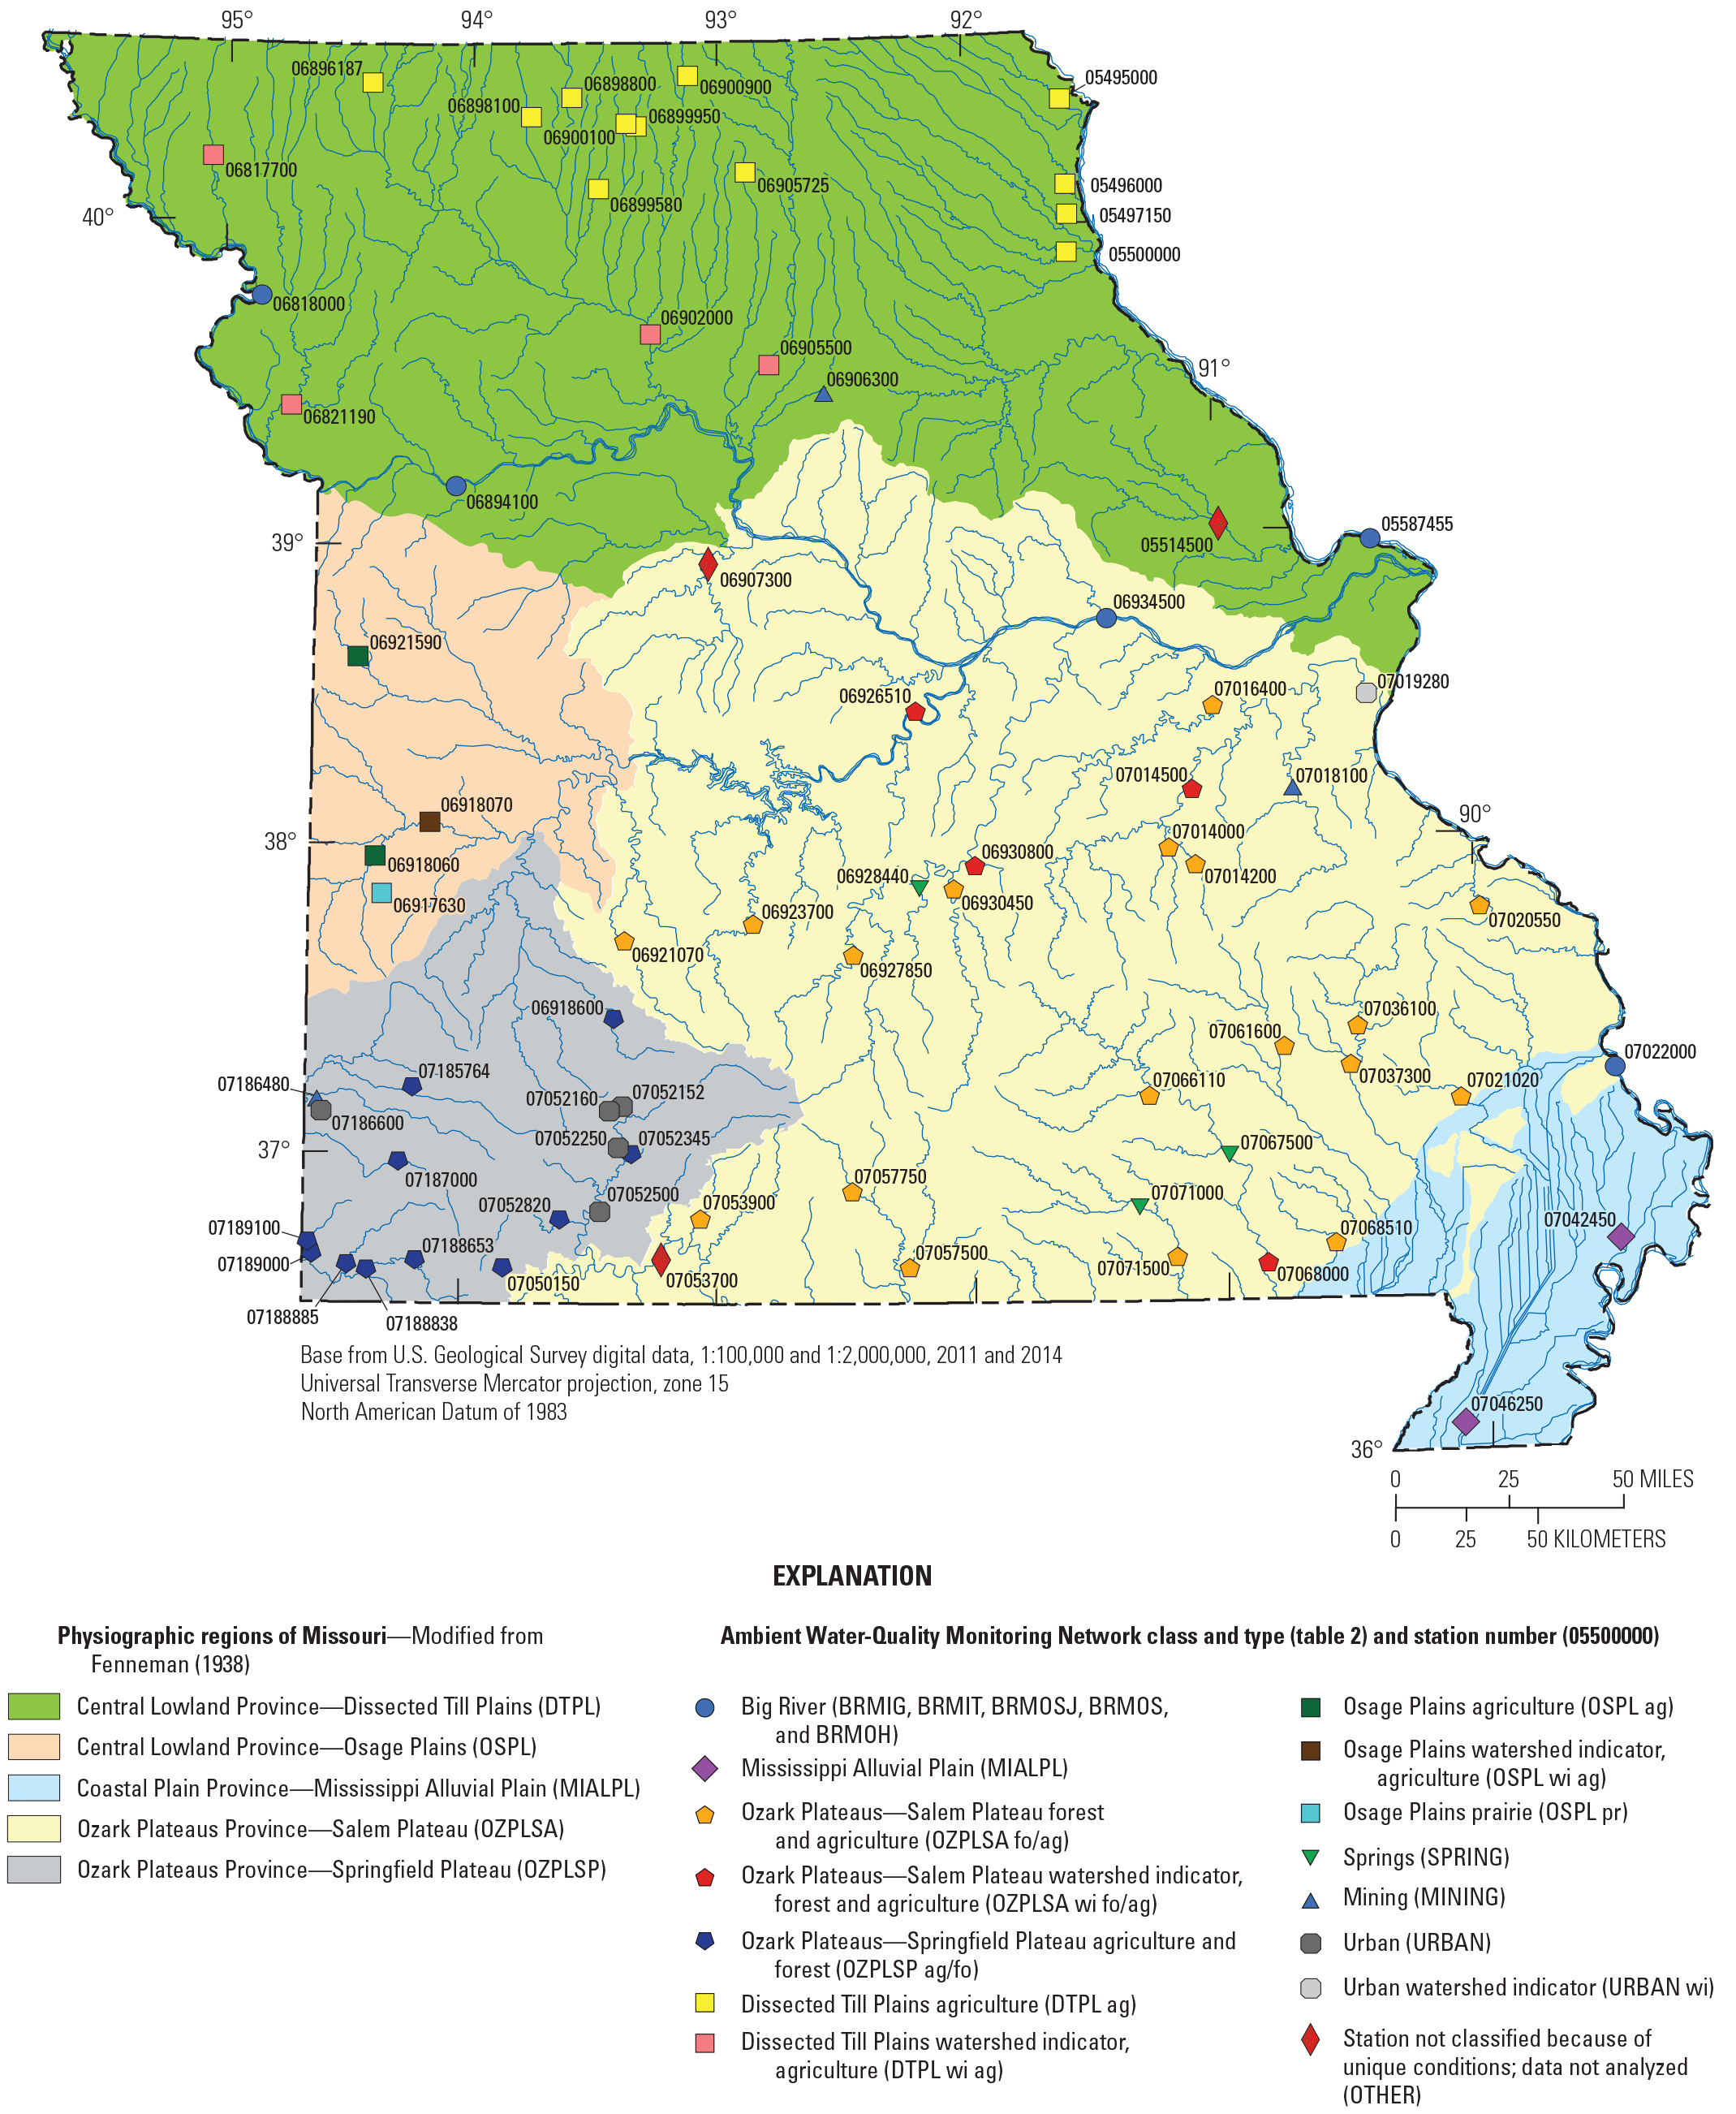
Physiographic regions of Missouri and location and class of selected surface-water-quality monitoring stations, water year 2021. [The term “watershed” is used for consistency with previous reports and denotes a drainage area]
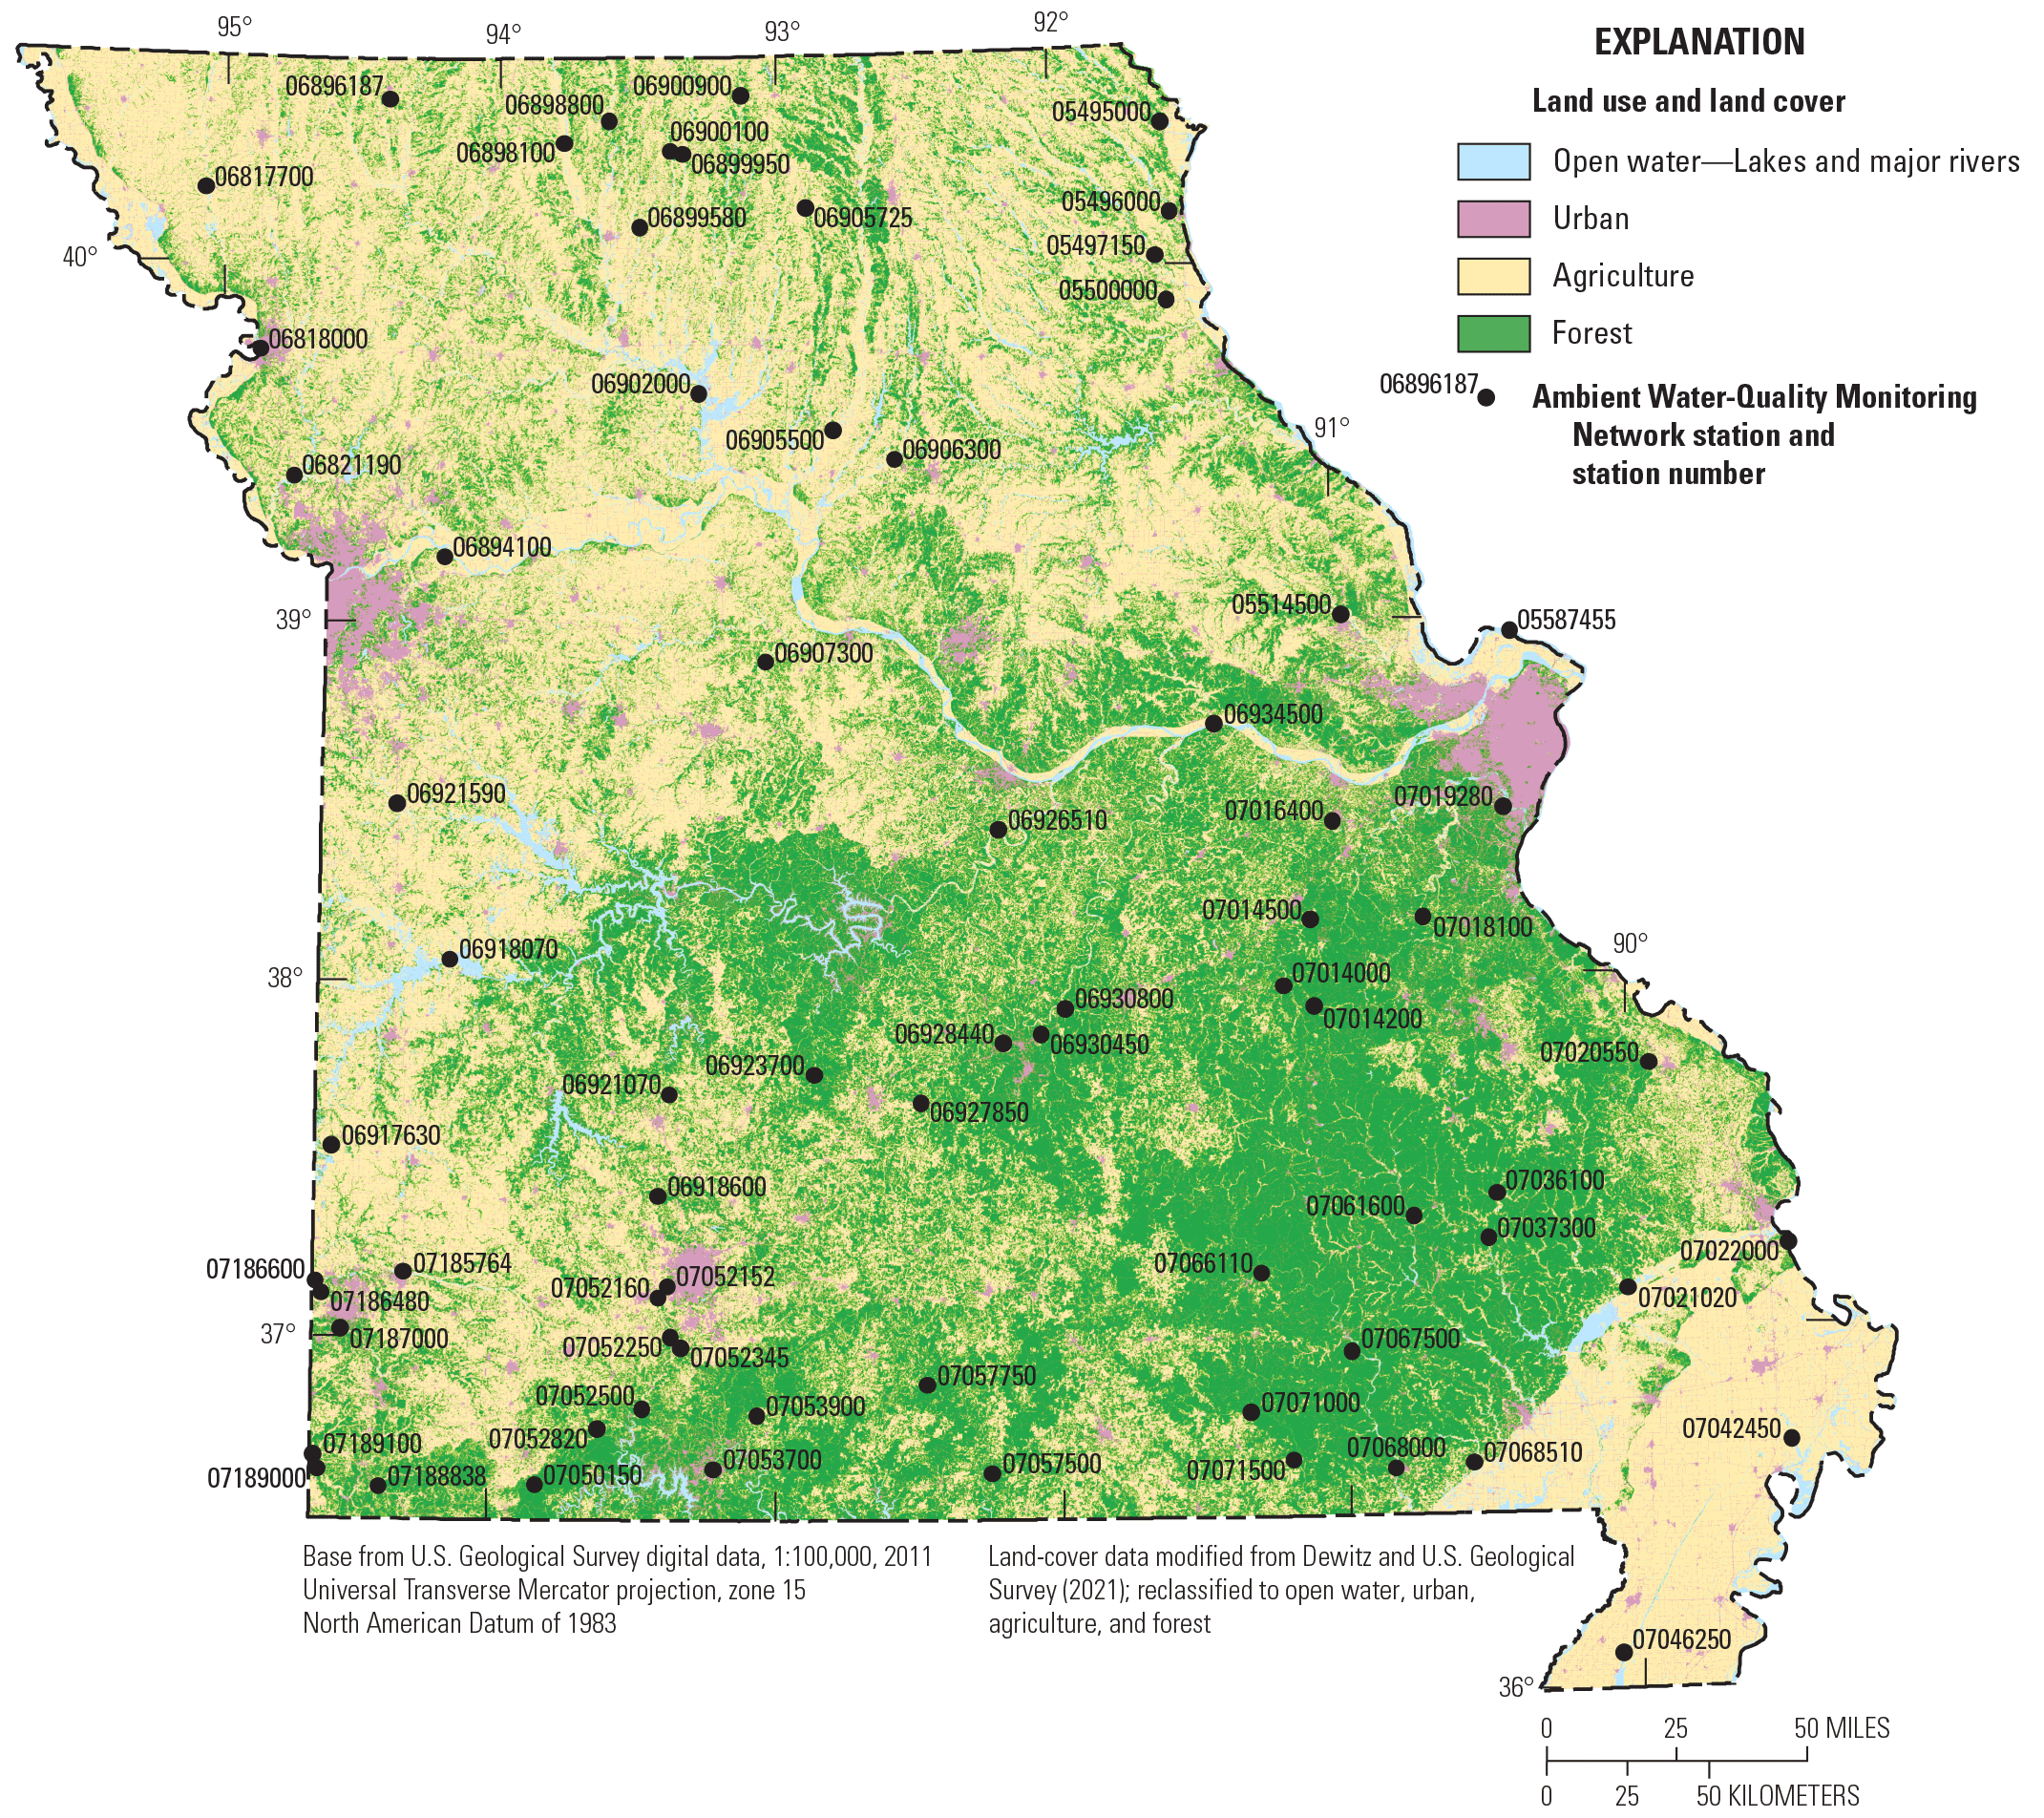
Land use in Missouri.
The physiography-based stations monitor drainage areas in the Dissected Till Plains (DTPL) in the north, the Osage Plains (OSPL) in the west-central region, the Mississippi Alluvial Plain (MIALPL) in the southeast, the Ozark Plateaus—Salem Plateau (OZPLSA) in the middle of the State, and the Ozark Plateaus—Springfield Plateau (OZPLSP) in the southwest (fig. 1). Water quality at the stations classified by physiography is expected to be substantially affected by natural chemical processes, including interactions with the geologic and biologic media.
Stations classified by the primary land use monitor drainage areas with substantial amounts of mining (MINING) or urban (URBAN) land use. These stations are grouped separately from the physiography-based stations to assess the effects of mining and urban land use on water quality.
Stations classified based on the unique hydrologic characteristics of the waterbodies they monitor refer to springs (SPRING) and the stations on the Mississippi River (BRMIG and BRMIT) and the Missouri River (BRMOSJ, BRMOS, and BRMOH). Stations on the Mississippi and Missouri Rivers are referred to as the “Big River stations” (fig. 1) in this report. Water chemistry at the SPRING stations is expected to differ from the other stations because the SPRING stations reflect the chemistry of the groundwater source. Water chemistry at the Big River stations is expected to differ from other stations because of the large size of the drainage areas they represent.
Each station that was classified by physiographic province was further subdivided into second-order classifications (referred to as “station type” in table 1). Second-order classifications were based on contributing drainage area or land use within the drainage area represented by the station (figs. 1, 2; table 2). The second-order classifications include watershed indicator (wi) stations (the term “watershed” is used for consistency with previous reports and denotes a drainage area) and land-use indicators. Stations with the wi classification are the most downstream stations in a drainage area greater than 1,000 square miles. Water-quality data obtained from wi stations can be interpreted as being representative of the general condition of the drainage area. Land-use indicator stations include stations where forest (fo), agriculture (ag), or prairie (pr) is the predominate land use in the drainage area upstream from the station. Water quality at land-use indicator stations is likely to be affected by a specific land use. When stations were in drainage areas where multiple land uses were present, the convention was to mention them in predominant order. The agriculture and forest (ag/fo) land-use indicator, for example, implies that the primary land use of the drainage area is agriculture, although a substantial part of the land use is forest (fig. 2).
Table 2.
Station classes and number of stations in each class and type for Missouri, water year 2021.[The classification system is based on the physiography of the State, primary and secondary land use and coverage, unique station type, and drainage area, as well as a station’s representativeness of the general condition of the watershed. See the “Station Classification for Data Analysis” section of this report for the full explanation of station classes and types]
| Station class and type (fig. 1)a | Number of stations (table 1)b |
|
|---|---|---|
| Abbreviation | Definition | |
| BRMIG | Big River—Mississippi River below Grafton, Illinois | 1 |
| BRMITc | Big River—Mississippi River at Thebes, Illinois | 1 |
| BRMOSJ | Big River—Missouri River at St. Joseph, Missouri | 1 |
| BRMOS | Big River—Missouri River at Sibley, Missouri | 1 |
| BRMOHc | Big River—Missouri River at Hermann, Missouri | 1 |
| MIALPL | Mississippi Alluvial Plain | 2d |
| OZPLSA fo/ag | Ozark Plateaus—Salem Plateau forest and agriculture | 18 |
| OZPLSA wi fo/ag | Ozark Plateaus—Salem Plateau watershed indicator, forest and agriculture | 4 |
| OZPLSP ag/fo | Ozark Plateaus—Springfield Plateau agriculture and forest | 9 |
| DTPL ag | Dissected Till Plains agriculture | 12 |
| DTPL wi ag | Dissected Till Plains watershed indicator, agriculture | 4 |
| OSPL ag | Osage Plains agriculture | 1 |
| OSPL wi ag | Osage Plains watershed indicator, agriculture | 1 |
| OSPL pr | Osage Plains prairie | 1 |
| SPRING | Springs | 3 |
| MINING | Mining | 3 |
| OTHER | Station not classified because of unique conditions; data not analyzed | 3 |
| URBAN | Urban | 5 |
| URBAN wi | Urban watershed indicator | 1 |
Only primary sampling stations listed in table 1 are included in this analysis. Alternate stations are omitted.
Classifications used in this report follow the convention used in annual data summaries since water year 2007 (October 1, 2006, through September 30, 2007; Otero-Benitez and Davis, 2009a). Three stations from the AWQMN are classified as OTHER (table 2), and sampling results from these sites are not included. The three excluded stations were Cuivre River near Troy, Mo. (05514500), and Lamine River near Pilot Grove, Mo. (06907300), in areas of transitional physiography and possible backwater flow from nearby major rivers, and Lake Taneycomo at Branson, Mo. (07053700), a station on a semiriverine system downstream from a major impoundment. These stations were recently reclassified by Richards and Barr (2021).
Hydrologic Conditions
Streamflow varies seasonally in Missouri and tends to reflect precipitation patterns and land uses (Slater and Villarini, 2017). During water year 2021, the mean annual precipitation of the conterminous United States was 29.77 inches (in.), which is 0.17 in. less than the 20th century mean (National Oceanic and Atmospheric Administration, 2021b). Total precipitation across Missouri during water year 2021 was 43.07 in., which is 2.57 in. greater than the 20th century precipitation mean for the State (National Oceanic and Atmospheric Administration, 2021a).
Data from six streamgages were used to identify the variation in hydrologic conditions described in this report. These six streamgages were selected based on their geographical distribution across the State (fig. 3) and long period of available streamflow information. Each selected streamgage has a period of record of at least 49 years. This summary of statewide hydrologic condition data for water year 2021 in comparison to historical conditions is a legacy of information, including the streamgages used, that was previously provided in the annual Water-Data Reports. The six selected streamgages are Fox River at Wayland, Mo. (05495000); Grand River near Gallatin, Mo. (06897500); South Grand River at Archie, Mo. (06921590); Gasconade River at Jerome, Mo. (06933500); James River at Galena, Mo. (07052500); and Current River at Van Buren, Mo. (07067000). Data from these streamgages were used to compare monthly mean streamflow during water year 2021 to the long-term monthly mean streamflow (majority have about 100 years of record; fig. 4) and to demonstrate how streamflow can vary across the State. Monthly mean streamflow is the arithmetic mean of daily streamflow for a given month. For comparison to water year 2021, a long-term mean was attained from all monthly mean streamflows for the available period of record. It should be noted that the water year 2021 monthly mean streamflow is denoted by the continuous line plot and the long-term monthly mean streamflow is denoted by the bars in figure 4. This change was made to better show the data trends and match most of the previous reports, unlike previous water year reports for 2018 and 2019, which reversed the naming convention.
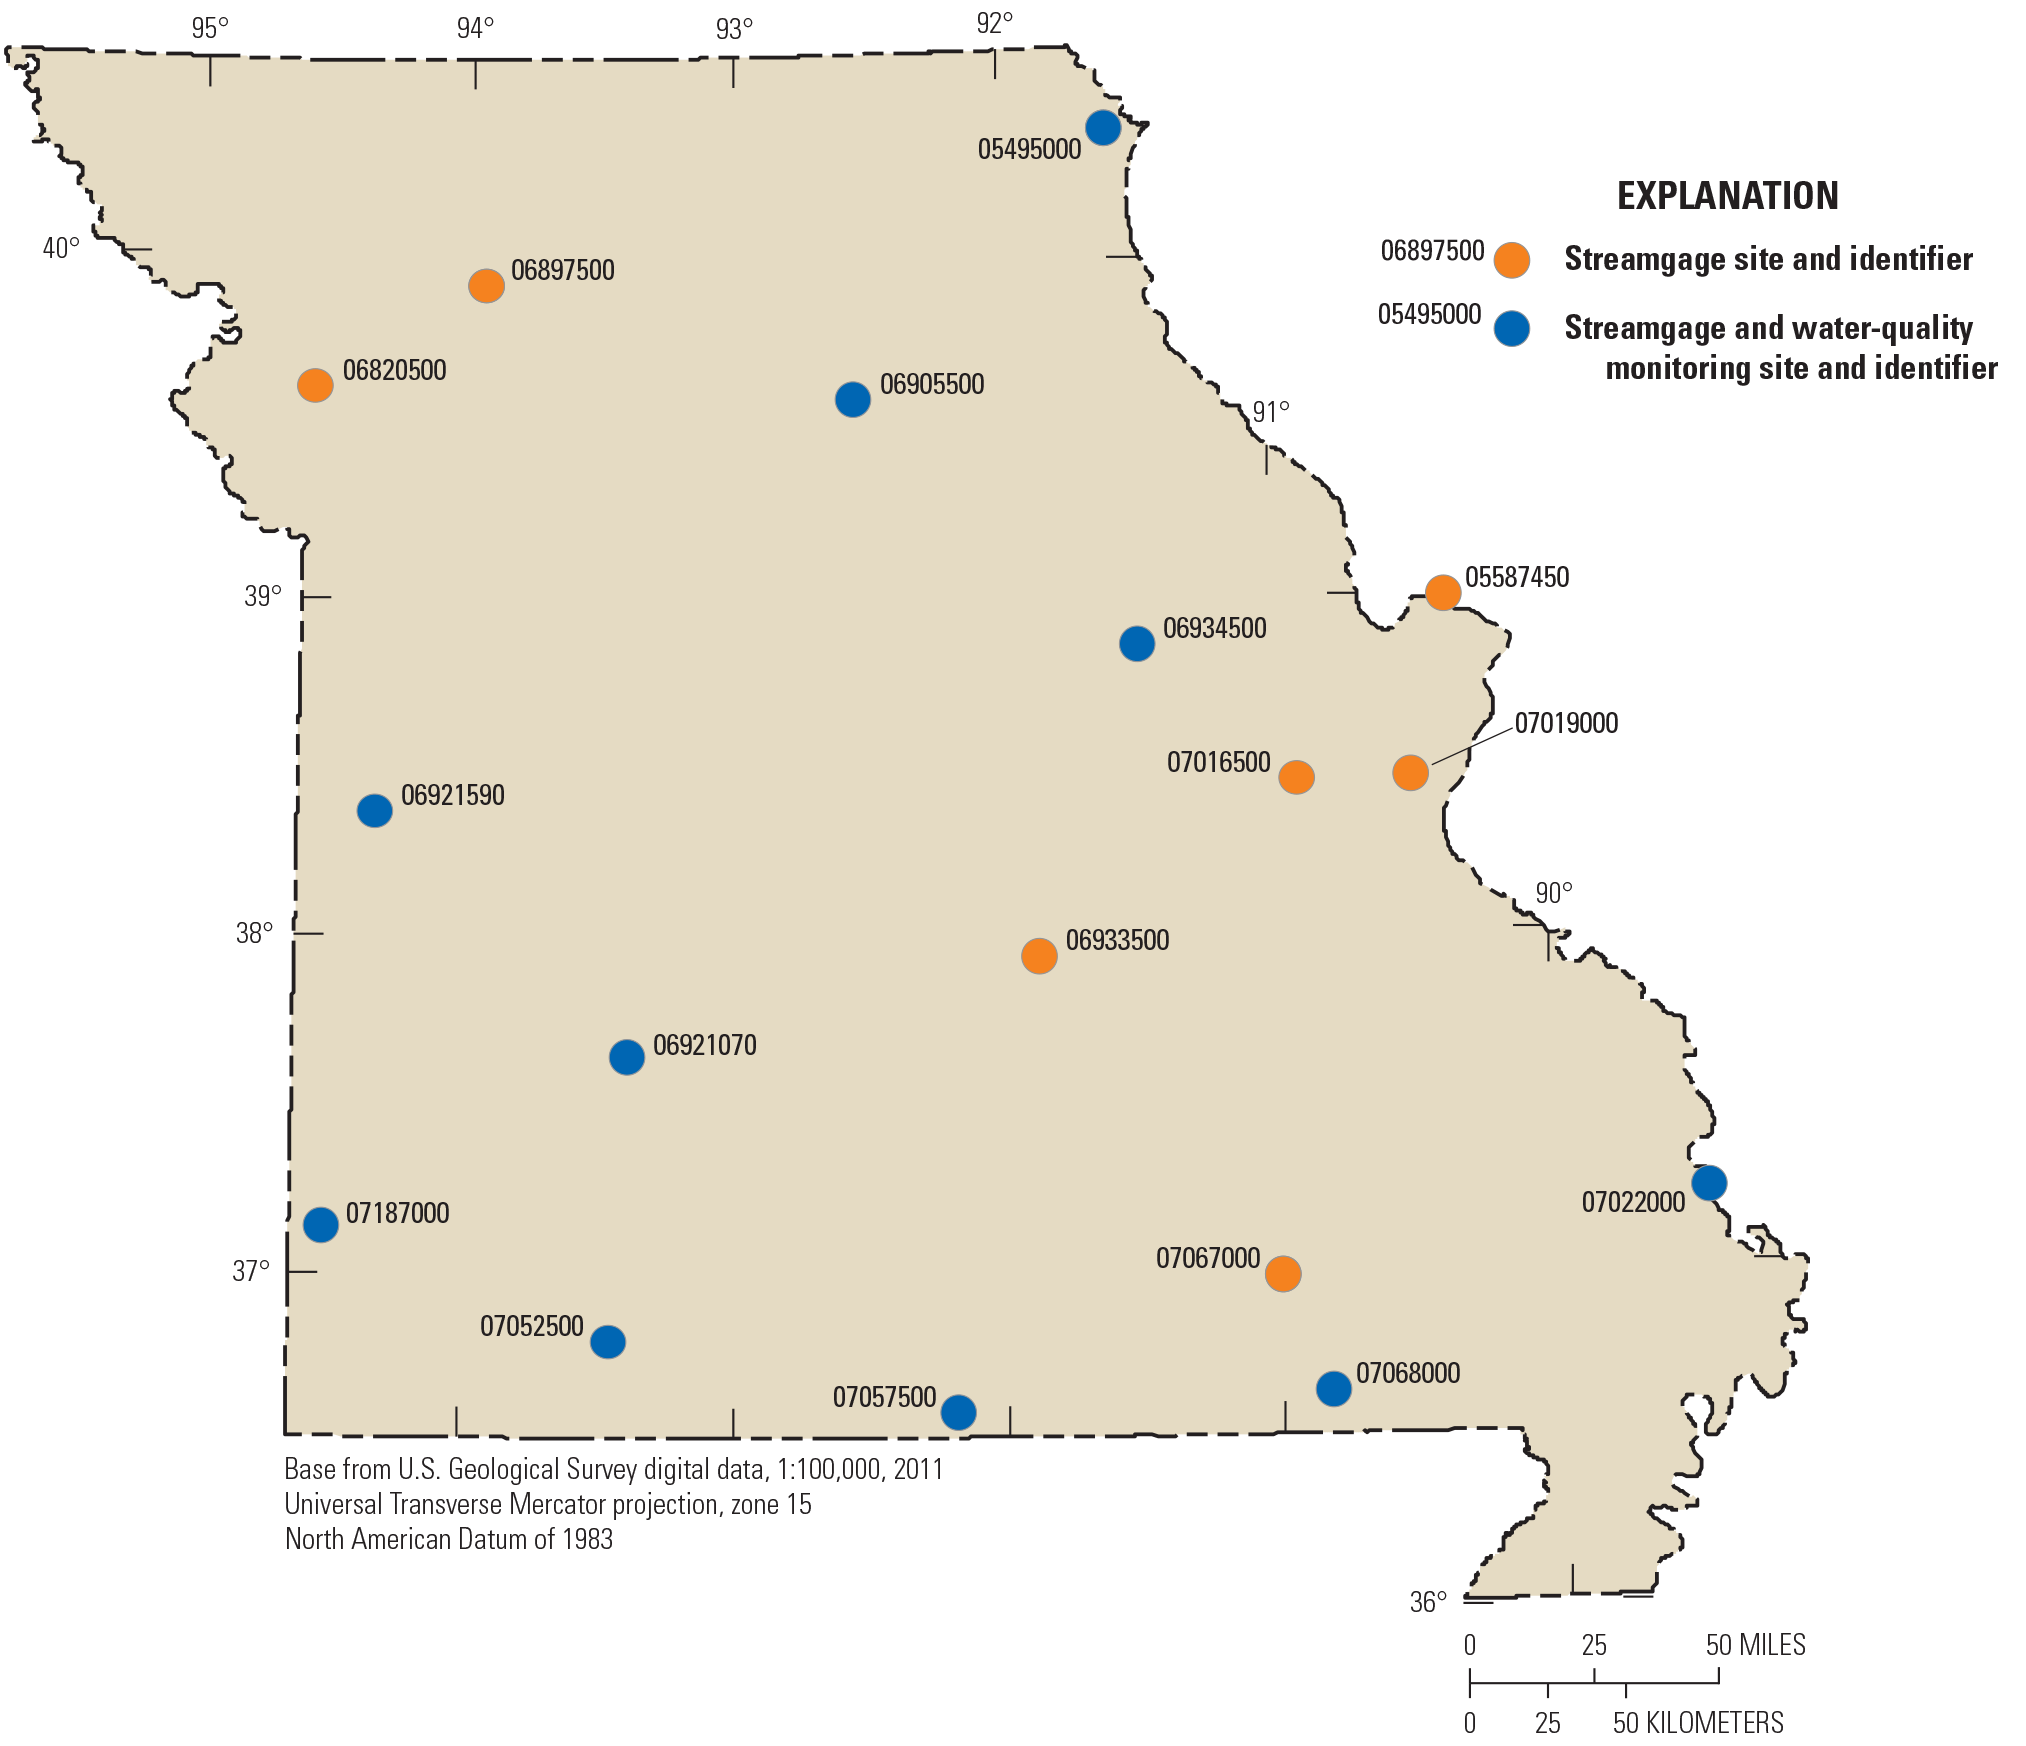
Location of selected streamgages used to provide a summary of hydrologic conditions in Missouri, water year 2021.
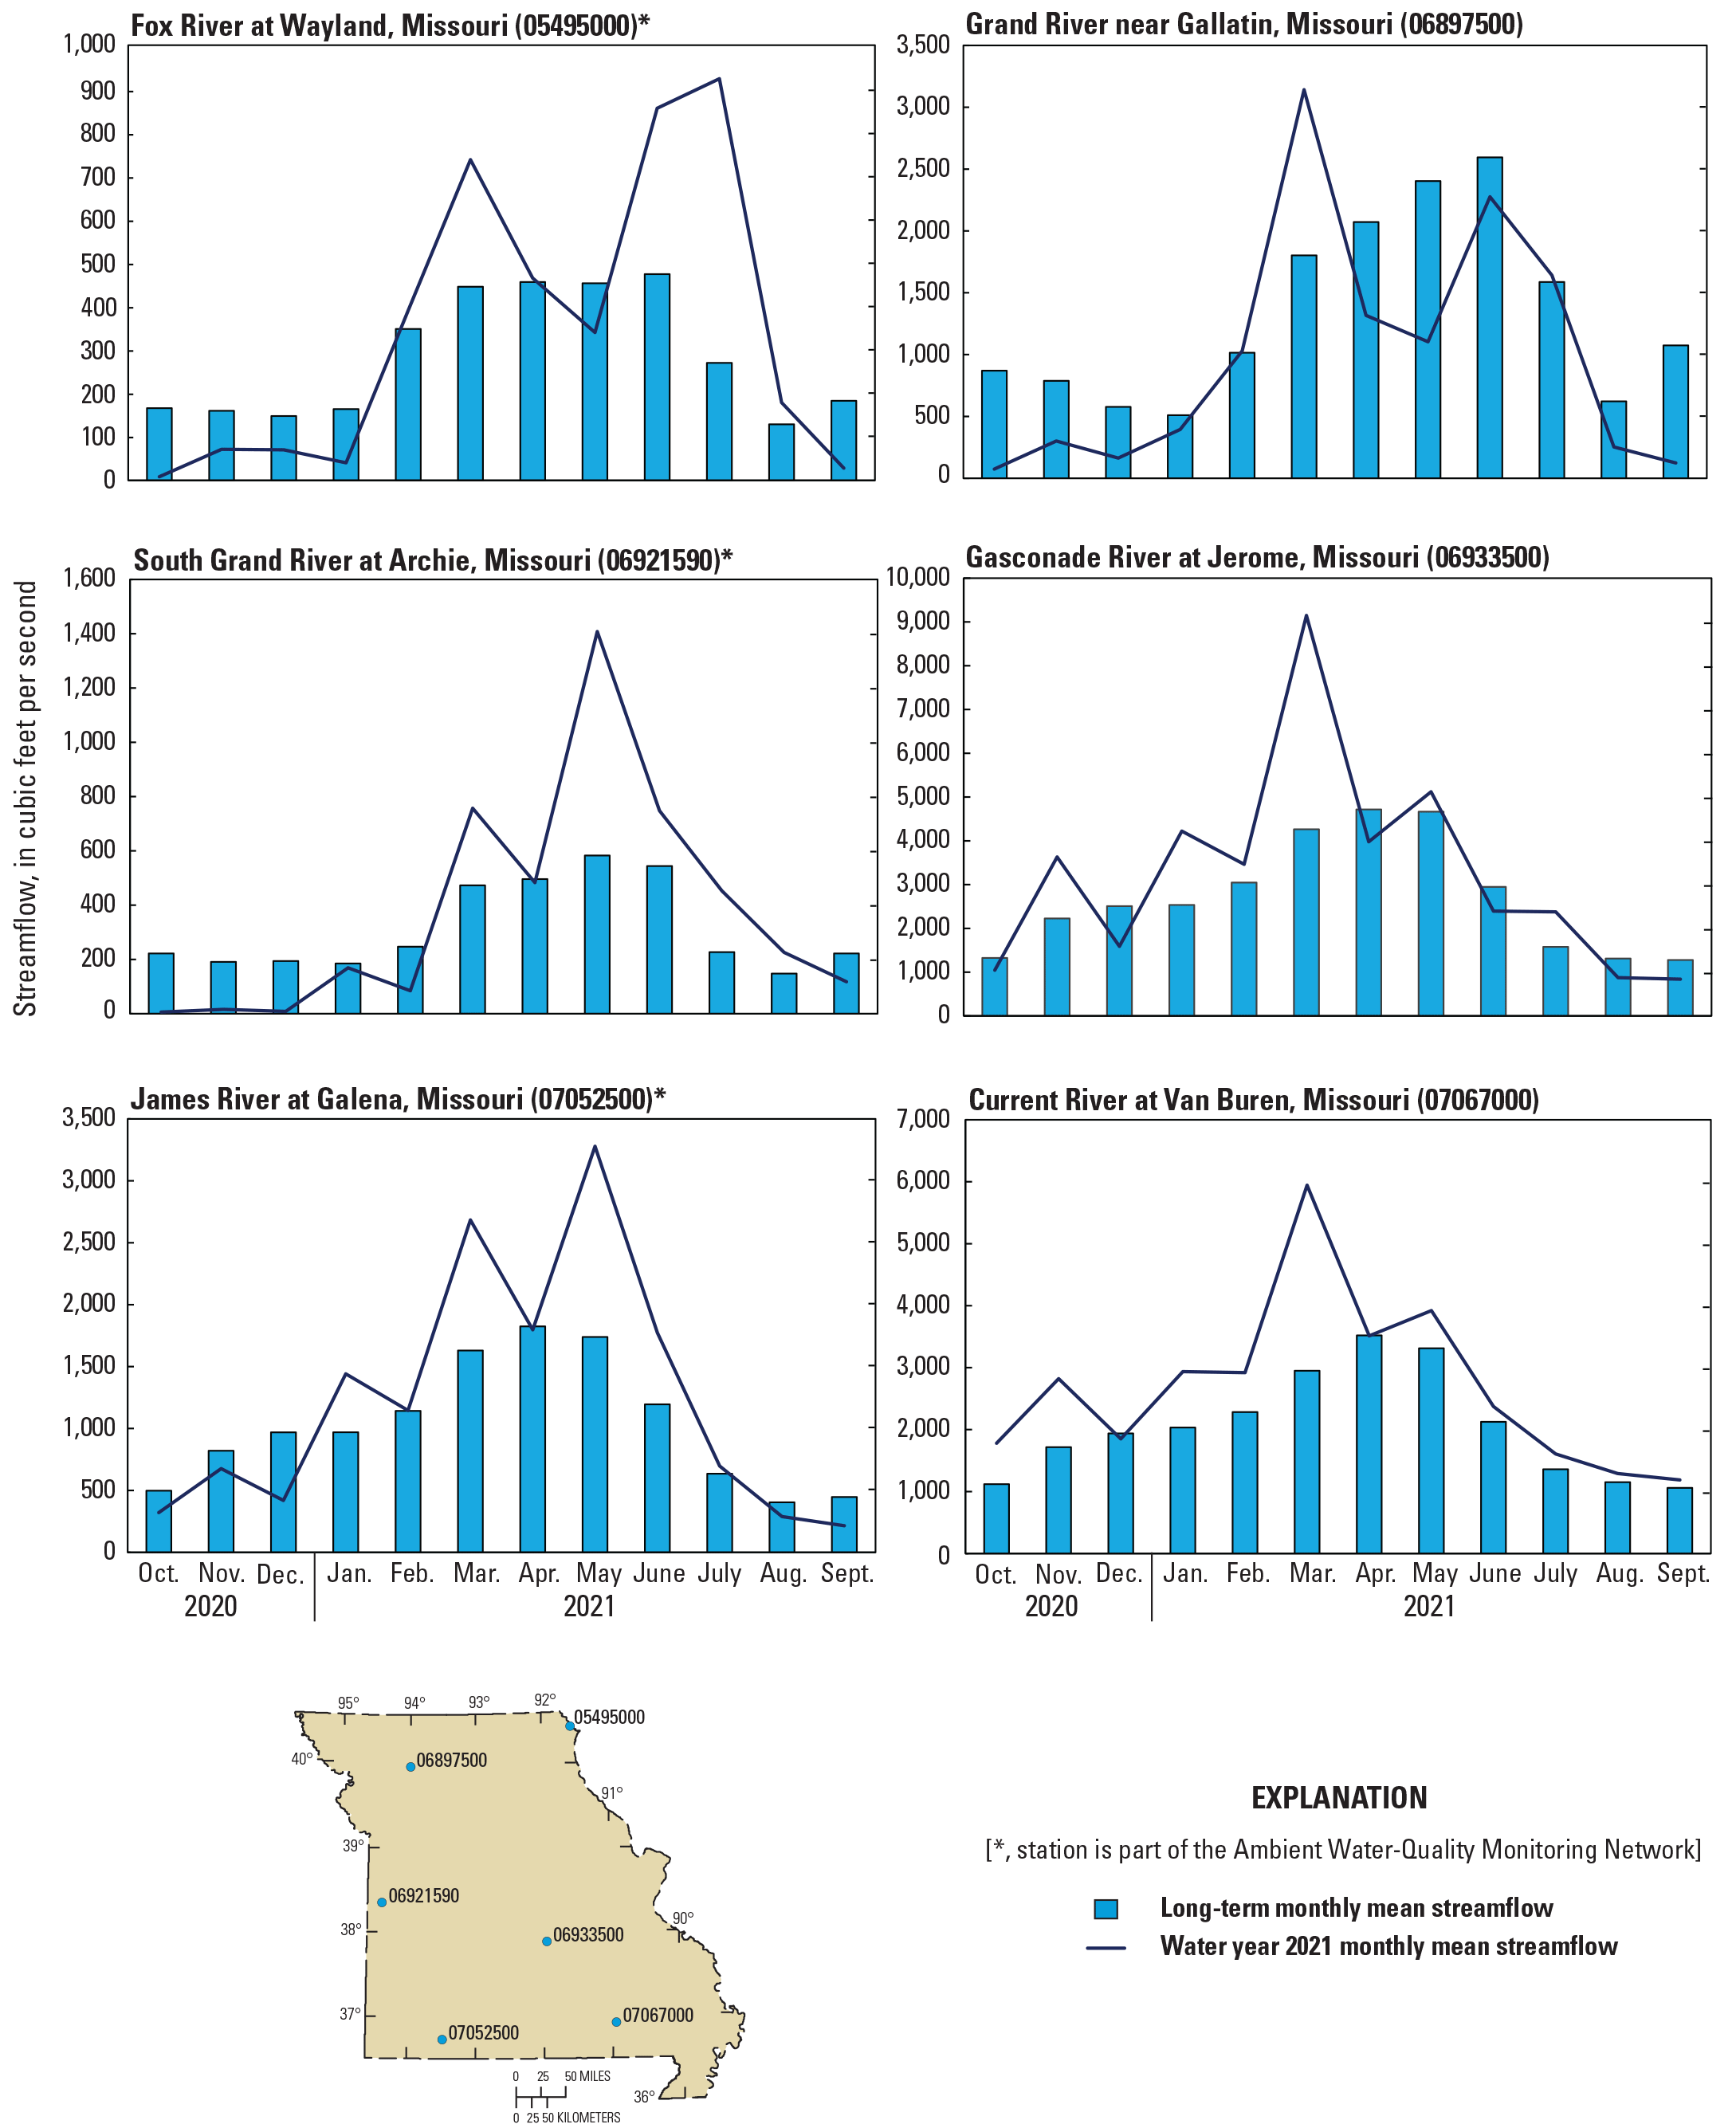
Monthly mean streamflow for water year 2021 and long-term monthly mean streamflow at six representative streamgages in Missouri.
Of these six streamgages, three (05495000, 06921590, and 07052500) are part of the AWQMN and three (06897500, 06933500, and 07067000) are not part of the AWQMN (table 1; figs. 3, 4). The water year 2021 monthly mean streamflow at station 05495000 exceeded the long-term monthly mean streamflow during 6 months of the water year, and the monthly mean streamflow in July was more than twice the long-term mean. For station 06897500, the water year 2021 monthly mean streamflow exceeded the long-term monthly mean streamflow during 3 months of the water year (February, March, and July). For station 06921590, the water year 2021 monthly mean streamflow exceeded the long-term monthly mean streamflow during 5 months of the water year, and the highest monthly mean streamflow for the year was recorded in May. The water year 2021 monthly mean streamflow exceeded the long-term monthly mean streamflow during 6 months of the water year at stations 06933500 and 07052500. For station 07067000, the water year 2021 monthly mean streamflow exceeded that of the long-term monthly mean streamflow for 10 months of the water year, and the highest monthly mean streamflow for the year was recorded in March (fig. 4).
All six streamgages exceeded their respective long-term monthly mean streamflows in the month of March. During the month of May, four of the six stations (06921590, 07052500, 06933500, and 07067000) exceeded their long-term monthly mean streamflows, and higher exceedances were in the western and southwestern regions of the State. The other two stations (05495000 and 06897500), which are both in the northern part of the State, had monthly mean streamflows below their long-term mean streamflows during the month of May.
Peak streamflow and 7-day low flow values (the smallest values of mean streamflow computed during any 7 consecutive days during the analysis period) for selected streamgages are provided in tables 3 and 4, respectively, for water year 2021. These tables include information on historical hydrologic conditions at the stations to provide context for the 2021 data. Peak streamflow during water year 2021 was less than the long-term period of record peak streamflow at every streamgage (table 3). The 7-day low flow and minimum daily mean streamflow recorded during water year 2021 were greater than the historical records for every station (table 4).
Table 3.
Peak streamflow for water year 2021 and periods of record for selected streamgages in Missouri.[Water year 2021 is defined as October 1, 2020, through September 30, 2021. USGS, U.S. Geological Survey; ft3/s, cubic foot per second; n/a, not available]
| USGS station numbera (figs. 1 and 3) |
Station nameb (period of record in years) |
Water year 2021 | Long-term period of record | ||
|---|---|---|---|---|---|
| Peak streamflow (ft3/s) | Date | Peak streamflow (ft3/s) | Date | ||
| 05495000 | Fox River at Wayland, Missouri (1922–2021) | 8,390 | July 12, 2021 | 26,400 | Apr. 22, 1973 |
| 05587450 | Mississippi River at Grafton, Illinois (1987–2021) | 282,000 | Apr. 14, 2021 | 598,000 | Aug. 1, 1993 |
| 06905500 | Chariton River near Prairie Hill, Missouri (1929–2021) | n/a | n/a | 44,400 | May 31, 2019 |
| 06933500 | Gasconade River at Jerome, Missouri (1903–2021) | 38,800 | Mar. 14, 2021 | 197,000 | May 1, 2017 |
| 06934500 | Missouri River at Hermann, Missouri (1958–2021) | 316,000 | June 29, 2021 | 750,000 | July 31, 1993 |
| 07019000 | Meramec River near Eureka, Missouri (1904–2021) | 31,700 | Mar. 20, 2021 | 175,000 | Aug. 22, 1915 |
| 07022000 | Mississippi River at Thebes, Illinois (1933–2021) | 624,000 | Mar. 22, 2021 | 1,050,000 | Jan. 2, 2016 |
| 07057500 | North Fork River near Tecumseh, Missouri (1945–2021) | 6,180 | Jan. 26, 2021 | 189,000 | Apr. 30, 2017 |
| 07068000 | Current River at Doniphan, Missouri (1921–2021) | 27,800 | Mar. 15, 2021 | 183,000 | May 1, 2017 |
Stations 05587450, 06933500, and 07019000 are streamgages only and are not part of the Ambient Water-Quality Monitoring Network.
Station names were obtained from the USGS National Water Information System database (U.S. Geological Survey, 2022).
Table 4.
The 7-day low flow for water year 2021, period of record 7-day low flow, minimum daily mean streamflow for water year 2021, and period of record minimum daily mean streamflow for selected streamgages in Missouri.[Water year 2021 is defined as October 1, 2020, through September 30, 2021. USGS, U.S. Geological Survey; ft3/s, cubic foot per second]
| USGS station numbera (figs. 1 and 3) | Station nameb (period of record in years) |
7-day low flow (ft3/s) |
Minimum daily mean streamflow (ft3/s) | ||||
|---|---|---|---|---|---|---|---|
| Water year 2021 | Period of record | Water year 2021 | Period of record | Date | |||
| 05495000 | Fox River at Wayland, Missouri (1922–2021) | 1.72 | 0 | 1.07 | 0 | Sept. 10, 1930 | |
| 06820500 | Platte River near Agency, Missouri (1925–2021) | 22.9 | 0 | 18.7 | 0 | July 19, 1934 | |
| 06921070 | Pomme de Terre River near Polk, Missouri (1969–2021) | 5.96 | 0.211 | 5.44 | 0.17 | Aug. 13, 2012 | |
| 07016500 | Bourbeuse River at Union, Missouri (1921–2021) | 48.7 | 13.0 | 48.0 | 12.0 | Oct. 10, 1956 | |
| 07067000 | Current River at Van Buren, Missouri (1921–2021) | 1,121 | 479 | 1,110 | 476 | Oct. 8, 1956 | |
| 07187000 | Shoal Creek above Joplin, Missouri (1941–2021) | 91.7 | 15.9 | 90.9 | 15.0 | Sept. 7, 1954 | |
Stations 06820500, 07016500, and 07067000 are streamgages only and are not part of the Ambient Water-Quality Monitoring Network.
Station names were obtained from the USGS National Water Information System database (U.S. Geological Survey, 2022).
Distribution, Concentration, and Detection Frequency of Selected Constituents
This report presents results for dissolved oxygen, specific conductance, water temperature, suspended solids, suspended sediment, E. coli bacteria, fecal coliform bacteria, dissolved nitrate plus nitrite as nitrogen (hereafter referred to as “nitrate plus nitrite”), total phosphorus, dissolved and total recoverable lead and zinc, and selected pesticide compounds. Boxplots of these constituents excluding selected pesticide compounds are shown in figures 5–8 for the surface-water stations according to their classification.
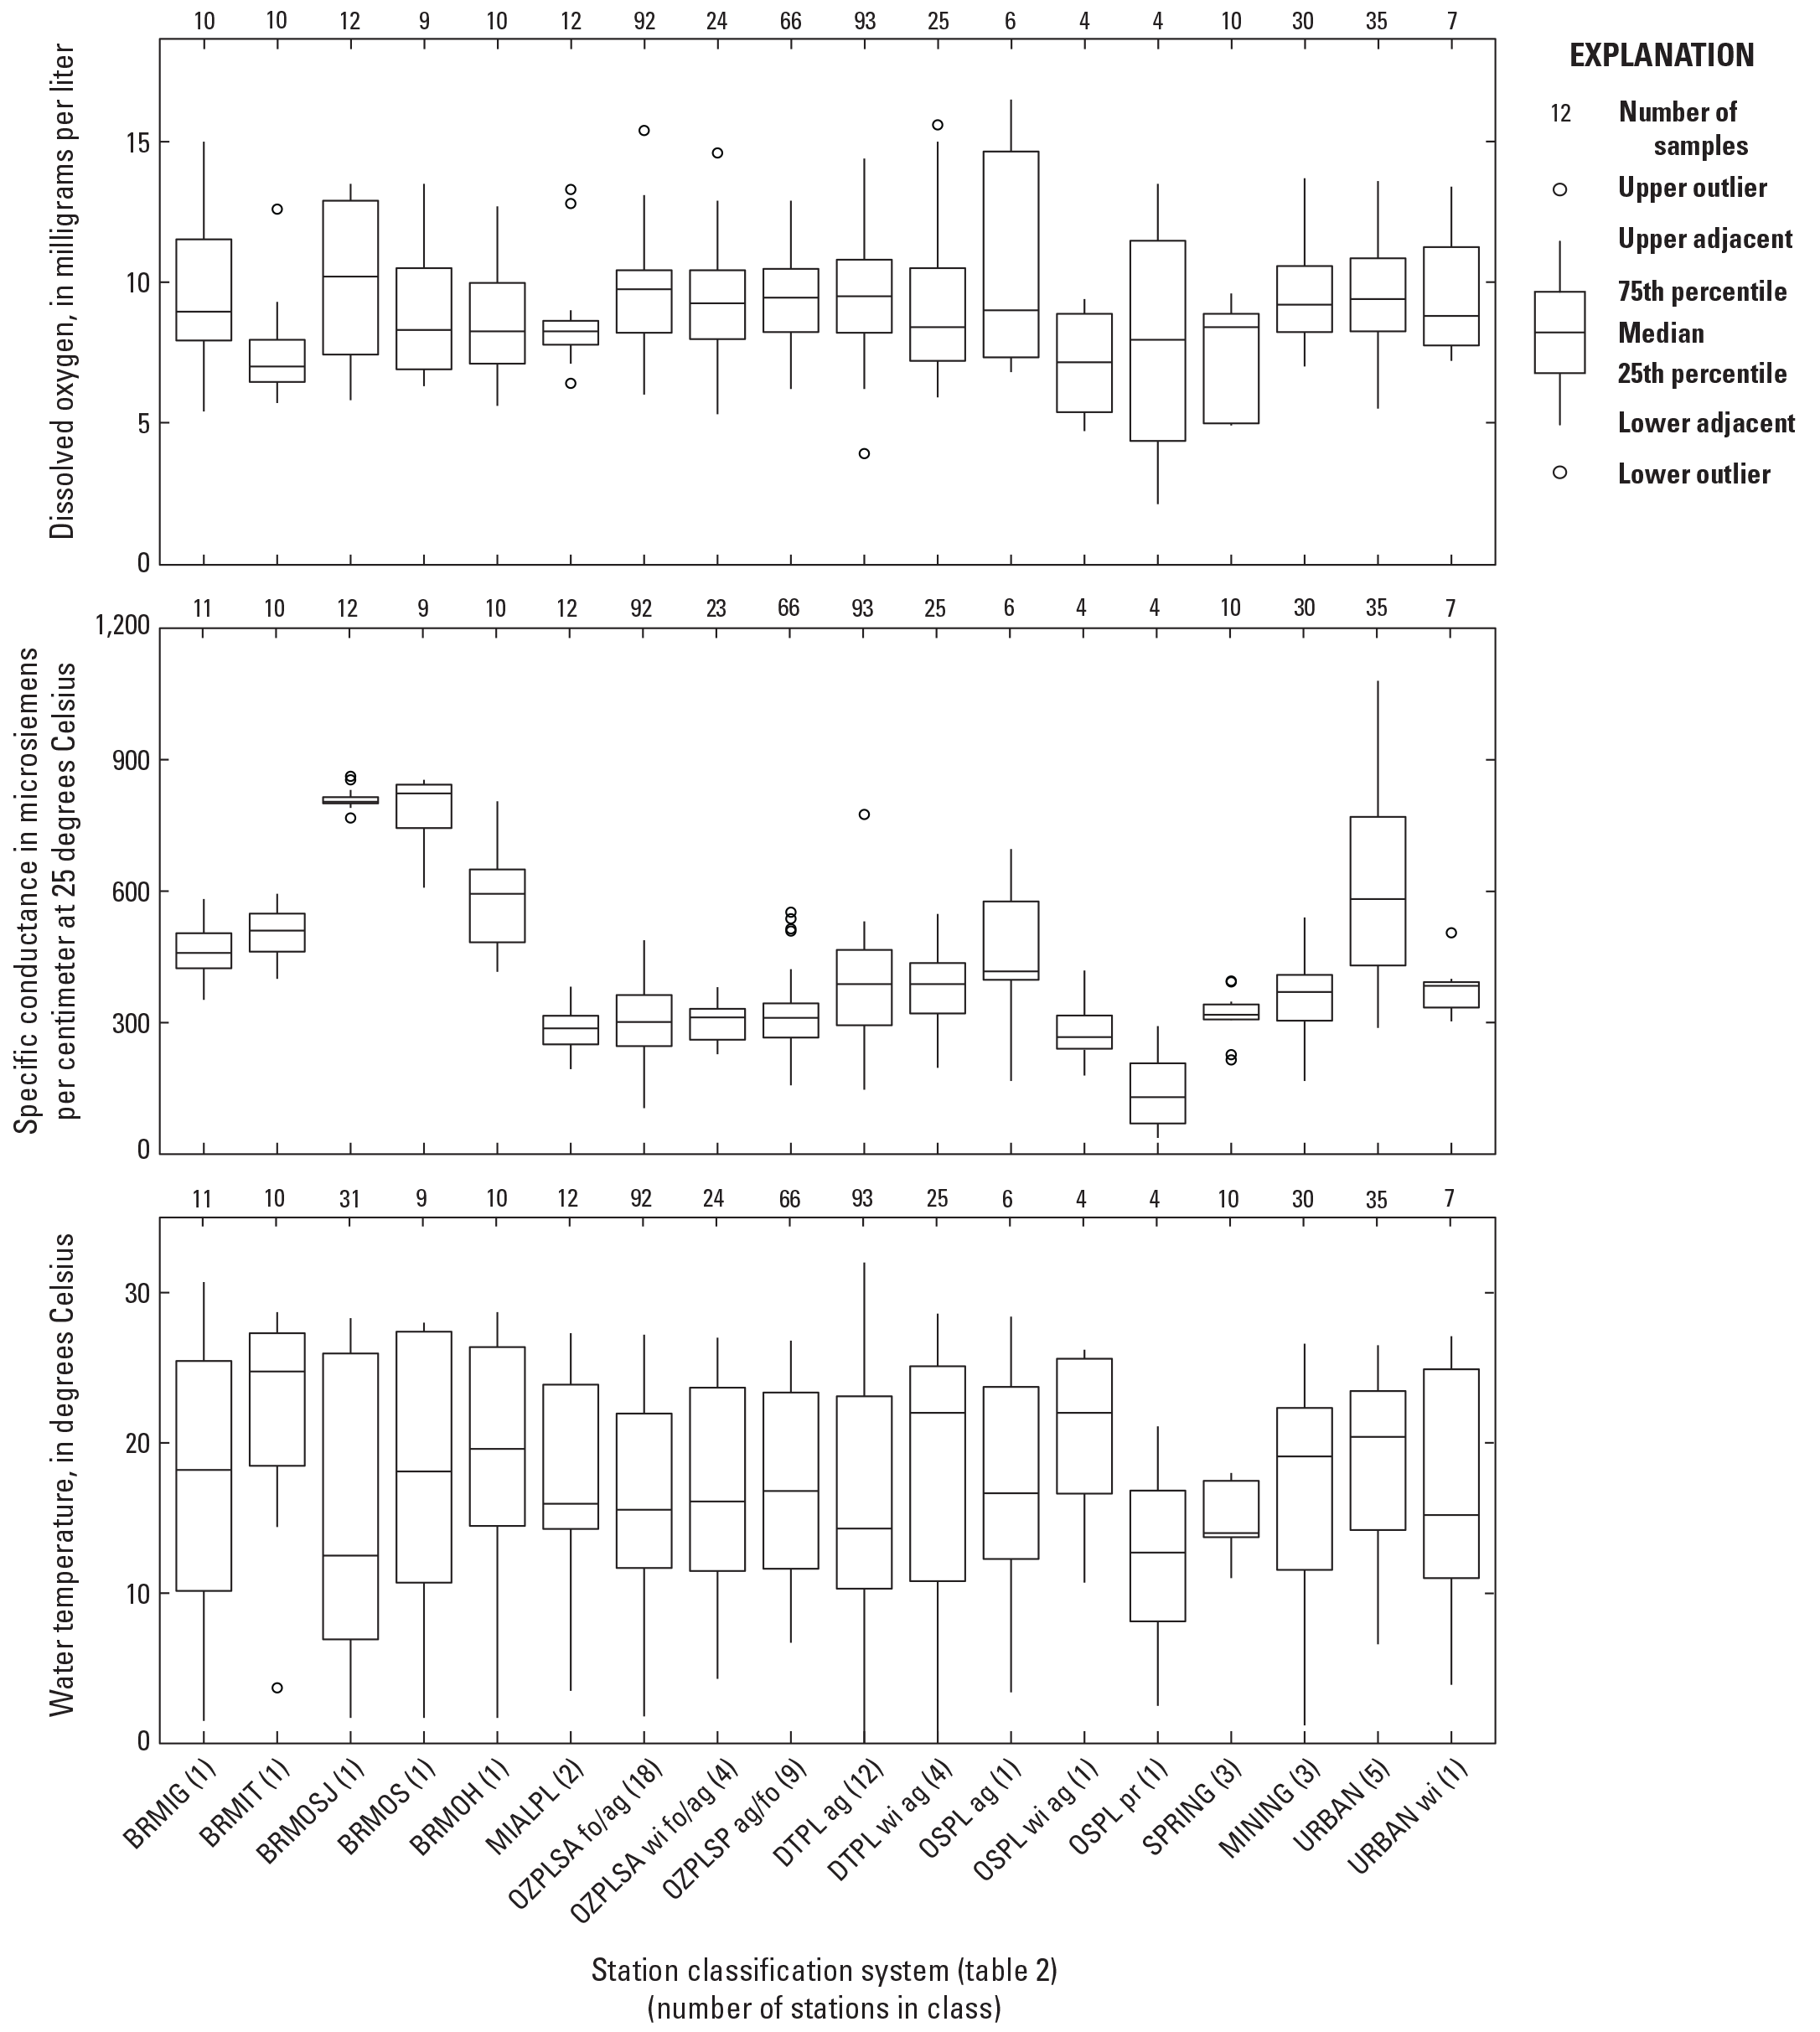
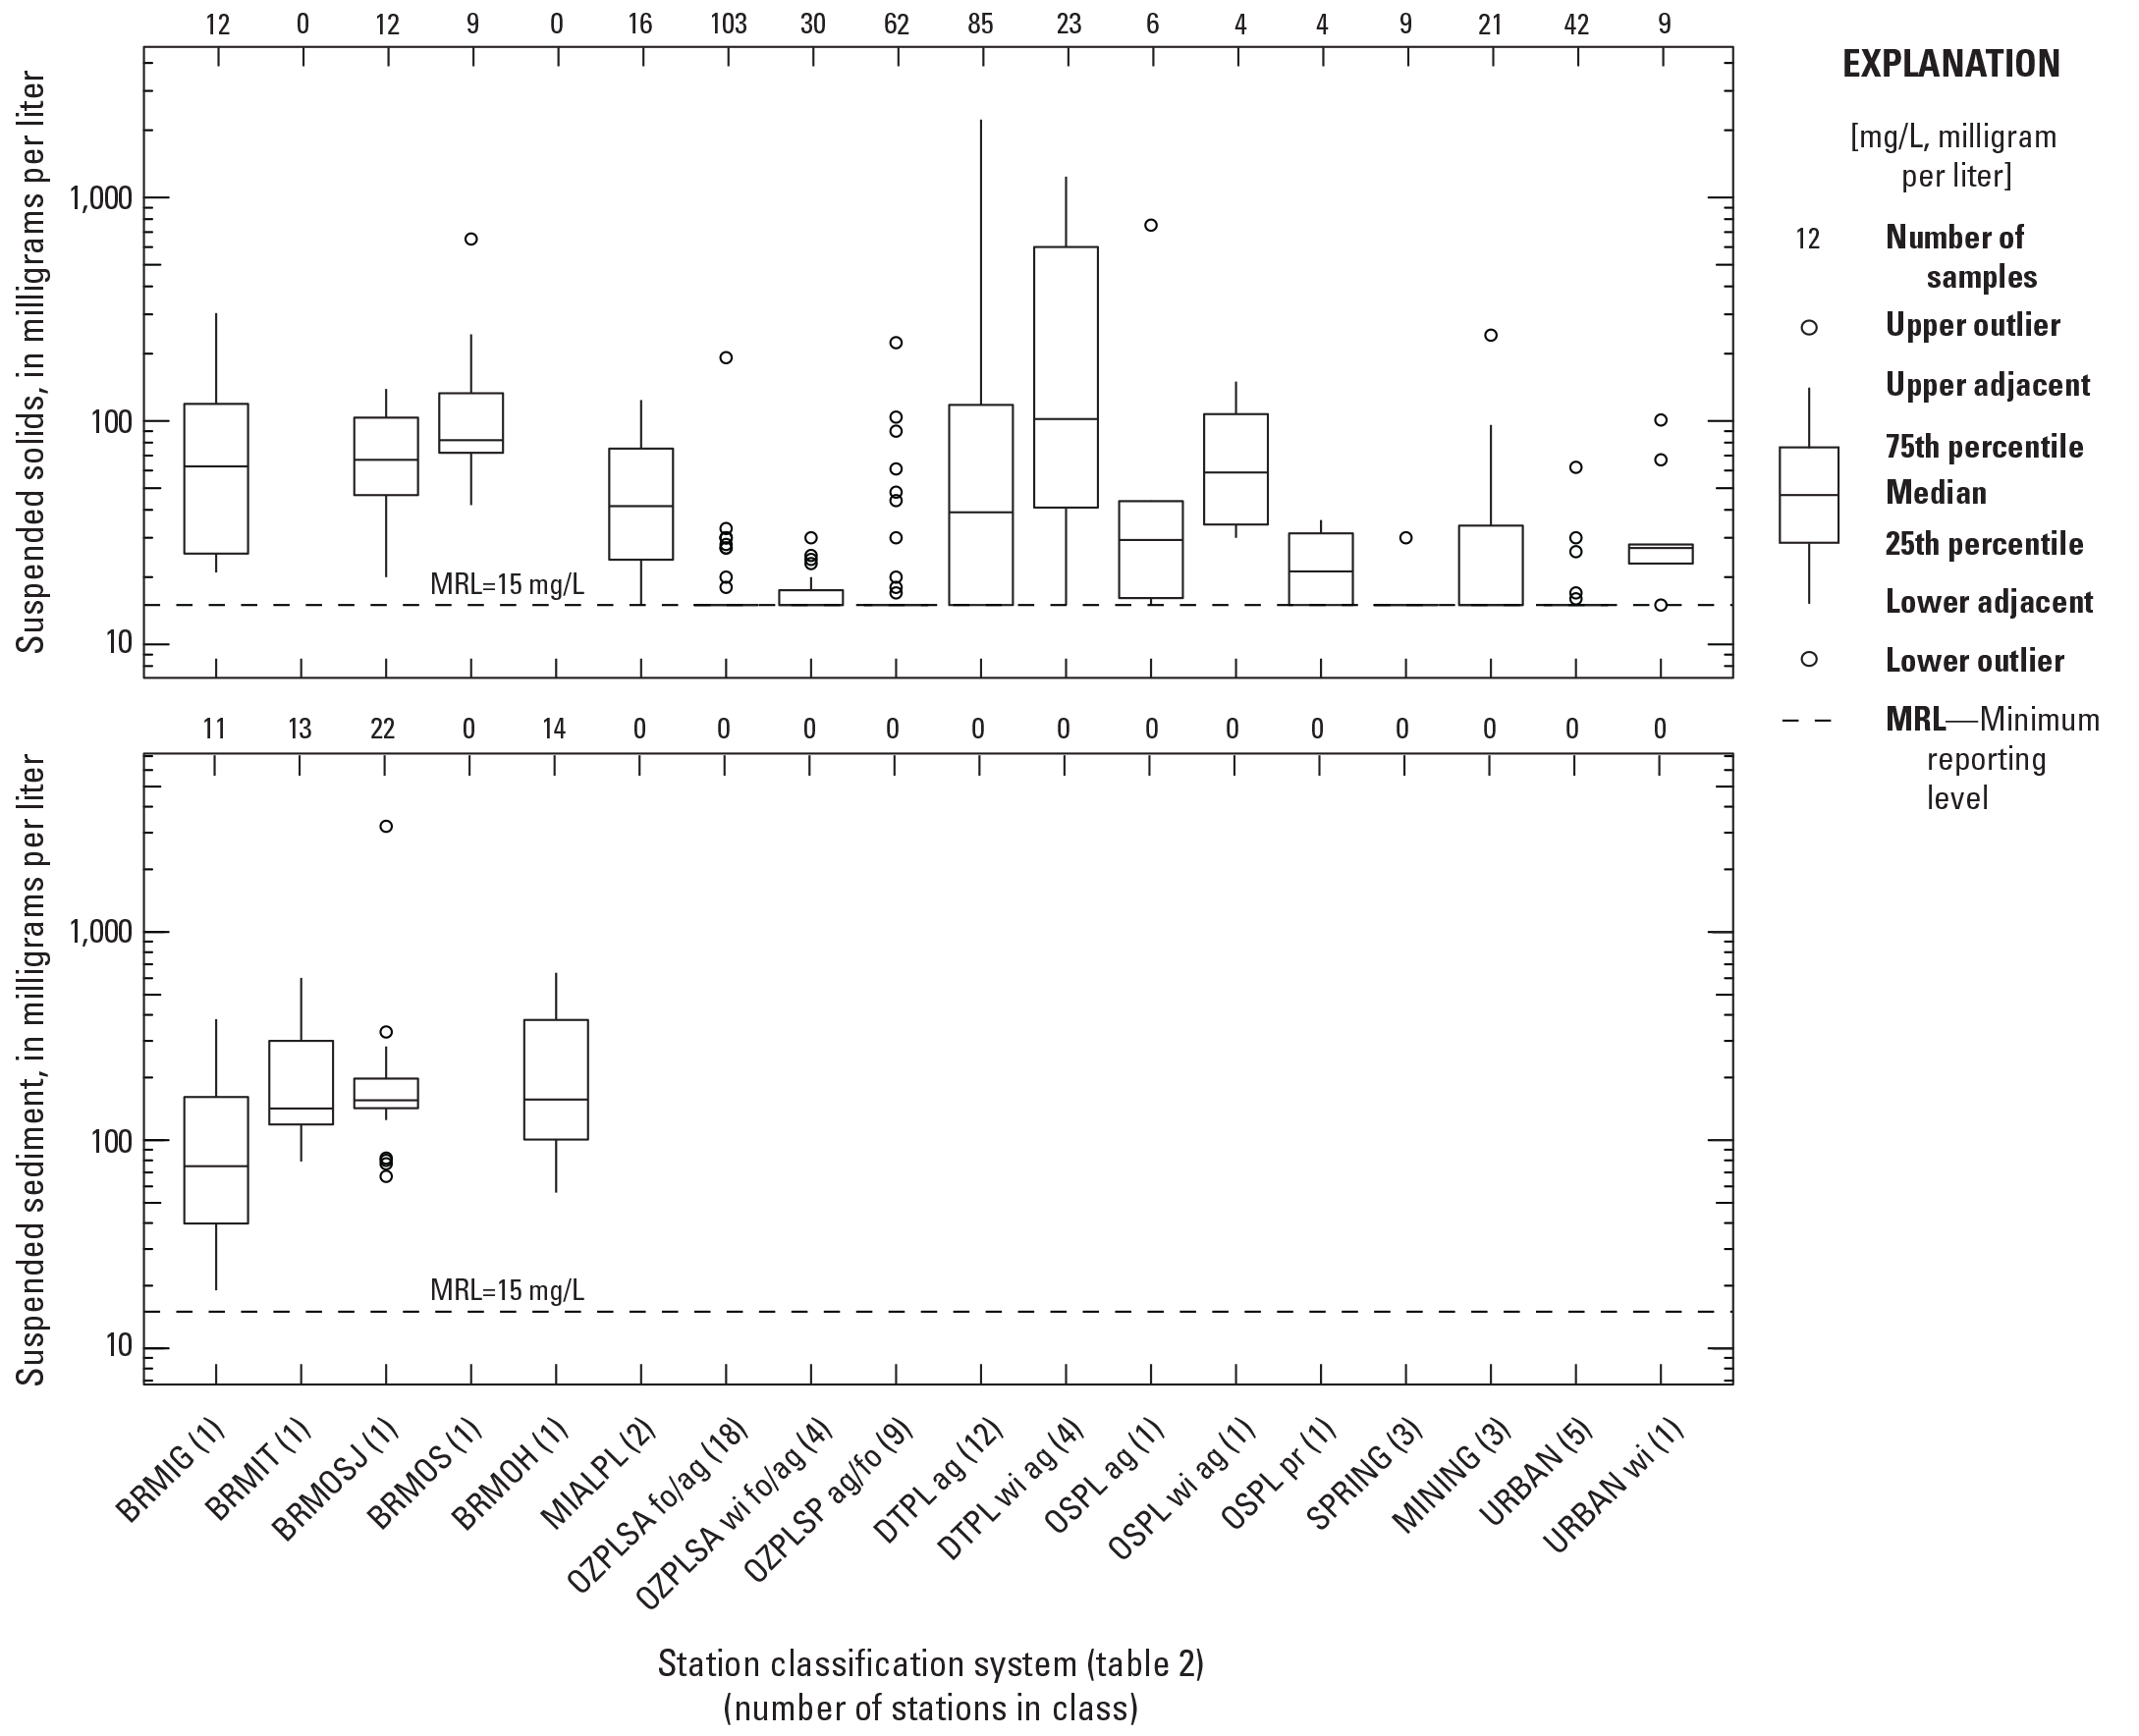
Distribution of dissolved oxygen, specific conductance, water temperature, suspended-solids concentrations, and suspended-sediment concentrations from surface-water-quality stations in Missouri, water year 2021.
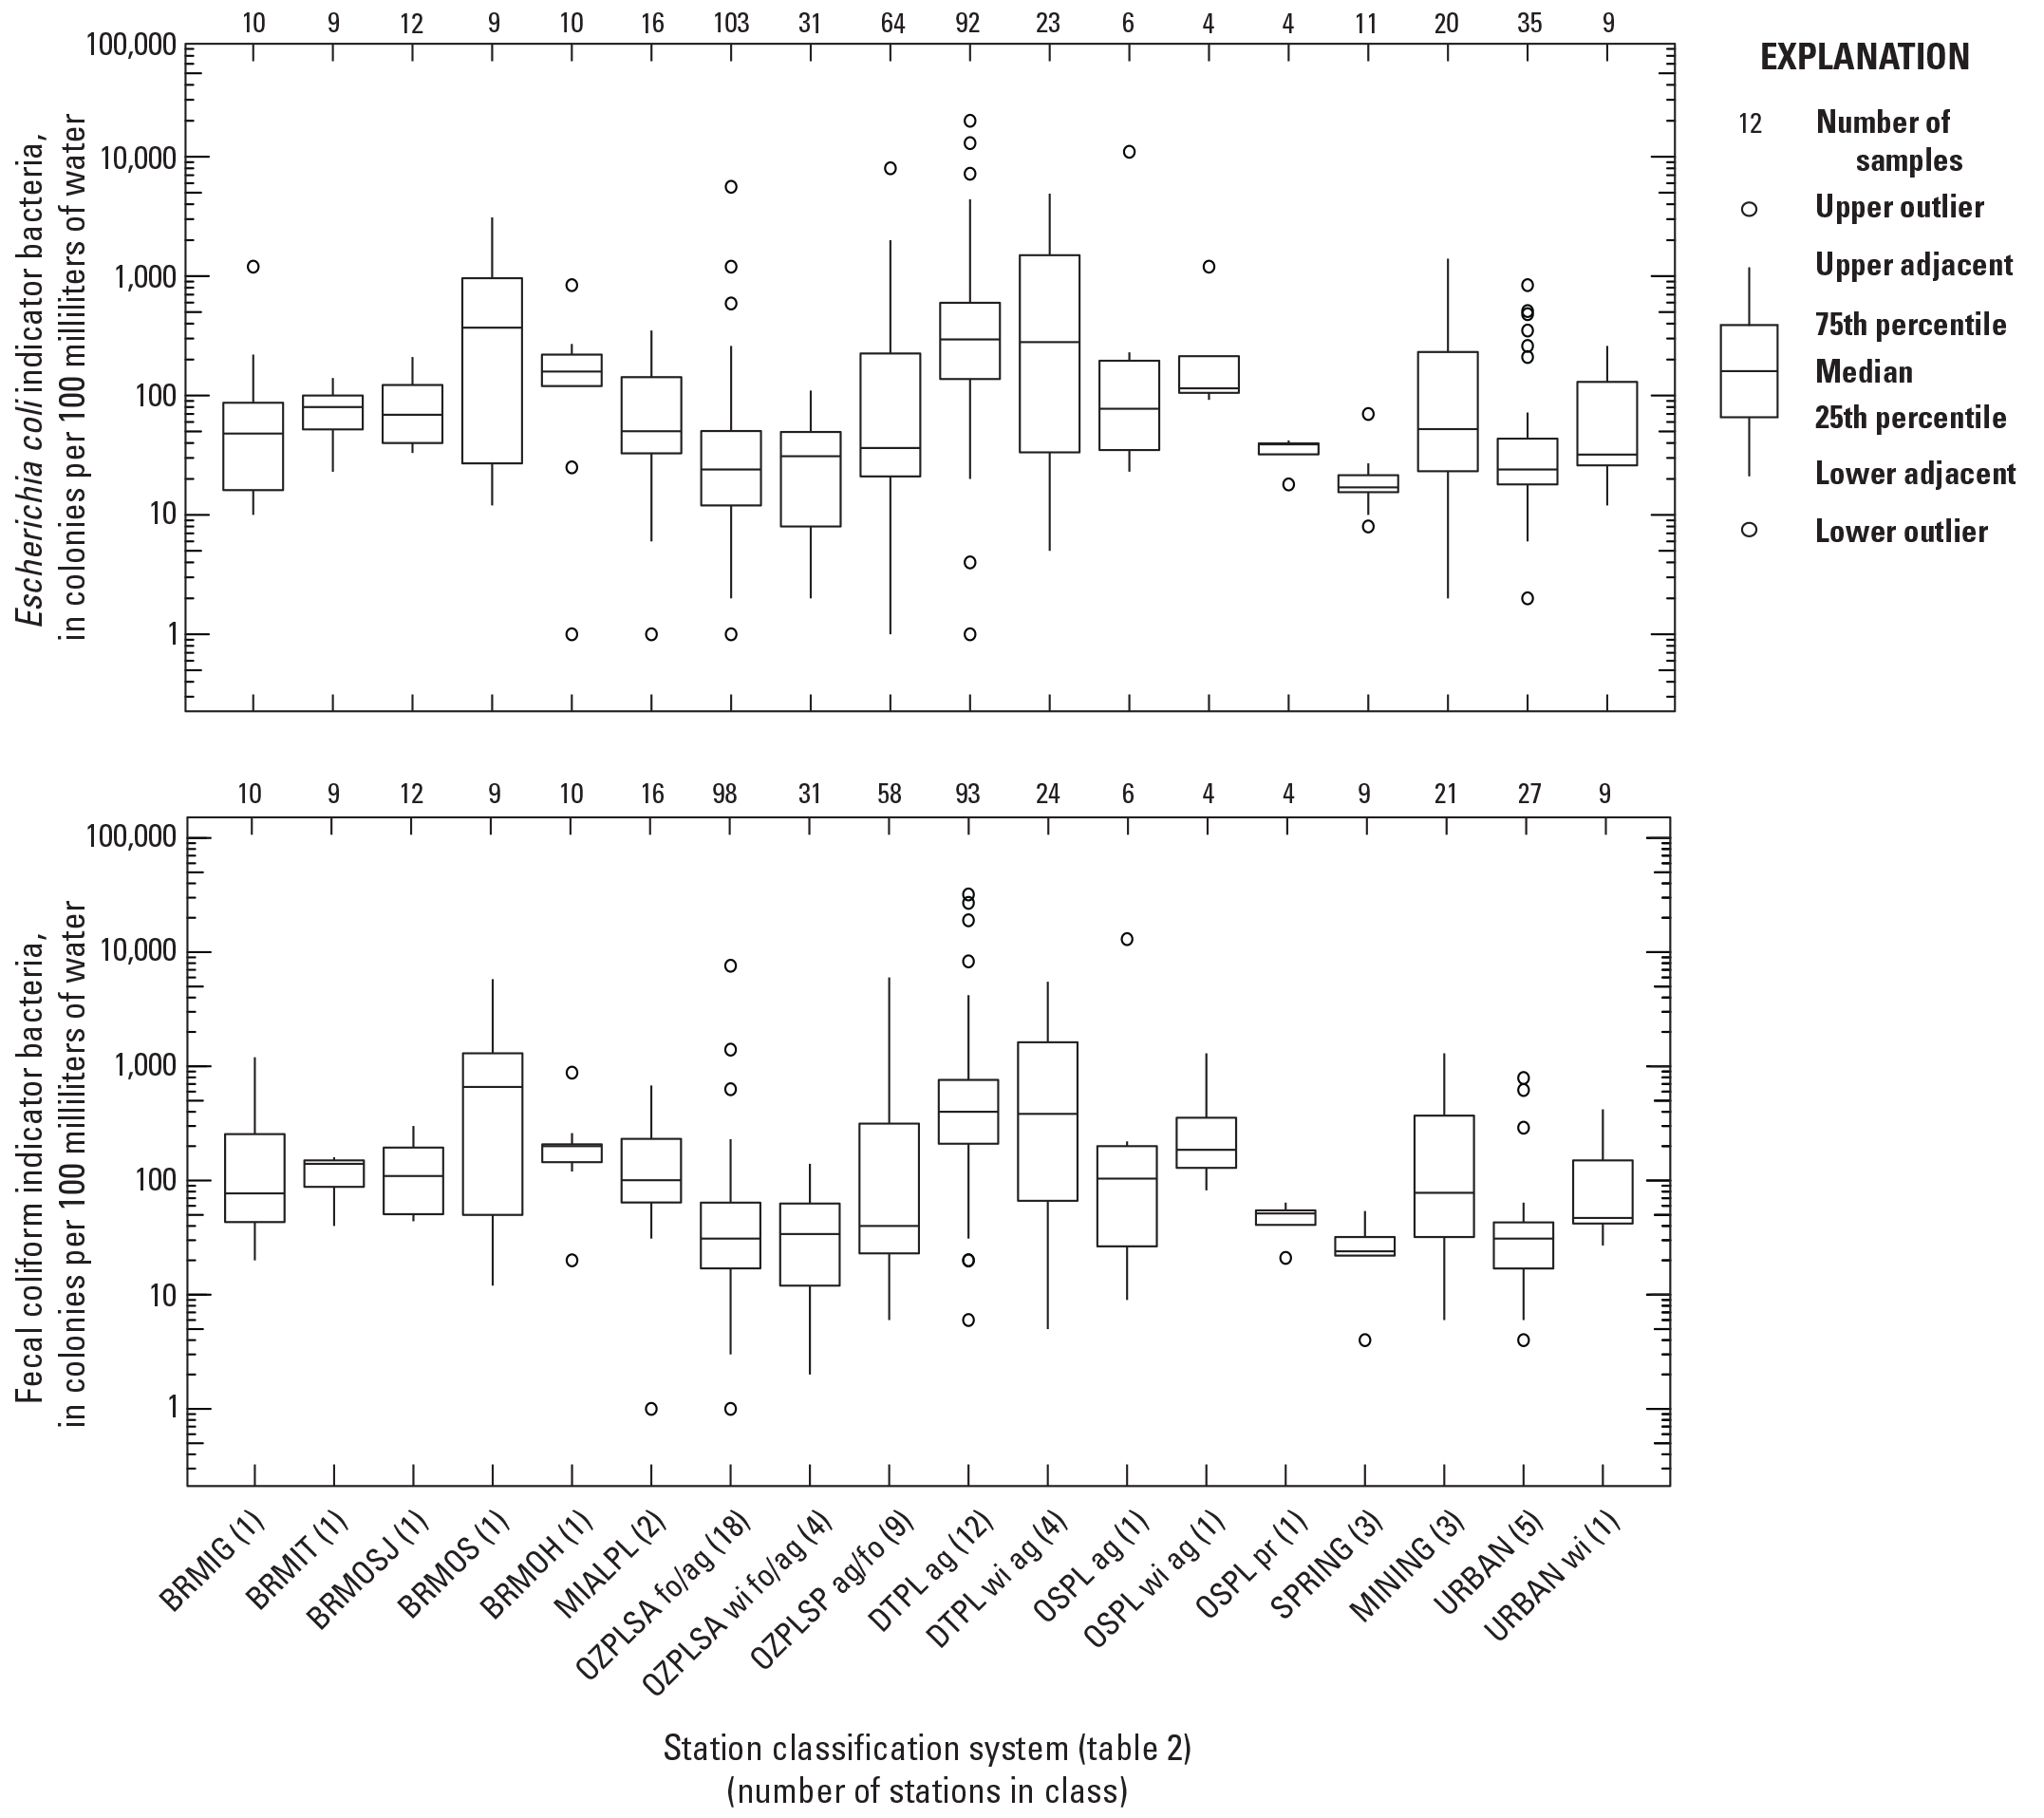
Distribution of fecal indicator bacteria density in samples from surface-water-quality stations in Missouri, water year 2021.
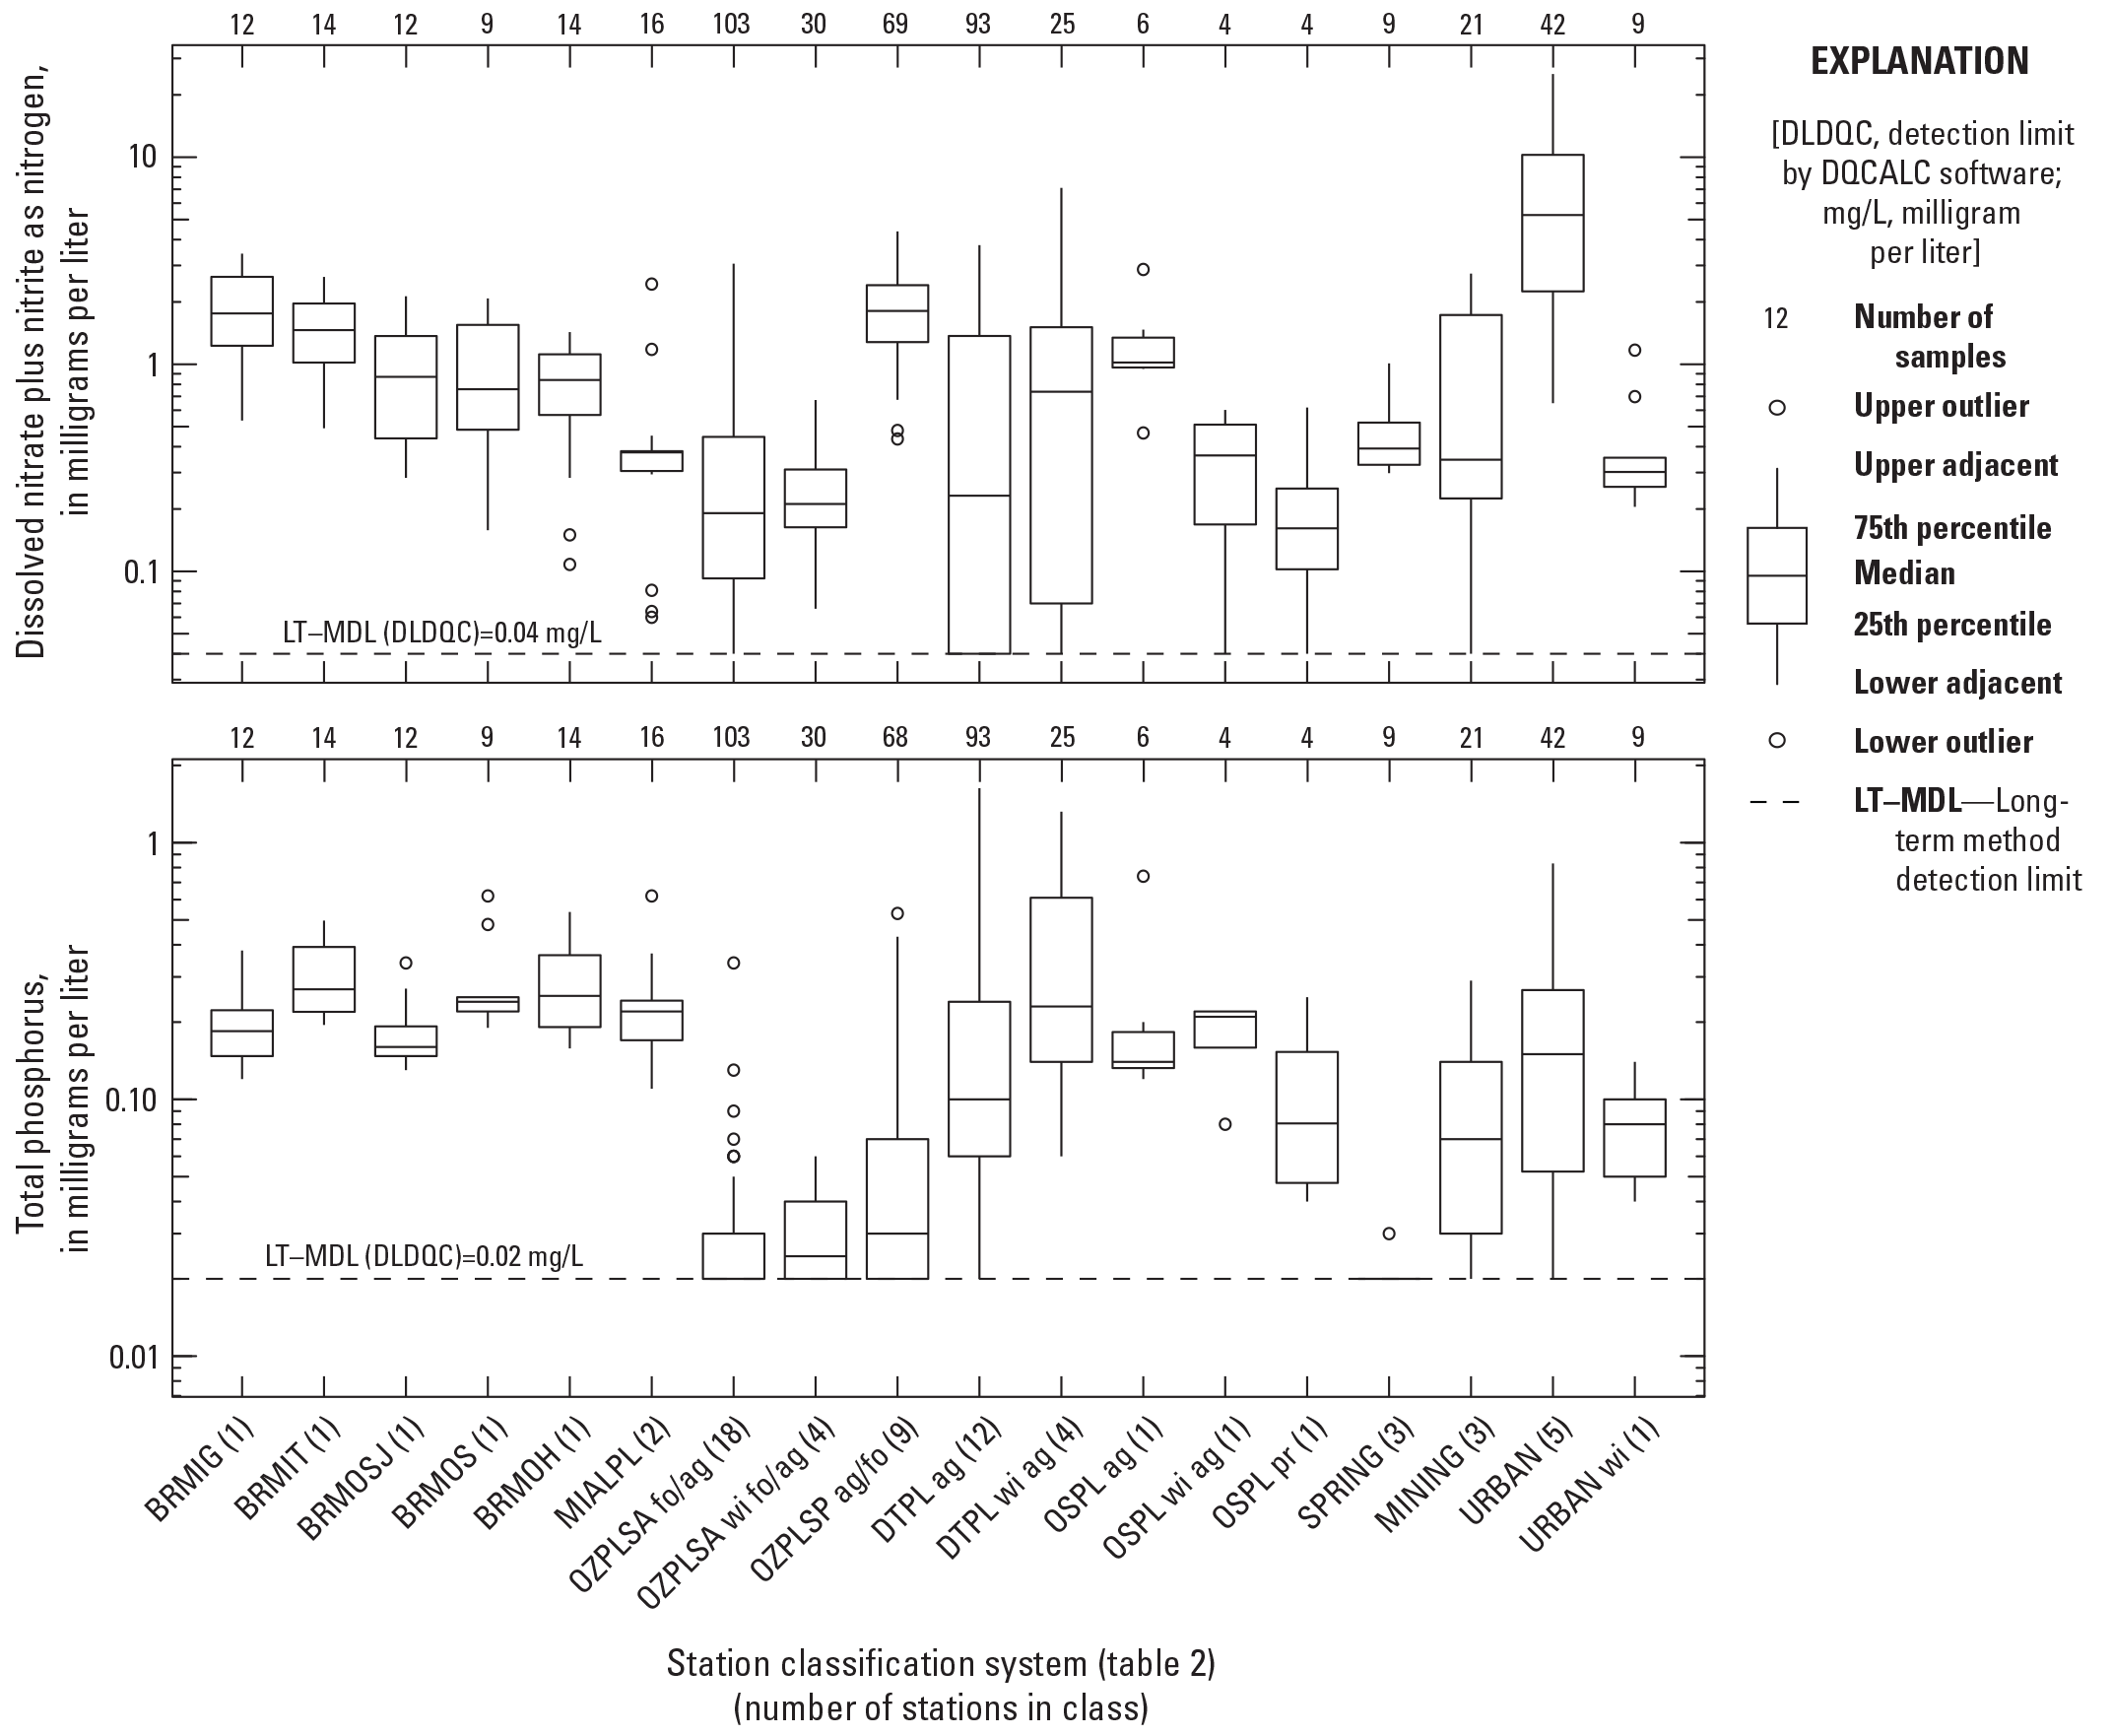
Distribution of dissolved nitrate plus nitrite as nitrogen and total phosphorus concentrations in samples from surface-water-quality stations in Missouri, water year 2021.
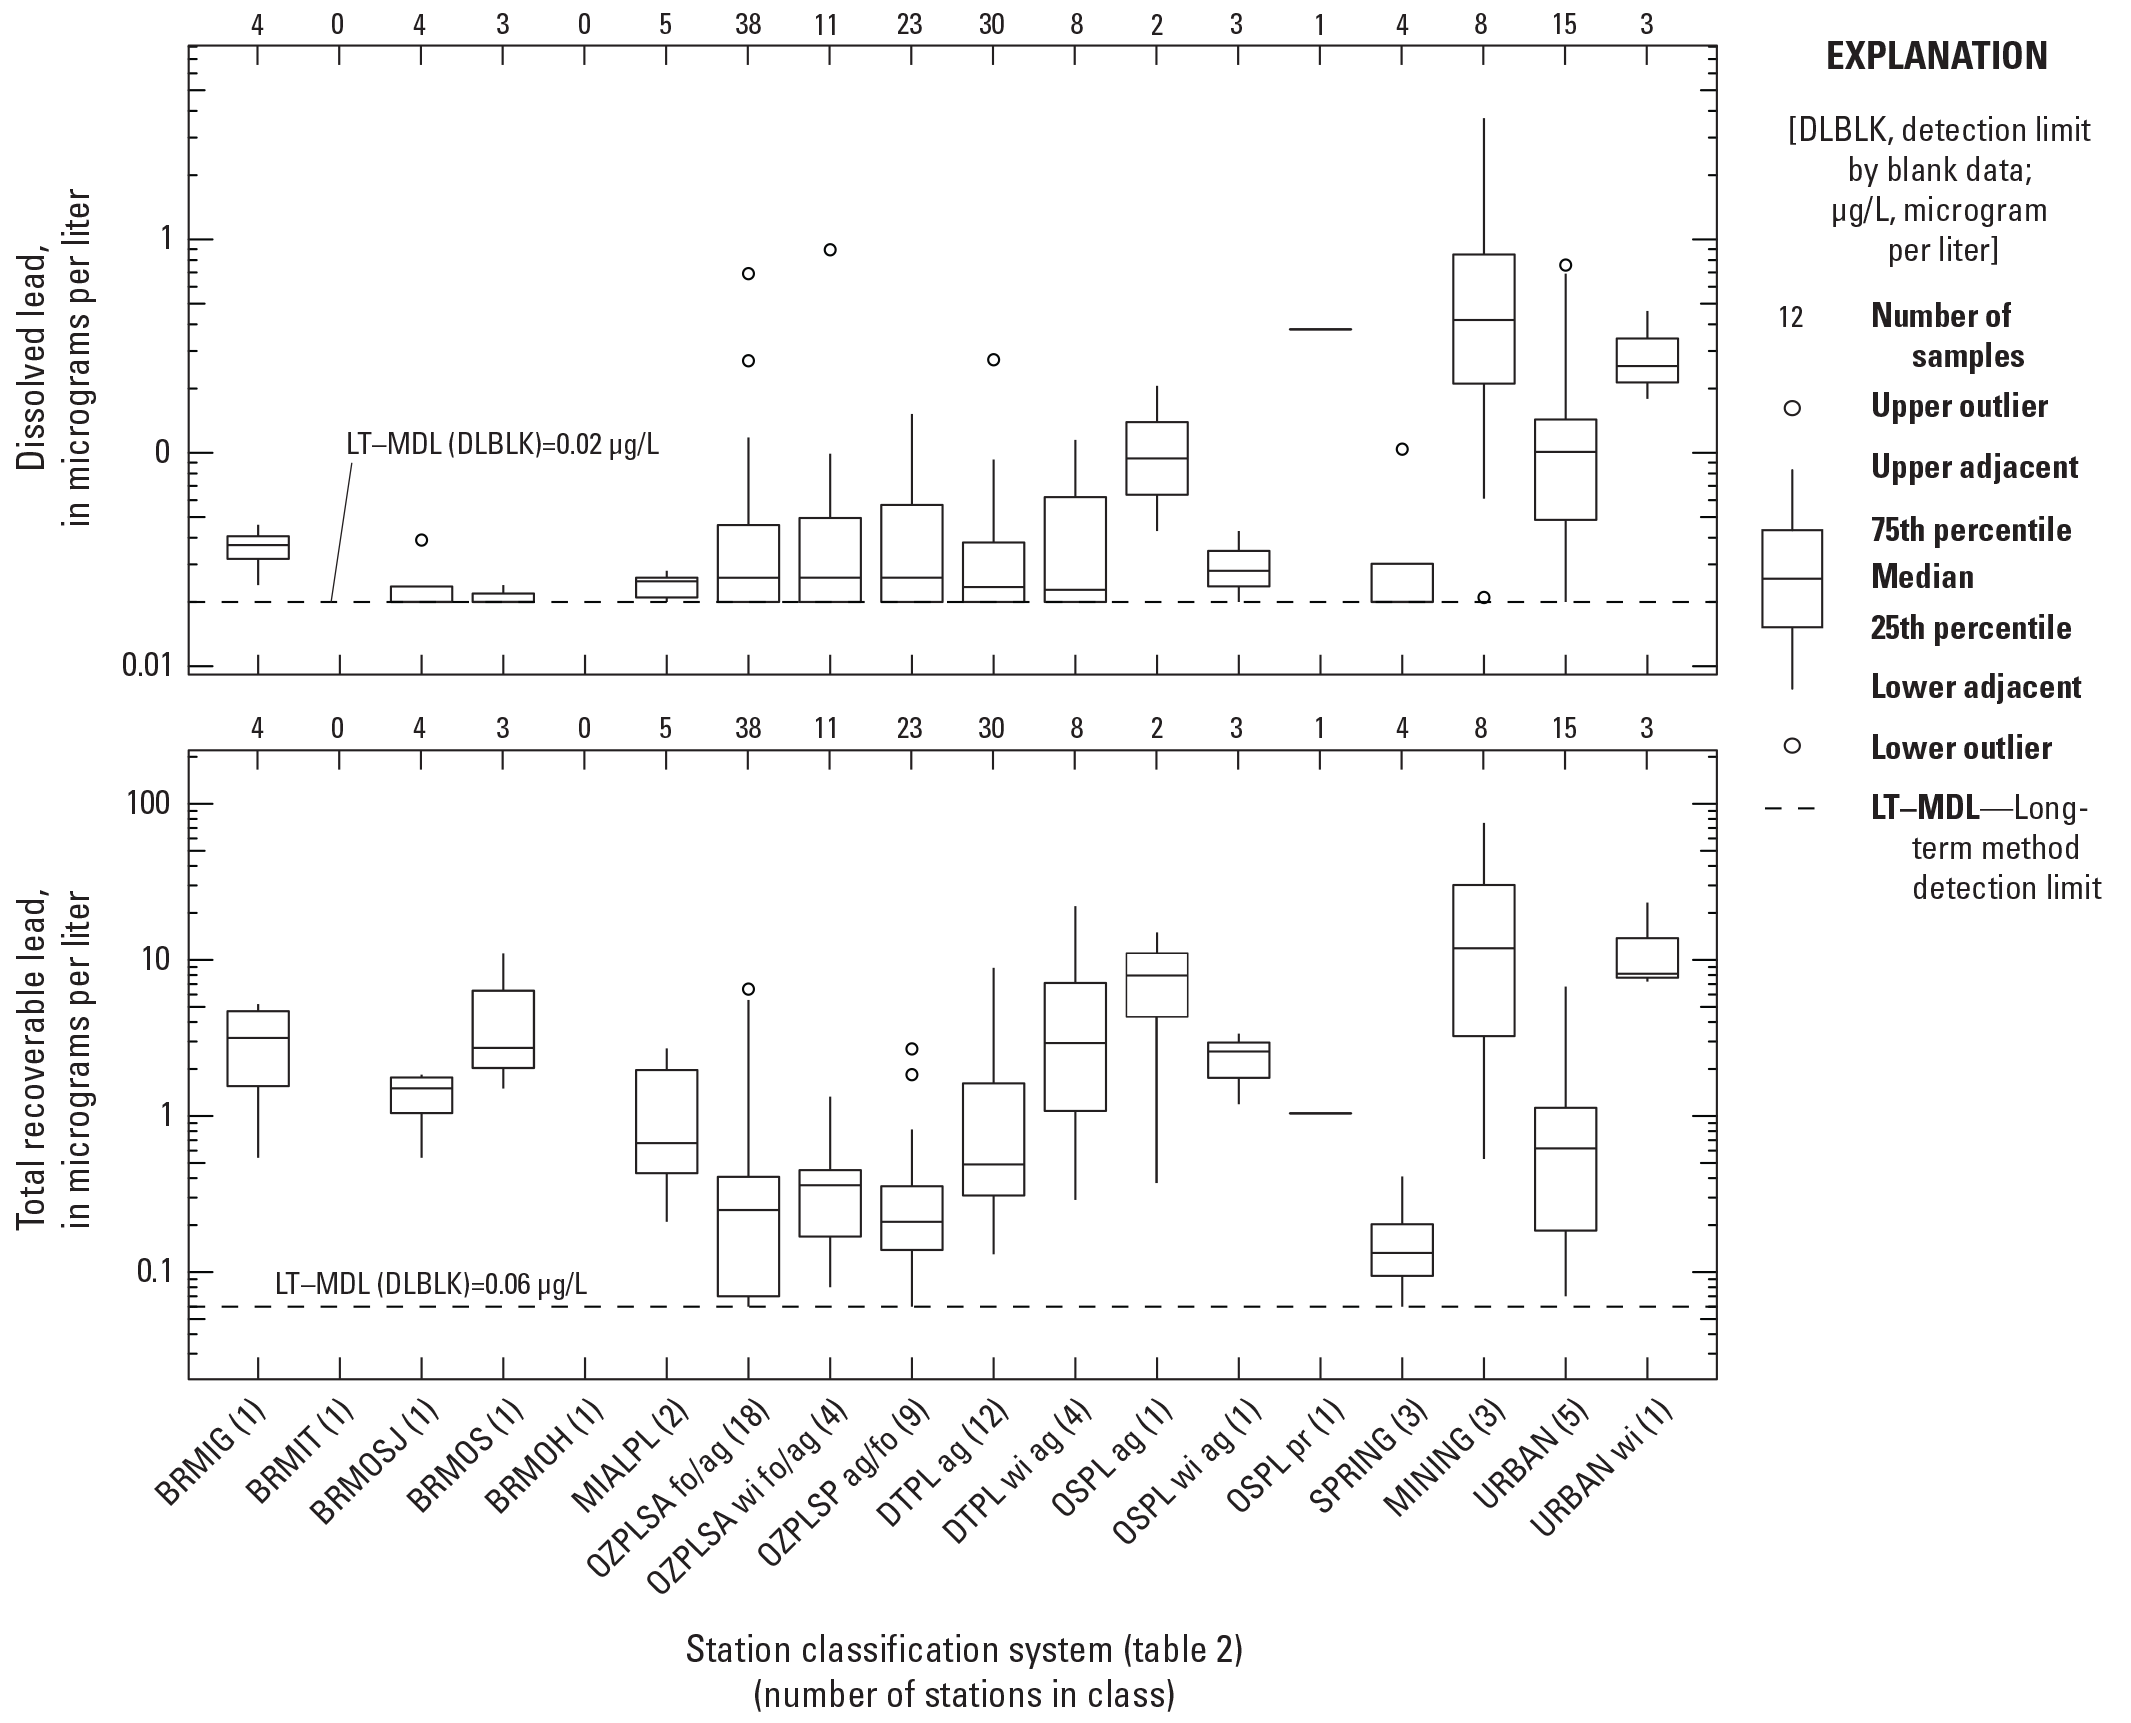
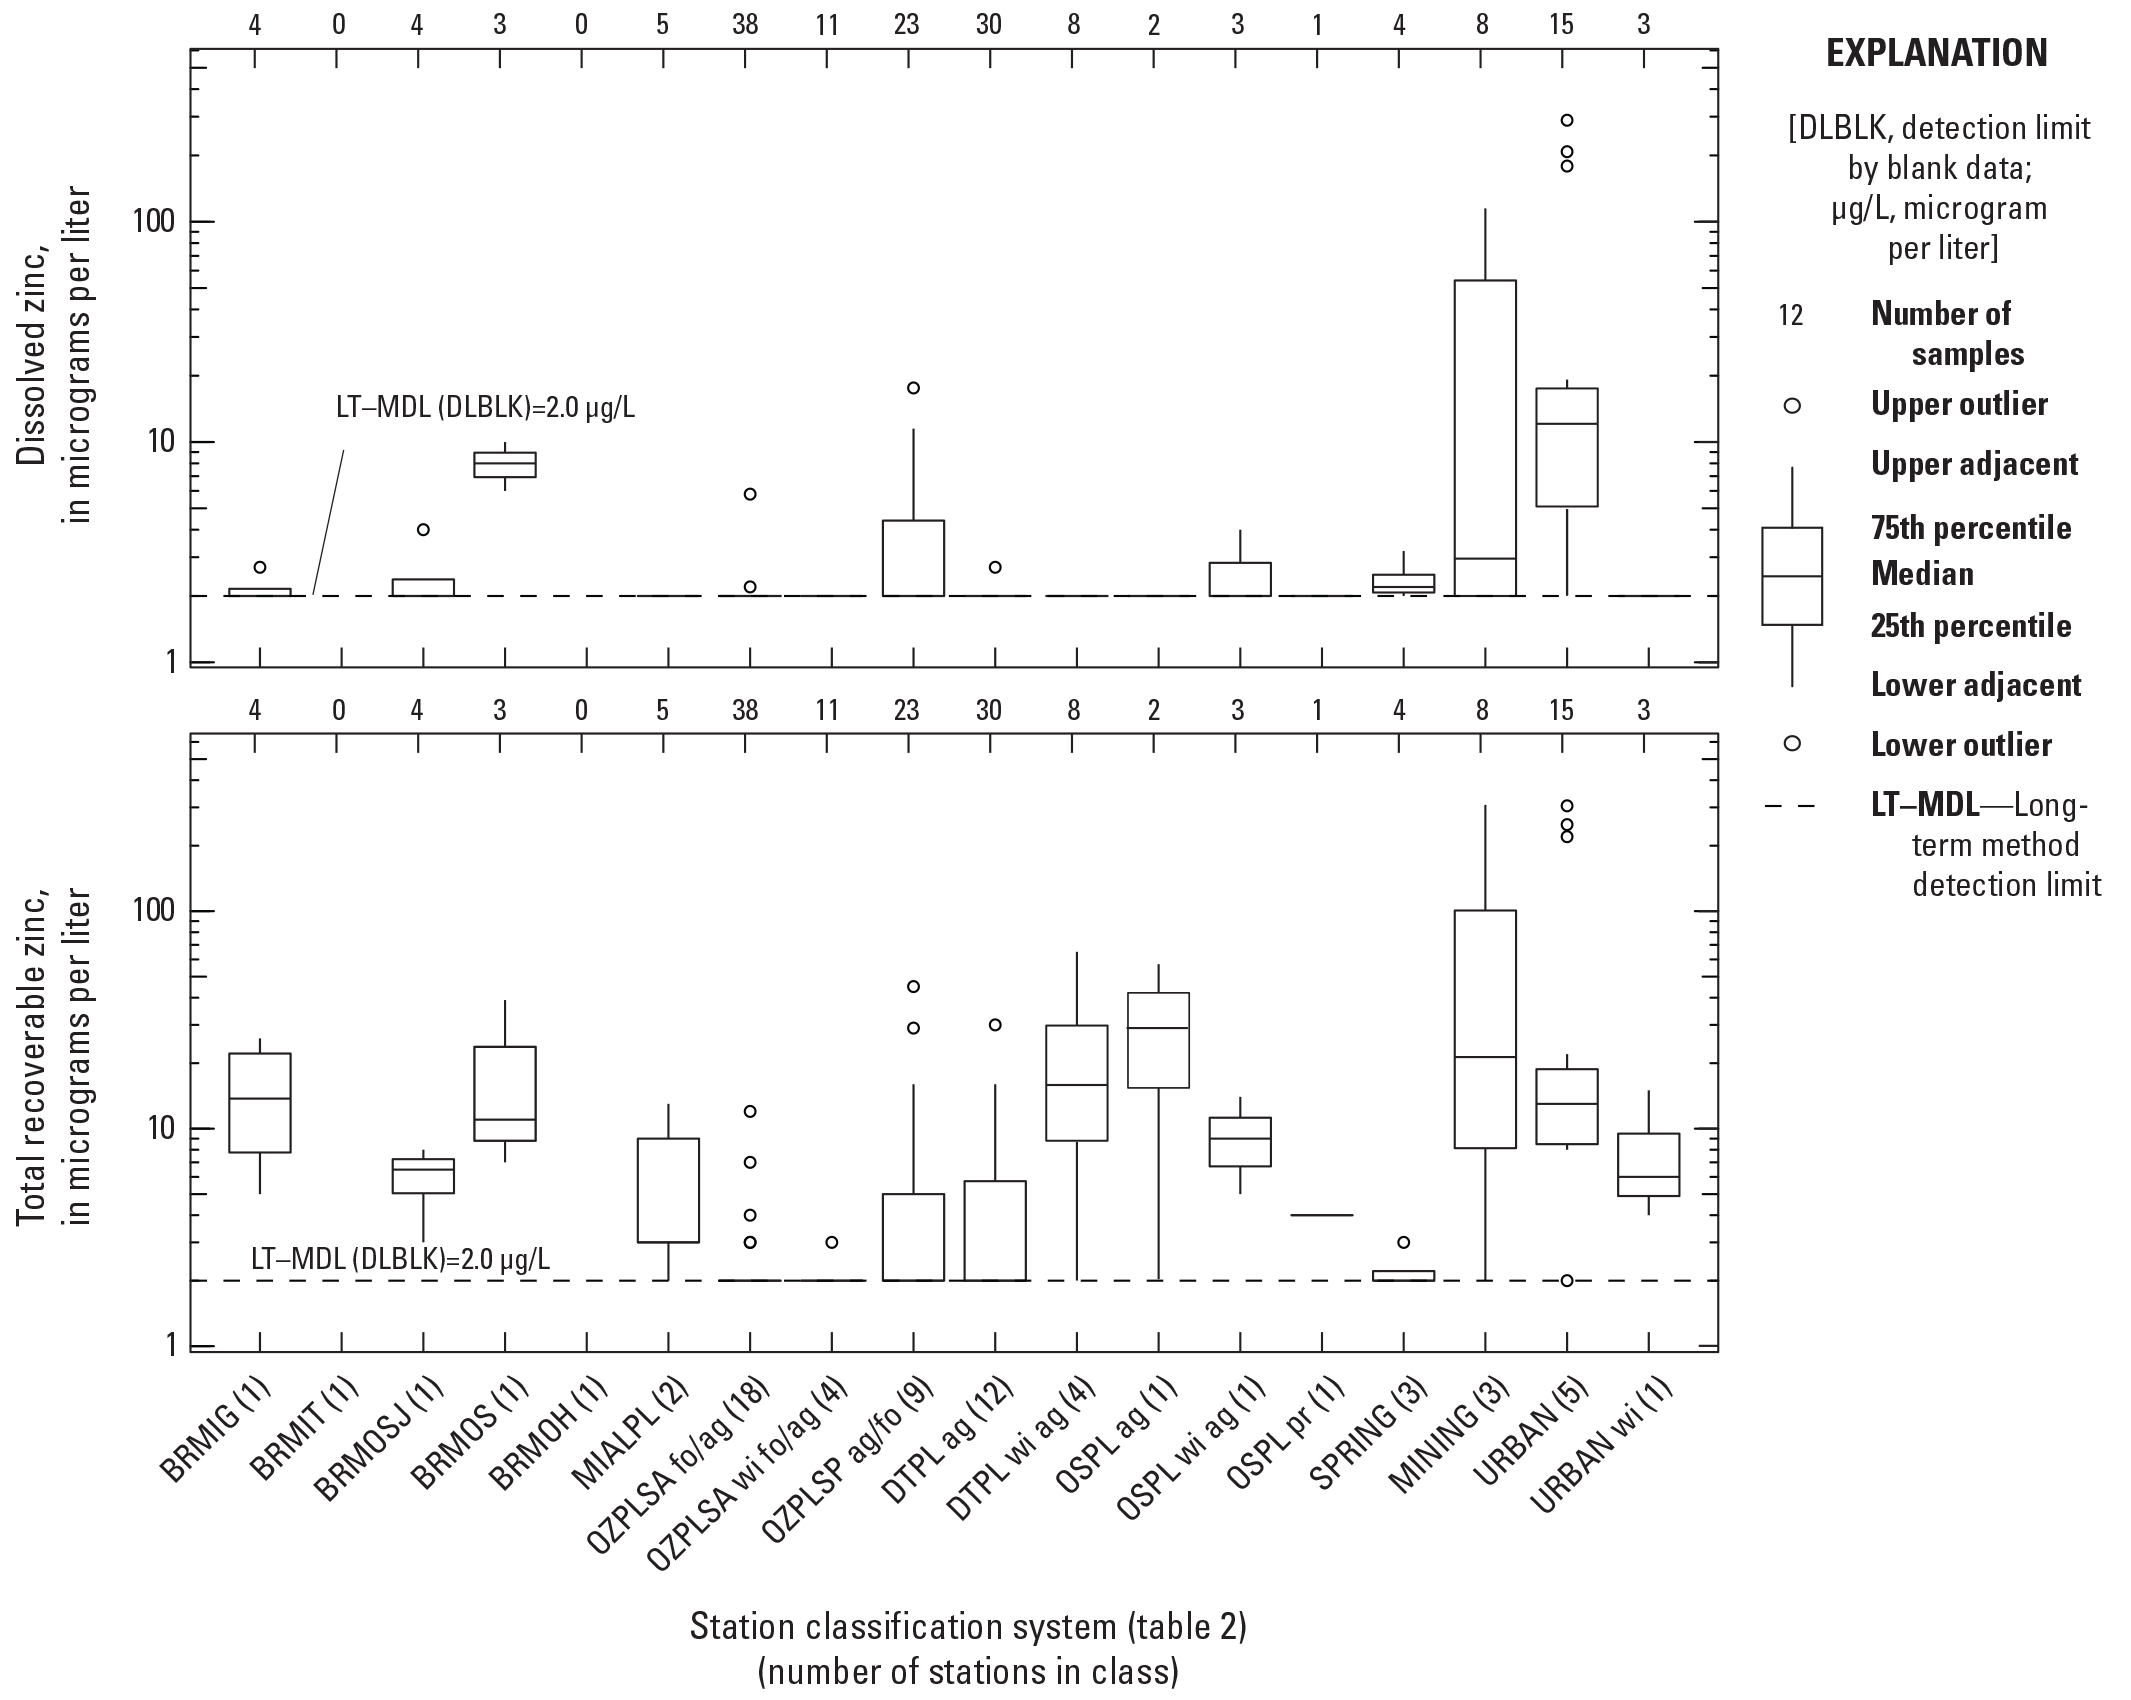
Distribution of dissolved and total recoverable lead and zinc concentrations from surface-water-quality stations in Missouri, water year 2021.
Physical Properties, Suspended-Solids Concentration, Suspended-Sediment Concentration, and Fecal Indicator Bacteria Density
The physical properties analyzed for this report were dissolved oxygen, specific conductance, and water temperature. The median dissolved oxygen ranged from 7.0 milligrams per liter (mg/L) at the BRMIT station to 10.2 mg/L at the BRMOSJ station (fig. 5). Median specific conductance values varied substantially among the station classes, ranging from 130 microsiemens per centimeter at 25 degrees Celsius at the OSPL pr station to 823 microsiemens per centimeter at 25 degrees Celsius at the BRMOS station. At the BRMOSJ station, the interquartile range in specific conductance was smaller than the other large river sites. Median water temperature ranged from 12.3 degrees Celsius (°C) at the BRMOSJ station to 24.7 °C at the BRMIT station. The interquartile range in water temperature at the SPRING stations was much smaller than for other station classes.
Suspended solids and suspended sediment are measures of the solid material suspended in the water column. These two measures are not considered directly comparable because of differences in collection and analytical techniques. The concentrations of suspended solids were determined for all classes and types except BRMIT and BRMOH. Median suspended-solids concentrations ranged from the MRL (15 mg/L) to 102 mg/L (fig. 5). Suspended-solids samples in the OZPL (SA fo/ag, SA wi fo/ag, and SP ag/fo), SPRING, MINING, and URBAN classes had median concentrations at the MRL (15 mg/L). The DTPL wi ag class had the largest median suspended-solids concentration. Suspended-sediment concentrations were determined at four Big River station classes (BRMIG, BRMIT, BRMOSJ, and BRMOH; fig. 5). Median suspended-sediment concentrations ranged from 75 mg/L at the BRMIG station to 157 mg/L at the BRMOH station (fig. 5).
Median E. coli and fecal coliform bacteria densities varied among all station classes, but median bacteria densities in all station classes were less than 700 colonies per 100 milliliters (col/100 mL) of water. Median E. coli bacteria densities ranged from 17 to 370 col/100 mL of water. The smallest median E. coli density was measured at the SPRING stations, and the largest median E. coli density was measured at the BRMOS station. Median fecal coliform bacteria densities ranged from 24 to 660 col/100 mL of water. The smallest median fecal coliform densities were in samples collected at the SPRING stations. The largest median fecal coliform densities were in samples collected at the BRMOS station (fig. 6).
Dissolved Nitrate Plus Nitrite and Total Phosphorus Concentrations
Samples were collected at all stations for the analysis of nutrients, including dissolved nitrate plus nitrite and total phosphorus. Median dissolved nitrate plus nitrite and total phosphorus concentrations varied considerably among all station classes and types (fig. 7). Median dissolved nitrate plus nitrite ranged from 0.16 mg/L at the OSPL pr station to 5.27 mg/L at the URBAN stations (fig. 7). Median total phosphorus ranged from the LT–MDL (0.02 mg/L) to 0.27 mg/L. The smallest median total phosphorus concentrations were at the OZPLSA fo/ag, and SPRING stations. More than one-half of the samples from the SPRING stations had total phosphorus concentrations less than the LT–MDL, indicating that the true median concentration at these stations is less than 0.02 mg/L. The largest median concentration was detected at the BRMIT station (fig. 7).
Dissolved and Total Recoverable Lead and Zinc Concentrations
The median concentration of dissolved lead ranged from less than 0.02 to 0.42 microgram per liter (µg/L), and the median concentration of total recoverable lead ranged from 0.14 to 11.85 µg/L. The smallest median concentrations of dissolved lead were at the LT–MDL (0.02 µg/L) in samples collected at the BRMOSJ, BRMOS, and SPRING stations. Samples from the MINING stations had the largest median concentration of dissolved lead (fig. 8). The smallest median concentration of total recoverable lead was measured at the SPRING stations (0.14 µg/L), and the largest median total recoverable lead concentration of 11.85 µg/L was at the MINING stations. No dissolved or total recoverable lead or zinc samples were collected at the BRMIT and BRMOH stations.
The median concentrations of dissolved zinc and total recoverable zinc ranged from the LT–MDL of 2.0 to 12.1 µg/L and the LT–MDL of 2.0 to 29.5 µg/L, respectively (fig. 8). Median dissolved zinc concentrations were calculated to be at the LT–MDL (2.0 µg/L) for all stations, except for BRMOS, SPRING, MINING, and URBAN. The URBAN station had the largest median concentration of dissolved zinc. The smallest median concentrations of total recoverable zinc were at the LT–MDL of 2.0 µg/L at the OZPLSA (fo/ag and wi fo/ag), OZPLSP ag/fo, DTPL ag, and SPRING stations. The largest median concentration of total recoverable zinc was at the OSPL ag station (29.5 µg/L).
Selected Pesticide Concentrations and Detection Frequencies
Samples collected for the analysis of dissolved pesticide compounds during water year 2021 are provided in this report for seven stations. The AWQMN and the NWQN use different sampling and analytical methods for pesticide compounds, which have somewhat different detection limits. Samples from 4 stations were analyzed for a suite of 85 pesticides (both stations in the MIALPL, 1 OSPL wi ag station, and 1 URBAN station). An expanded list of 103 pesticides was analyzed in samples from 3 Big River stations (BRMIG, BRMIT, and BRMOH) as part of the NWQN. Only compounds analyzed by both pesticide methods and having detections greater than the LRL are discussed in this report. Note that the analysis of pesticide data provided in table 5 includes nondetections if at least one sample had a detection greater than the LRL for that compound.
Table 5.
Summary of detections of selected pesticides for water year 2021 in Missouri.[Water year 2021 is defined as October 1, 2020, through September 30, 2021. µg/L, microgram per liter; %, percent; MIALPL, Mississippi Alluvial Plain; <, less than; E, estimated concentration; CIAT, 2-Chloro-4-isopropylamino-6-amino-s-triazine; --, no data; OSPL wi ag, Osage Plains watershed (drainage area) indicator, agriculture; NA, not applicable; URBAN, urban; BRMIT, Big River—Mississippi River at Thebes, Illinois; BRMIG, Big River—Mississippi River below Grafton, Illinois; BRMOH, Big River—Missouri River at Hermann, Missouri]
A total of 9 pesticide compounds (acetochlor, atrazine, 2-Chloro-4-isopropylamino-6-amino-s-triazine [CIAT; a degradation product of atrazine], metalaxyl, metolachlor, metribuzin, prometon, simazine, and tebuthiuron; table 5) were detected at concentrations greater than their LRL in at least 1 sample during water year 2021. Of the 9 pesticides detected, 7 were detected in 50 percent or more of the samples collected from the 6 station classifications. The seven pesticides were acetochlor, atrazine, CIAT, metolachlor, metribuzin, prometon, and simazine. Each of the 7 stations sampled for pesticides had at least 1 pesticide detection greater than the LRL. The pesticide compounds with the greatest number of detections above the LRL included acetochlor, atrazine, CIAT, and metolachlor.
Summary
The U.S. Geological Survey (USGS), in cooperation with the Missouri Department of Natural Resources, collects surface-water-quality data in Missouri each water year (the period from October 1 to September 30 and designated by the year in which it ends). These data, which are stored and maintained in the USGS National Water Information System database, are collected as part of the Missouri Ambient Water-Quality Monitoring Network (AWQMN) and constitute a permanent, accessible source of representative, reliable, impartial, and timely information for developing an enhanced understanding of the State’s water resources. In addition to the AWQMN stations, the USGS also collects data at two USGS National Water Quality Network stations and, in cooperation with the U.S. Army Corps of Engineers, routinely collects suspended-sediment concentration data on the Missouri and Mississippi Rivers.
Surface-water-quality data summarized in this report were collected during water year 2021 at 72 stations (70 AWQMN and 2 National Water Quality Network stations), among which are 4 stations with suspended-sediment data collected in cooperation with the U.S. Army Corps of Engineers. Stations were classified corresponding to physiographic province, primary land use, or unique hydrologic characteristics of the stations. The annual summary of selected constituents provides the Missouri Department of Natural Resources with current information to assess the quality of surface water within the State and ensure the objectives of the AWQMN are being met. The data collected also provide support for the design, implementation, and evaluation of preventive and remediation programs.
References Cited
Barr, M.N., 2010, Quality of surface water in Missouri, water year 2009: U.S. Geological Survey Open-File Report 2010–1233, 22 p., accessed May 13, 2022, at https://doi.org/10.3133/ofr20101233.
Barr, M.N., 2011, Quality of surface water in Missouri, water year 2010: U.S. Geological Survey Data Series 636, 21 p., accessed May 13, 2022, at https://doi.org/10.3133/ds636.
Barr, M.N., 2012, Quality of surface water in Missouri, water year 2011: U.S. Geological Survey Data Series 734, 22 p., accessed May 13, 2022, at https://doi.org/10.3133/ds734.
Barr, M.N., 2014, Quality of surface water in Missouri, water year 2012: U.S. Geological Survey Data Series 818, 24 p., accessed May 12, 2022, at https://doi.org/10.3133/ds818.
Barr, M.N., 2015, Quality of surface water in Missouri, water year 2014: U.S. Geological Survey Data Series 971, 22 p., accessed May 12, 2022, at https://doi.org/10.3133/ds971.
Barr, M.N., and Bartels, K.A., 2018, Quality of surface water in Missouri, water year 2016: U.S. Geological Survey Data Series 1086, 25 p., accessed May 12, 2022, at https://doi.org/10.3133/ds1086.
Barr, M.N., and Bartels, K.A., 2019, Quality of surface water in Missouri, water year 2017: U.S. Geological Survey Data Series 1108, 25 p., accessed May 12, 2022, at https://doi.org/10.3133/ds1108.
Barr, M.N., and Davis, J.V., 2010, Surface-water quality conditions and long-term trends at selected sites within the Ambient Water-Quality Monitoring Network in Missouri, water years 1993–2008: U.S. Geological Survey Scientific Investigations Report 2010–5078, 42 p. [Also available at https://doi.org/10.3133/sir20105078.]
Barr, M.N., and Heimann, D.C., 2016, Quality of surface water in Missouri, water year 2015: U.S. Geological Survey Data Series 1023, 22 p., accessed May 12, 2022, at https://doi.org/10.3133/ds1023.
Barr, M.N., and Schneider, R.E., 2014, Quality of surface water in Missouri, water year 2013: U.S. Geological Survey Data Series 886, 21 p., accessed May 12, 2022, at https://doi.org/10.3133/ds886.
Buckley, C.E., 2022, Quality of surface water in Missouri, water year 2020: U.S. Geological Survey Data Report 1153, 24 p., accessed May 12, 2022, at https://doi.org/10.3133/dr1153.
Dewitz, J., and U.S. Geological Survey, 2021, National Land Cover Database (NLCD) 2019 products (ver. 2.0, June 2021): U.S. Geological Survey data release, accessed November 16, 2022, at https://doi.org/10.5066/P9KZCM54.
Edwards, T.K., and Glysson, G.D., 1999, Field methods for measurement of fluvial sediment: U.S. Geological Survey Techniques of Water-Resources Investigations, book 3, chap. C2, 89 p., accessed May 13, 2022, at https://doi.org/10.3133/twri03C2.
Fishman, M.J., ed., 1993, Methods of analysis by the U.S. Geological Survey National Water Quality Laboratory—Determination of inorganic and organic constituents in water and fluvial sediments: U.S. Geological Survey Open-File Report 93−125, 217 p. [Also available at https://doi.org/10.3133/ofr93125.]
Foreman, W.T., Williams, T.L., Furlong, E.T., Hemmerle, D.M., Stetson, S.J., Jha, V.K., Noriega, M.C., Decess, J.A., Reed-Parker, C., and Sandstrom, M.W., 2021, Comparison of detection limits estimated using single- and multi-concentration spike-based and blank-based procedures: Talanta, v. 228, art. 122139, 15 p., accessed May 13, 2022, at https://doi.org/10.1016/j.talanta.2021.122139.
Garbarino, J.R., Kanagy, L.K., and Cree, M.E., 2006, Determination of elements in natural-water, biota, sediment, and soil samples using collision/reaction cell inductively coupled plasma-mass spectrometry: U.S. Geological Survey Techniques and Methods, book 5, chap. B1, 88 p. [Also available at https://doi.org/10.3133/tm5B1.]
Guy, H.P., 1969, Laboratory theory and methods for sediment analysis: U.S. Geological Survey Techniques of Water-Resources Investigations, book 5, chap. C1, 58 p., accessed May 13, 2022, at https://doi.org/10.3133/twri05C1.
Kay, R.T., 2019, Quality of surface water in Missouri, water year 2018: U.S. Geological Survey Data Series 1119, 25 p., accessed August 15, 2022, at https://doi.org/10.3133/ds1119.
Kay, R.T., 2021, Quality of surface water in Missouri, water year 2019: U.S. Geological Survey Data Series 1132, 26 p., accessed August 15, 2022, at https://doi.org/10.3133/ds1132.
Missouri Department of Natural Resources, 2020, Missouri integrated water quality report and section 303(d) list, 2020: Jefferson City, Mo., Missouri Department of Natural Resources, Water Protection Program, [variously paged], accessed November 15, 2022, at https://dnr.mo.gov/document/2020-missouri-integrated-water-quality-report-305b-report.
Missouri Department of Natural Resources, 2022, Water quality, chap. 7 of Rules of Department of Natural Resources—Division 20—Clean Water Commission: Jefferson City, Mo., Missouri Department of Natural Resources, Clean Water Commission, p. 54–131, accessed November 15, 2022, at https://www.sos.mo.gov/CMSImages/AdRules/csr/current/10csr/10c20-7.pdf.
Myers, D.N., Stoeckel, D.M., Bushon, R.N., Francy, D.S., and Brady, A.M.G., 2014, Fecal indicator bacteria (ver. 2.1): U.S. Geological Survey Techniques of Water-Resources Investigations, book 9, chap. A7, sec. 7.1, accessed August 29, 2022, at https://doi.org/10.3133/twri09A7.1.
National Oceanic and Atmospheric Administration, 2021a, Statewide time series—Missouri climate summary: National Oceanic and Atmospheric Administration, National Centers for Environmental Information database, accessed May 25, 2022, at https://www.ncdc.noaa.gov/cag/statewide/time-series.
National Oceanic and Atmospheric Administration, 2021b, U.S. climate at a glance background: National Oceanic and Atmospheric Administration, National Centers for Environmental Information web page, accessed May 25, 2022, at https://www.ncdc.noaa.gov/cag/.
Otero-Benitez, W., and Davis, J.V., 2009a, Quality of surface water in Missouri, water year 2007: U.S. Geological Survey Open-File Report 2009–1096, 19 p., accessed August 29, 2022, at https://doi.org/10.3133/ofr20091096.
Otero-Benitez, W., and Davis, J.V., 2009b, Quality of surface water in Missouri, water year 2008: U.S. Geological Survey Open-File Report 2009–1214, 18 p., accessed August 29, 2022, at https://doi.org/10.3133/ofr20091214.
Patton, C.J., and Kryskalla, J.R., 2011, Colorimetric determination of nitrate plus nitrite in water by enzymatic reduction, automated discrete analyzer methods: U.S. Geological Survey Techniques and Methods, book 5, chap. B8, 34 p. [Also available at https://doi.org/10.3133/tm5B8.]
Patton, C.J., and Truitt, E.P., 1992, Methods of analysis by the U.S. Geological Survey National Water Quality Laboratory—Determination of total phosphorus by a Kjeldahl digestion method and an automated colorimetric finish that includes dialysis: U.S. Geological Survey Open-File Report 92–146, 39 p. [Also available at https://doi.org/10.3133/ofr92146.]
Patton, C.J., and Truitt, E.P., 2000, Methods of analysis by the U.S. Geological Survey National Water Quality Laboratory—Determination of ammonium plus organic nitrogen by a Kjeldahl digestion method and an automated photometric finish that includes digest cleanup by gas diffusion: U.S. Geological Survey Open-File Report 00–170, 31 p. [Also available at https://doi.org/10.3133/ofr00170.]
Richards, J.M., and Barr, M.N., 2021, General water-quality conditions, long-term trends, and network analysis at selected sites within the Ambient Water-Quality Monitoring Network in Missouri, water years 1993–2017: U.S. Geological Survey Scientific Investigations Report 2021–5079, 75 p., accessed May 12, 2022, at https://doi.org/10.3133/sir20215079.
Sandstrom, M.W., Kanagy, L.K., Anderson, C.A., and Kanagy, C.J., 2015, Determination of pesticides and pesticide degradates in filtered water by direct aqueous-injection liquid chromatography-tandem mass spectrometry: U.S. Geological Survey Techniques and Methods, book 5, chap. B11, 54 p., accessed August 15, 2022, at https://doi.org/10.3133/tm5B11.
Sandstrom, M.W., Stroppel, M.E., Foreman, W.T., and Schroeder, M.P., 2001, Methods of analysis by the U.S. Geological Survey National Water Quality Laboratory—Determination of moderate-use pesticides and selected degradates in water by C-18 solid-phase extraction and gas chromatography/mass spectrometry: U.S. Geological Survey Water-Resources Investigations Report 2001–4098, 70 p. [Also available at https://doi.org/10.3133/wri20014098.]
Sandstrom, M.W., and Wilde, F.D., 2014, Syringe-filter procedure for processing samples for analysis of organic compounds by DAI LC–MS/MS (ver. 3.1): U.S. Geological Survey Techniques of Water-Resources Investigations, book 9, chap. A5, sec. 5.2.2.B, 10 p., accessed August 15, 2022, at https://doi.org/10.3133/twri09A5.
Slater, L.J., and Villarini, G., 2017, Evaluating the drivers of seasonal streamflow in the U.S. Midwest: Water (Basel), v. 9, no. 9, art. 695, 22 p., accessed November 15, 2022, at https://doi.org/10.3390/w9090695.
U.S. Census Bureau, 2021, U.S. population estimates: U.S. Census Bureau web page, accessed February 16, 2022, at https://www.census.gov/quickfacts/fact/table/MO/PST045221.
U.S. Environmental Protection Agency, 1997, Guidelines for preparation of the comprehensive State water quality assessments (305(b) reports) and electronic updates: Washington, D.C., U.S. Environmental Protection Agency, Office of Water, EPA–841–B97–002A, [variously paged], accessed November 15, 2022, at https://www.epa.gov/sites/default/files/2015-09/documents/guidelines_for_preparation_of_the_comprehensive_state_water_quality_assessments_305b_reports _and_electronic_updates_1997_volume1.pdf.
U.S. Environmental Protection Agency, 2022, Overview of identifying and restoring impaired waters under Section 303(d) of the CWA: U.S. Environmental Protection Agency web page, accessed November 15, 2022, at https://www.epa.gov/tmdl/overview-identifying-and-restoring-impaired-waters-under-section-303d-cwa.
U.S. Geological Survey, 2006a, Collection of water samples (ver. 2.0): U.S. Geological Survey Techniques of Water-Resources Investigations, book 9, chap. A4, 166 p., accessed August 15, 2022, at https://doi.org/10.3133/twri09A4.
U.S. Geological Survey, 2006b–2010, Water resources data for the United States—Annual water-data report: U.S. Geological Survey, accessed May 26, 2022, at https://wdr.water.usgs.gov/.
U.S. Geological Survey, 2022, USGS water data for the Nation: U.S. Geological Survey National Water Information System database, accessed May 13, 2022, at https://doi.org/10.5066/F7P55KJN.
Wilde, F.D., ed., [variously dated], Field measurements: U.S. Geological Survey Techniques of Water-Resources Investigations, book 9, chap. A6, [variously paged], accessed August 15, 2022, at https://doi.org/10.3133/twri09A6.
Wilde, F.D., Radtke, D.B., Gibs, J., and Iwatsubo, R.T., eds., 2002, Processing of water samples (ver. 2.2, April 2002): U.S. Geological Survey Techniques of Water-Resources Investigations, book 9, chap. A5, 166 p., accessed August 15, 2022, at https://doi.org/10.3133/twri09A5.
World Health Organization, 2022, Coronavirus disease (COVID-19): World Health Organization web page, accessed February 22, 2022, at https://www.who.int/health-topics/coronavirus#tab=tab_1.
Zaugg, S.D., Sandstrom, M.W., Smith, S.G., and Fehlberg, K.M., 1995, Methods of analysis by the U.S. Geological Survey National Water Quality Laboratory—Determination of pesticides in water by C–18 solid-phase extraction and capillary-column gas chromatography/mass spectrometry with selected-ion monitoring: U.S. Geological Survey Open-File Report 95–181, 49 p. [Also available at https://doi.org/10.3133/ofr95181.]
Conversion Factors
Supplemental Information
Specific conductance is given in microsiemens per centimeter at 25 degrees Celsius (µS/cm at 25 °C).
Density population of bacteria is given in colonies per 100 milliliters (col/100 mL) of water.
Concentrations of chemical constituents in water are given either in milligrams per liter (mg/L) or micrograms per liter (µg/L).
A water year is the period from October 1 to September 30 and is designated by the year in which it ends; for example, water year 2021 was from October 1, 2020, to September 30, 2021.
Abbreviations
ag
agriculture
AWQMN
Ambient Water-Quality Monitoring Network
CIAT
2-Chloro-4-isopropylamino-6-amino-s-triazine
DLDQC
detection limit by DQCALC software
DTPL
Dissected Till Plains
E. coli
Escherichia coli
fo
forest
LRL
laboratory reporting level
LT–MDL
long-term method detection limit
MDNR
Missouri Department of Natural Resources
MIALPL
Mississippi Alluvial Plain
MRL
minimum reporting level
NWIS
National Water Information System
NWQL
National Water Quality Laboratory
NWQN
National Water Quality Network
OSPL
Osage Plains
OZPLSA
Ozark Plateaus—Salem Plateau
OZPLSP
Ozark Plateaus—Springfield Plateau
pr
prairie
USGS
U.S. Geological Survey
wi
watershed indicator
For more information about this publication, contact:
Director, USGS Central Midwest Water Science Center
1400 Independence Road
Rolla, MO 65401
573–308–3667
For additional information, visit: https://www.usgs.gov/centers/cm-water
Publishing support provided by the
Rolla Publishing Service Center
Disclaimers
Any use of trade, firm, or product names is for descriptive purposes only and does not imply endorsement by the U.S. Government.
Although this information product, for the most part, is in the public domain, it also may contain copyrighted materials as noted in the text. Permission to reproduce copyrighted items must be secured from the copyright owner.
Suggested Citation
Markland, K.M., 2023, Quality of surface water in Missouri, water year 2021: U.S. Geological Survey Data Report 1179, 24 p., https://doi.org/10.3133/dr1179.
ISSN: 2771-9448 (online)
Study Area
| Publication type | Report |
|---|---|
| Publication Subtype | USGS Numbered Series |
| Title | Quality of surface water in Missouri, water year 2021 |
| Series title | Data Report |
| Series number | 1179 |
| DOI | 10.3133/dr1179 |
| Publication Date | June 12, 2023 |
| Year Published | 2023 |
| Language | English |
| Publisher | U.S. Geological Survey |
| Publisher location | Reston, VA |
| Contributing office(s) | Central Midwest Water Science Center |
| Description | Report: vii, 24 p.; Dataset |
| Country | United States |
| State | Missouri |
| Online Only (Y/N) | Y |