

Developing Satellite-Estimated Precipitation Monthly Reports for Selected Locations in the Republic of the Marshall Islands
Links
- Document: Report (792 kB pdf) , HTML , XML
- Data Releases:
- USGS data release - Satellite precipitation estimates for selected locations in the Republic of the Marshall Islands
- USGS data release - Monthly satellite-estimated precipitation reports for the Republic of the Marshall Islands
- NGMDB Index Page: National Geologic Map Database Index Page (html)
- Download citation as: RIS | Dublin Core
Acknowledgments
We are grateful for funding from the U.S. Agency for International Development Bureau for Humanitarian Assistance, the U.S. Geological Survey (USGS) Risky World Program, the USGS National Land Imaging Program, and the USGS National Climate Adaptation Science Center. A big mahalo and kommol tata to Raymond Tanabe, Director for the Pacific Region of the National Weather Service, for his advice and assistance with archival data from the Marshall Islands rain gages and Pacific El Niño Application Center reports.
Abstract
The Republic of the Marshall Islands (also known as the Marshall Islands) is a nation of more than 30 low-lying atolls and islands, most of which are inhabited, dispersed across an Exclusive Economic Zone over 770,000 square miles in the tropical central north Pacific Ocean. Monitoring environmental conditions for potential drought risk is challenging in such a dispersed island nation, and current drought hazard products provide generalities regarding conditions on a broad geographic scale. U.S. Geological Survey scientists and managers of natural resources and natural hazards in the Marshall Islands used Integrated Multi-satellitE Retrievals for Global Precipitation Measurement (called “IMERG”) satellite estimates of precipitation to develop content and a template for timely monthly reporting of precipitation for 23 inhabited atolls and islands. The IMERG data are available in a U.S. Geological Survey data release at https://doi.org/10.5066/P95ANG3N. The monthly reports itself are available in a U.S. Geological Survey data release at https://doi.org/10.5066/P90J1426. This Data Report describes the collaboration process and results of developing the report content and layout.
Introduction
The Republic of the Marshall Islands (also known as Marshall Islands) is a Small Island Developing State in the Micronesian subregion of the tropical north Pacific Ocean. Communities and agriculture are distributed across several dozen atolls and islands in an ocean area of more than 770,000 square miles. Precipitation is the only natural source of freshwater recharge. The Marshall Islands experiences a latitudinal precipitation gradient; southern islands and atolls are wetter, and northern ones are drier (Stoddart and Walsh, 1992; Leong and others, 2014). Atolls in the northern latitudes also typically experience an annual dry season in the northern hemisphere in winter/spring and a wet season in summer/fall (Stoddart and Walsh, 1992). These conditions are affected by the El Niño Southern Oscillation (ENSO), and extreme drought and related effects have been experienced during El Niño phases (Fosberg, 1960; Wairiu and others, 2012; Manner and others, 2017; Keener and others, 2018; Heim and others, 2020).
Many Marshallese communities rely on crops for food and income, and crops depend on precipitation and groundwater of suitable quality (Fosberg, 1949, 1960; Donnegan and others, 2011; Wairiu and others, 2012; Manner and others, 2017; Ministry of Natural Resources and Commerce, 2021). Currently (2023), active rain gages are on 6 of the 23 inhabited atolls and islands (Ailinglaplap, Jaluit, Kwajalein, Majuro, Mili, and Wotje); and data have been collected in previous years from Arno, Ebon, Eniwetok, Likiep, Ujelang, and Utirik; fig. 1; Western Regional Climate Center, 2023). Precipitation status of the country is extrapolated from these data, which are relatively sparse for such a large area and dispersed population; thus, although programs responsible for food and water security receive country-wide extrapolations of precipitation status, spatial granularity is coarse, and reports lack empirical estimates other than data derived from a few rain gages.
The goal of this effort was to provide managers of water and food security programs in the Marshall Islands with comprehensive, timely estimated precipitation reports that dovetail with and add value to the existing suite of weather and climate products they already use to make decisions. Our shared goal explicitly was not to attempt to identify conditions that would serve as triggers or alerts to be used by decision makers to take action. Our team consisted of U.S. Geological Survey scientists and managers of other collaborating agencies who co-produced a monitoring protocol consisting of 23 locations to be monitored selected by the partners from the Marshall Islands, a set of descriptive numeric indices, and a template used to report updates monthly. The 23 selected locations are shown in figure 1.
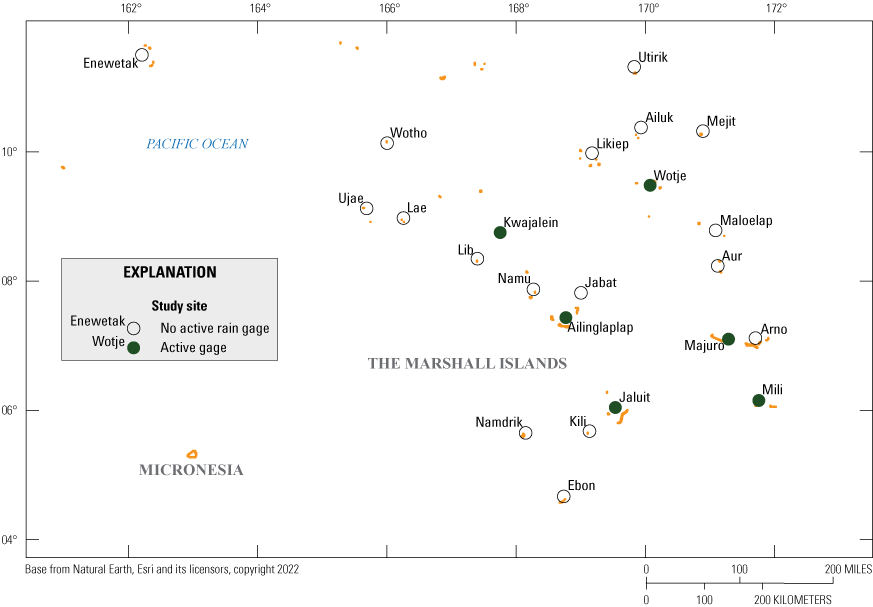
Marshall Islands study sites and rain gages, north Pacific Ocean.
Developing the Monitoring Protocol and Report Template
Data Exploration and Conditioning
We developed a monitoring protocol that generates monthly estimates of precipitation for 23 inhabited atolls and islands using Integrated Multi-satellitE Retrievals for Global Precipitation Measurement (IMERG) version 6 satellite data (National Aeronautics and Space Administration, 2023). IMERG uses pixels that are larger than atoll land masses (0.1 by 0.1 degree, or roughly 10 by 10 kilometers) and thereby cover land and water. One or more pixels were selected for each location using a global shoreline dataset adapted from Sayre and others (2019). Any point within a pixel is assumed to have received the same amount of precipitation, but IMERG provides a more-seamless spatial coverage than a rain gage. Both datasets are important for developing the monitoring protocol because rain gages provide measured data that serve as a ground truth against which the satellite estimates can be compared.
The National Aeronautics and Space Administration provides IMERG precipitation in three different runs. The IMERG Early Run (that is, the signal processing steps that create IMERG Early Run data) is near real time with low latency (hours) that is available first. The IMERG Late Run (that is, Late Run data) is near real time (1-day lag) with quasi-Lagrangian time interpolation that uses all satellite microwave precipitation estimates, together with microwave-calibrated infrared satellite estimates, and rain gage analyses improving the estimate. The IMERG Final Run (that is, Final Run data) is considered the final (1- to 6-month lag) product and has monthly gage data added to create estimates.
We used 20 years (2001–20) of IMERG version 6 Final Run data (Senay and others 2022) to define baseline statistics; in other words, central tendency, and dispersion of the satellite data for each of the 23 locations. This 20-year period included a roughly equal number of El Niño and La Niña events (Golden Gate Weather Services, 2023; Physical Sciences Laboratory, 2023; Webb, 2023), which means the baseline statistics were representative of the range of ENSO effects on precipitation patterns. IMERG Late Run data are available on a daily basis and thus were selected because of their near real-time (1-day lag) availability to provide timely precipitation reporting.
To demonstrate representativeness of the IMERG data, we compared the IMERG Final Run data for the 20-year period with the measured rain gage data from 7 sites (Ailinglaplap, Jaluit, Kwajalein, Majuro, Mili, Utirik, and Wotje; fig. 1). Before the comparisons, the datasets were explored and quality controlled. The IMERG Final Run data were complete for all months and locations during the 20-year period. In contrast, the rain gage data were not complete and had periods of missing data in the record. Months with partial data were excluded if less than 28 days of data were in any given month. If data were missing for entire months, we manually entered precipitation reported in Pacific ENSO Applications Climate Center (PEAC) update reports if available (see all reports at https://www.weather.gov/peac/update). The final database was relatively complete, especially for the years from 2012 to 2020. The 2001–11 period was more variable and had notable data gaps for 2004 and for the Jaluit site.
We used the Pearson’s correlation coefficient (r) as the basis of comparison (Welkowitz and others, 2011). For each location, daily IMERG Final Run data were plotted against the rain gage data. A few bivariate outliers were identified (Welkowitz and others, 2011; PennState Eberly College of Science, 2023); thus, we filtered out two standard deviation outliers from the daily records before summing the daily data into monthly totals. The pattern of outliers was not in particular months of the year or years in the dataset, and no month had less than 28 days per month after filtering outliers. We computed monthly sums for each site. The IMERG Final Run monthly sums for each location were positively skewed (ranging from 0.57 to 2.01). Separate regressions of IMERG monthly estimates on the rain gage data were performed for each location; intercepts were forced through zero assuming and observing that generally zero rainfall conditions from a rain gage would correspond to IMERG estimates of zero rainfall. For all seven sites, Pearson’s r values were high, ranging from a low of 0.81 for Wotje Atoll to a high of 0.95 for the rain gage at the Majuro Atoll airport.
In a second evaluation step, we compared the 2001–20 dataset of IMERG Final Run data (used to establish the baseline statistics) with the IMERG Late Run dataset (Senay and others, 2022). Regressions were performed on monthly sums for each of the 23 sites. Pearson’s r values were uniformly high, ranging from a low of 0.97 for Wotho Atoll to a high of 0.99 for the Mili Atoll. The results of these two evaluations demonstrated that using IMERG Late Run data for timely monthly reporting is reasonable because it is well correlated with IMERG Final Run data and could be used as reliable indices with confidence.
Developing the Report Content
The content of the monthly reports consists of descriptive statistics assembled from the IMERG data plus visual indices of those statistics. The report that came out each month was a summary of the estimated precipitation of the previous month. Because the monthly reports were designed to supplement existing precipitation, drought, and agroforest management products, the reports do not include predictive statistics or interpretation of potential risk to or effect of the estimated precipitation on vegetation health or crop production.
The team discussed which approach was more important for the monthly reports; monitoring typical annual trends (that is, usual weather patterns) or detecting unusually dry or wet conditions. To monitor typical annual trends, the data from all locations and months in the 20-year database would be pooled to compute descriptive statistics that would be used to assess how typical any given month’s precipitation was. Instead, the team decided detecting unusually dry or wet conditions was more important; therefore, any given month’s precipitation should be compared against the long-term (2001–20) data from that location and month. Thus, a set of descriptive statistics was calculated for each month at each of the 23 locations using the 20-year database. This means that dry months and (or) dry locations may receive little precipitation but that precipitation might still be considered typical based on the range of precipitation in the 20-year record. Importantly, low precipitation may still affect freshwater availability or vegetation health even if it is typical. That said, connecting satellite-estimated precipitation with risk exposure of specific crops in specific locations would require thorough understanding of the substrate, groundwater, crop agronomy, and distribution of vegetation types at each of the locations; this knowledge does not currently exist in systematic form for all 23 sites.
For the report, the team agreed to have two types of rainfall indicators that would serve as a frame of reference for how typical or unusual the monthly precipitation was:
-
1. Rainfall index.—Comparing monthly IMERG Late Run precipitation with the 20-year IMERG Final Run baseline data (Senay and others, 2022) provides a frame of reference for how typical or unusual the reporting month’s precipitation was. Precipitation was categorized along a nonparametric scale using quintiles derived from the 20-year IMERG Final Run baseline data. The parametric mean and standard deviation likelihood scale were not used because the distributions were skewed; thus, the nonparametric quintiles were a better descriptor of the 20-year baseline data instead of a theoretical distribution that may not be justified based on the data. Median and quintile values were computed independently for each location and month. The median was chosen as the measure of typical precipitation because it tends to be more stable than the mean value, which is sensitive to extremely large values. The quintiles for the rainfall index are as follows: the bottom quintile (0–19 percent) consists of the lowest precipitation values (driest), the next quintile (20–39 percent) is representing drier conditions, the middle quintile (40–59 percent) includes the median and spans the most typical precipitation values (typical), the next quintile (60–79 percent) is a little wetter than the typical conditions, and the highest quintile (80–100 percent) consists of the highest precipitation values (wetter). Each of the quintiles is associated with a color as a quick index of how the current month precipitation compared to the statistics of the 20-year database, ranging from brown (drier quintile) to deep blue (wetter quintile). The resulting information is presented as information graphic 1 in the monthly report (Senay and others, 2023; https://doi.org/10.5066/P90J1426).
-
2. PEAC 4/8-inch index.—For several decades, the PEAC provided regular experimental updates on the status of precipitation, coastal flooding, and storminess in the U.S.-Affiliated Pacific Islands (see all reports at https://www.weather.gov/peac/update). Their research effort identified two values of rainfall (4 and 8 inches [in.]) associated with drought risk as follows: “Although research is ongoing, some rough threshold amounts for drought impact include: (1) at least 8 inches of rain per month is needed to sustain and/or replenish municipal and home rain catchment systems, sustain and/or replenish municipal surface and groundwater supplies, provide for adequate stream flow on high islands, and greatly reduce the risk of wildfire; and, (2) threats to agriculture, the occurrence of wildfires and unacceptable drawdown of rain catchments and shallow dug wells rise sharply with monthly rainfall less than 4 inches.” (PEAC, 2015, p. 13). By 2016, these threshold numbers were in routine use in the PEAC updates. Although the predictive accuracy of these two numbers has not been demonstrated, a community of disaster, water security, and food security managers have become accustomed to them. These numbers are applied regardless of location or month. Thus, a colorized indicator using these threshold values was applied; monthly precipitation less than 4 in. was colored red, 4.1–8 in. was colored yellow, and greater than 8.1 in. was colored dark green. The resulting information is presented in the right panel of information graphic 3 in the monthly report (Senay and others, 2023; https://doi.org/10.5066/P90J1426).
Importantly, the two indices may not always agree. The rainfall index indicates how typical the month’s precipitation was compared to the 20-year record for that location and month. For the rainfall index, low levels of precipitation at a typically dry location and (or) typically dry month may be at or near median levels and thus be categorized as typical. In contrast, precipitation less than 8 or 4 in. would be categorized as “concerning” using the PEAC criteria, regardless of whether those precipitation amounts would be typical or unusual at that location or month. Therefore, it is likely that for some locations, months, or both, the rainfall index may indicate typical conditions whereas the PEAC index may indicate low levels of precipitation.
Developing the Layout for the Report Template
At the core of the monthly report are two estimated precipitation values, two colorized rainfall indicators, and a bar graph with recent months’ precipitation history. This information is delivered in multiple ways that provide different quick-look summaries of the precipitation status. Internet connectivity in the Marshall Islands at times is unstable or limited by bandwidth (Okuda and others, 2018); thus, we sought to maximize ability to communicate by minimizing file size of the report by developing relatively dense graphics. The layout evolved during the 1-year co-production partnership through cycles of production, evaluation, and refinement. Here, we describe the content and layout of the monthly report that is available (Senay and others, 2023; https://doi.org/10.5066/P90J1426). Information graphics in the report are numbered to facilitate the co-production process and are referenced here:
-
• In report information graphic 1, the data for all locations are summarized in an alphabetically sorted table that includes the following data:
-
o Location.—The report included 23 atolls and islands and the table has 23 rows, 1 for each location.
-
o 20-year median, in inches.—This is derived from the IMERG Final Run database from 2001 to 2020 and monthly values for each location (Senay and others, 2022).
-
o Current estimate, in inches.—In the example, this is December 2022. This is the monthly sum of daily IMERG Late Run values for each location (Senay and others, 2022).
-
o Categorical coloring of quintiles from the 20-year database for visual impact.
-
o Indicator (magenta squares) rank of current month as it relates to the 20-year history.
-
-
• In report graphic 2, the three panels give a visual representation of patterns of precipitation during the reporting period. The IMERG precipitation for the reporting period was divided into 3 dekads (early month [days 1–10], mid-month [days 11–20], and late month [day 21 to the last day]). Lightest areas received the least precipitation, and the color scale runs up to dark blue for the areas that received the most precipitation.
-
• Report graphic 3 presents maps summarizing the two rainfall indices (as described in the “Developing the Report Content” section). The left panel is the rainfall index, in which the color associated with the quintile from graphic 1 is transferred into map format for all locations. The right panel is a map that depicts estimated precipitation using colors assigned to the PEAC thresholds.
-
• Finally, report graphic 4 presents a set of graphs, one for each location, that has greater detail regarding the recent precipitation history. That graph includes the following data:
-
o Location.—The report included 23 atolls and islands; thus, every month includes 23 graphs, 1 for each location.
-
o 20-year median, in inches.—This was derived from the IMERG Final Run database from 2001 to 2020 and monthly values for each location (Senay and others, 2022). These are the same median values as reported in the alphabetical report graphic 1.
-
o Current estimate, in inches.—This was the monthly sum of daily IMERG Late Run values for the location (Senay and others, 2022). These are the same values as reported in the alphabetical report graphic 1.
-
o Rainfall index.— This colorized box was included as a quick index of how the current month precipitation compares to the statistics of the 2001–20 precipitation database (Senay and others, 2022). These are the same values as reported in the alphabetical report graphic 1 and rainfall index map in report graphic 3.
-
o PEAC 4/8-inch index.—This colorized box refers to the same set of PEAC thresholds. These are the same values as reported in the PEAC index map in report graphic 3.
-
o History of monthly estimated precipitation, in inches, for the current calendar year.—The layout was consistent with the format in which the U.S. Agency for International Development receives precipitation reports. Estimated precipitation is on the vertical axis, and month of year is on the horizontal axis. The median values from the IMERG Final Run data (2001–20; Senay and others, 2022) are presented in a blue curve. IMERG Late Run monthly estimates for the current year (Senay and others, 2022) are presented in orange bars. Disaster managers have become accustomed to using the PEAC 4/8-inch index; thus, a dotted black line is shown at the 4-in. precipitation level.
-
Summary
During the 1-year project duration, the co-production team transformed satellite estimates of precipitation into a report template containing descriptive summaries, indices, and maps. The reports provided substantial information about estimated precipitation in the Marshall Islands locations for which rain measurements were not available. Additional information about typical precipitation levels was presented for each month and location, along with a time series of precipitation estimates. The information allows users to gain a quick understanding for whether low precipitation levels were persisting and potentially becoming cause for concern. The satellite data and monthly reports are available and could form the basis of an operational system for drought and agricultural managers in the Marshall Islands or could be expanded to include the U.S.-Affiliated Pacific Islands or all of Oceania.
References Cited
Donnegan, J.A., Trimble, S.T., Kusto, K., Kuegler, O., and Hiserote, B.A., 2011, Republic of the Marshall Islands’ forest resources, 2008: Portland, Oreg., U.S. Department of Agriculture, Forest Service, Pacific Northwest Research Station, Resource Bulletin PNW–RB–263, 29 p. [Also available at https://doi.org/10.2737/PNW-RB-263.]
Fosberg, F.R., 1949, Atoll vegetation and salinity: Pacific Science, v. 3, no. 1, p. 89–92. [Also available at http://hdl.handle.net/10125/8918.]
Fosberg, F.R., 1960, The vegetation of Micronesia—1. General descriptions, the vegetation of the Marianas Islands, and a detailed consideration of the vegetation of Guam: Bulletin of the American Museum of Natural History, v. 119, no. 1, 75 p., 40 plates. [Also available at http://hdl.handle.net/2246/1268.]
Golden Gate Weather Services, 2023, El Niño and La Niña years and intensities: Golden Gate Weather Services digital data, accessed February 3, 2023, at https://ggweather.com/enso/oni.htm.
Heim, R.R., Jr., Guard, C., Lander, M.A., and Bukunt, B., 2020, USAPI USDM—Operational drought monitoring in the U.S.-Affiliated Pacific Islands: Atmosphere, v. 11, no. 5, art. 495. [Also available at https://doi.org/10.3390/atmos11050495.]
Keener, V., Helweg, D., Asam, S., Balwani, S., Burkett, M., Fletcher, C., Giambelluca, T., Grecni, Z., Nobrega-Olivera, M., Polovina, J., and Tribble, G., 2018, Hawai'i and U.S.-Affiliated Pacific Islands, chap. 27 of Reidmiller, D.R., Avery, C.W., Easterling, D.R., Kunkel, K.E., Lewis, K.L.M., Maycock, T.K., and Stewart, B.C., eds., Impacts, risks, and adaptation in the United States—Fourth National Climate Assessment, volume II: Washington, D.C., U.S. Global Change Research Program, p. 1242–1308. [Also available at https://doi.org/10.7930/NCA4.2018.CH27.]
Leong, J., Marra, J.J., Finucane, M.L., Giambelluca, T., Merrifield, M., Miller, S.E., Polovina, J., Shea, E., Burkett, M., Campbell, J., Lefale, P., Lipschultz, F., Loope, L., Spooner, D., and Wang, B., 2014, Hawai'i and U.S. Affiliated Pacific Islands, chap. 23 of Melillo, J.M., Richmond, T.C., and Yohe, G.W., eds., Climate change impacts in the United States—The Third National Climate Assessment: U.S. Global Change Research Program, p. 537–556. [Also available at https://doi.org/10.7930/J0W66HPM.]
Manner, H.I., Friday, K.S., Haws, M., and Rufus, L., 2017, Literature review and report—Background information for “Agroforestry in the climate of the Marshall Islands,” extension website, app. A of Haws, M., Final report—Vegetative guide dashboard—Relating traditional atoll agroforestry recommendations to predicted climate and sea level conditions in the Marshall Islands, in Developing an agroforestry dashboard for the Marshall Islands—“Vegetative guide & dashboard” relating traditional atoll agroforestry recommendations to predict climate and sea level conditions in the Marshall Islands: U.S. Geological Survey data release, accessed February 3, 2023, at https://www.sciencebase.gov/catalog/item/537bafe0e4b0929ba498b965.
Ministry of Natural Resources and Commerce, 2021, Republic of the Marshall Islands Forest Action Plan 2020–2030: Ministry of Natural Resources and Commerce, 38 p., accessed February 3, 2023, at https://www.stateforesters.org/districts/republic-of-the-marshall-islands/.
National Aeronautics and Space Administration, 2023, IMERG—Integrated Multi-satellitE Retrievals for GPM: National Aeronautics and Space Administration digital data, accessed March 9, 2023, at https://gpm.nasa.gov/data/imerg.
Okuda, A., Vakataki ‘Ofa, S., Roeder. E., Kravchenko, A., Marand, J., and Mbengue, M., 2018, Broadband connectivity in Pacific island countries: United Nations Economic and Social Commission for Asia and the Pacific, Asia-Pacific Information Superhighway (AP–IS) Working Paper Series, 84 p., accessed February 3, 2023, at https://www.unescap.org/sites/default/files/PACIFIC_PAPER_Final_Publication_1_1.pdf.
Pacific ENSO Applications Climate Center [PEAC], 2015, 3rd quarter, 2015: Pacific ENSO Update, v. 21, no. 3, 20 p., accessed February 27, 2023, at https://www.weather.gov/peac/update.
PennState Eberly College of Science, 2023, Identifying outliers (unusual Y values), lesson 9.3 of STAT 462—Applied regression analysis: The Pennsylvania State University web page, accessed January 6, 2023, at https://online.stat.psu.edu/stat462/node/172/.
Physical Sciences Laboratory, 2023, Past events: National Aeronautics and Space Administration, Physical Sciences Laboratory web page, accessed February 3, 2023, at https://psl.noaa.gov/enso/past_events.html.
Sayre, R., Noble, S., Hamann, S., Smith, R., Wright, D., Breyer, S., Butler, K., Van Graafeiland, K., Frye, C., Karagulle, D., Hopkins, D., Stephens, D., Kelly, K., Basher, Z., Burton, D., Cress, J., Atkins, K., Van Sistine, D.P., Friesen, B., Allee, R., Allen, T., Aniello, P., Asaad, I., Costello, M.J., Goodin, K., Harris, P., Kavanaugh, M., Lillis, H., Manca, E., Muller-Karger, F., Nyberg, B., Parsons, R., Saarinen, J., Steiner, J., and Reed, A., 2019, A new 30 meter resolution global shoreline vector and associated global islands database for the development of standardized ecological coastal units: Journal of Operational Oceanography, v. 12, supplement 2, p. S47–S56. [Also available at https://doi.org/10.1080/1755876X.2018.1529714.]
Senay, G.B., Kagone, S., Cecere, T.H., Helweg, D., Nelson, K., and Taylor, J.B., 2022, Satellite precipitation estimates for selected locations in the Republic of the Marshall Islands: U.S. Geological Survey data release, https://doi.org/10.5066/P95ANG3N.
Senay, G.B., Helweg, D., Kagone, S., Taylor, J.B., Cecere, T.H., and Nelson, K., 2023, Monthly satellite-estimated precipitation reports for the Republic of the Marshall Islands: U.S. Geological Survey data release, https://doi.org/10.5066/P90J1426.
Stoddart, D.R., and Walsh, R.P.D., 1992, Environmental variability and environmental extremes as factors in the island ecosystem: Atoll Research Bulletin, v. 356, 71 p. [Also available at https://doi.org/10.5479/si.00775630.356.1. Issued by the Smithsonian Institute, National Museum of Natural History.]
Wairiu, M., Lal, M., and Iese, V., 2012, Climate change implications for crop production in Pacific Islands Region, chap. 5 of Aladjadjiyan, A., ed., Food production—Approaches, challenges, and tasks: Rijeka, Croatia, InTech, p. 67–86. [Also available at https://doi.org/10.5772/33885.]
Webb, E., 2023, Ensemble Oceanic Nino Index (ENS ONI): Eric Webb web page and digital data, accessed February 3, 2023, at https://www.webberweather.com/ensemble-oceanic-nino-index.html.
Western Regional Climate Center, 2023, Station data inventory listings [Coop network=Pacific Islands, State code=MH]: Western Regional Climate Center digital data, accessed January 6, 2023, at https://wrcc.dri.edu/Monitoring/Stations/station_inventory_show.php?snet=coop&sstate=PI.
For more information about this publication, contact:
Director, USGS Earth Resources Observation and Science Center
47914 252nd Street
Sioux Falls, SD 57198
605–594–6151
For additional information, visit: https://www.usgs.gov/centers/eros
Publishing support provided by the
Rolla Publishing Service Center
Disclaimers
Any use of trade, firm, or product names is for descriptive purposes only and does not imply endorsement by the U.S. Government.
Although this information product, for the most part, is in the public domain, it also may contain copyrighted materials as noted in the text. Permission to reproduce copyrighted items must be secured from the copyright owner.
Suggested Citation
Senay, G.B., Helweg, D.A., Kagone, S., Taylor, J.B., Cecere, T., Eastmond, T., Koch, A., Nelson, K., and Rufus, L., 2023, Developing satellite-estimated precipitation monthly reports for selected locations in the Republic of the Marshall Islands: U.S. Geological Survey Data Report 1181, 7 p., https://doi.org/10.3133/dr1181.
ISSN: 2771-9448 (online)
Study Area
| Publication type | Report |
|---|---|
| Publication Subtype | USGS Numbered Series |
| Title | Developing satellite-estimated precipitation monthly reports for selected locations in the Republic of the Marshall Islands |
| Series title | Data Report |
| Series number | 1181 |
| DOI | 10.3133/dr1181 |
| Publication Date | September 18, 2023 |
| Year Published | 2023 |
| Language | English |
| Publisher | U.S. Geological Survey |
| Publisher location | Reston, VA |
| Contributing office(s) | Earth Resources Observation and Science (EROS) Center, National Climate Change and Wildlife Science Center, National Geospatial Program |
| Description | Report: v, 7 p.; 2 Data Releases |
| Country | Republic of the Marshall Islands |
| Online Only (Y/N) | Y |
| Additional Online Files (Y/N) | N |