

Land-Use and Land-Cover Change in the Lower Rio Grande Ecoregions, Texas, 2001–2011
Links
- Document: Report (7.02 MB pdf) , HTML , XML
- Data Release: USGS data release - Data release for land-use and land-cover change in the Lower Rio Grande ecoregions, Texas (2001 to 2006 and 2006 to 2011 time intervals)
- NGMDB Index Page: National Geologic Map Database Index Page (html)
- Download citation as: RIS | Dublin Core
Abstract
Urban growth and other land-use changes were examined in the Lower Rio Grande Valley and Alluvial Floodplain ecoregions in Texas, along the United States-Mexico border. The analysis focused on understanding the types and causes of land change as well as the recovery of natural land-cover types between years 2001 and 2011. The purpose was to develop improved capabilities for understanding land change dynamics in urbanizing ecoregions and to provide data for further analyses. The spatial data, including metadata, allows further exploration and characterization of changes affecting this dynamic region.
Introduction
Urban expansion and associated changes to the surrounding land use and land cover (LULC) are significant contributors to ecoregion change. Urbanization impacts biodiversity, animal migrations, and other ecosystem characteristics across multiple scales that often require new management approaches (McDonald and others, 2008; Howard and Davis, 2009; Alberti, 2010). Urban growth directly replaces natural land cover and prior land uses. Urbanization and related social and economic changes can also cause changes in the surrounding region, such as expansion of intensive agriculture or land conservation to satisfy recreation, aesthetic, or wildlife habitat needs.
Here, we examine land use, land cover, and urban dynamics between 2001 and 2011 in the Lower Rio Grande (LRG) Valley and LRG Alluvial Floodplain ecoregions of Texas, along the southernmost extent of the United States-Mexico border. Urbanization in the LRG was driven by one of the fastest growing metropolitan populations in the United States during the study period (Frey, 2012). This diverse natural landscape is becoming increasingly urban but retains remnants of unique habitats shaped at the convergence of subtropical, temperate, coastal, and desert influences (Griffith and others, 2007).
Examination of the changing balance between development and landscape conservation is relevant to habitat management and policy; however, the necessary temporal information is often difficult to discern from existing LULC data—such as those in the National Land Cover Database (Dewitz and U.S. Geological Survey, 2021)—which are meant for regional-scale analysis rather than site-specific studies of change (Drummond and others, 2015; Homer and others, 2015). Without detailed information about the causes of change, the dynamics of change and elements of landscape recovery across urban landscapes are often lacking (Drummond and others, 2015). Therefore, our efforts focused on using an existing method for the aggregation, revision, and validation of many different existing LULC data to improve the understanding of urbanization and landscape change (Drummond and others, 2017).
In this framework, the dynamics of landscape recovery were given equal consideration to the more common analysis of habitat loss. Changes were also examined to identify the processes and causes of land conversion. As a result, we can better understand the underlying factors and relative importance of the distinct types of change that ultimately impact the southern Texas ecosystem.
Study Area
The Lower Rio Grande (LRG) study area is the combination of two U.S. Environmental Protection Agency (EPA) level IV ecoregions: the Lower Rio Grande Valley (LRG Valley) ecoregion (34e) and the Lower Rio Grande Alluvial Floodplain (LRG Floodplain; ecoregion 34f) (EPA, 2013) (fig. 1). The LRG covers an area of approximately 602,000 hectares (ha) and extends to parts of Cameron, Hidalgo, and Willacy Counties. Urbanization in the LRG region of Texas is predominantly driven by population growth in Hidalgo County’s McAllen-Edinburg-Mission, Texas, Metropolitan Statistical Area (MSA), which was ranked amongst the five fastest growing metropolitan areas during 2001–2004 and 2007–2010 (Frey, 2012). Metropolitan population growth for Cameron County’s Brownsville-Harlingen, Texas, MSA and the McAllen-Edinburg-Mission MSA both exceeded the percent population growth for Texas and the United States from 2001 to 2011. Population in Cameron, Hidalgo, Willacy, and Starr Counties is expected to more than double between 2003 and 2050 (Knight, 2009).
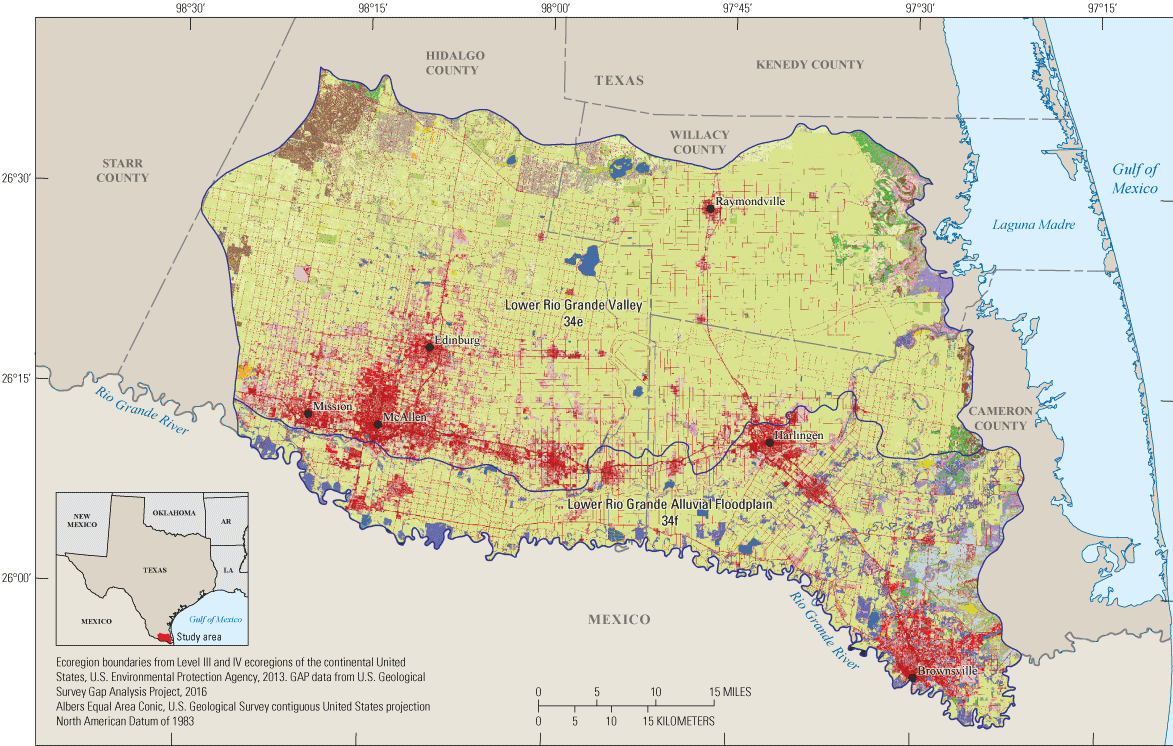
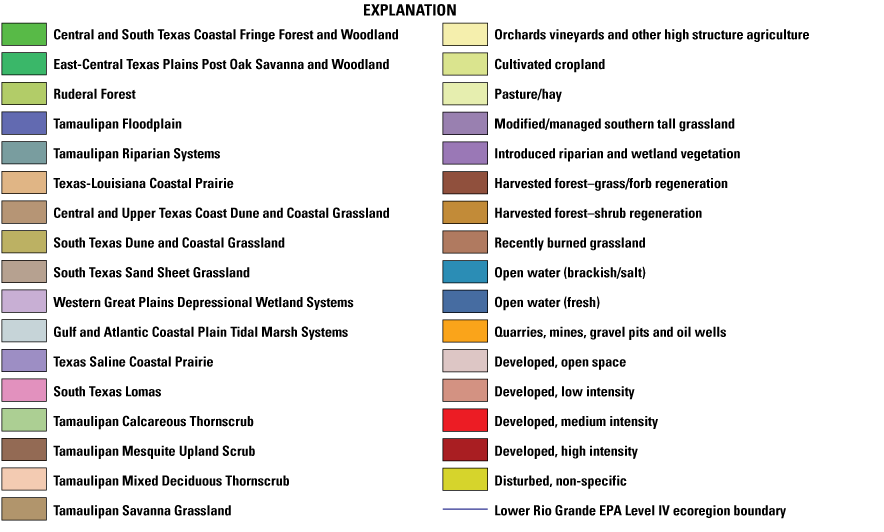
Map of the study area and the two U.S. Environmental Protection Agency (EPA) level IV ecoregions (EPA, 2013) examined—the Lower Rio Grande Valley (34e) and the Lower Rio Grande Alluvial Floodplain (34f). Ecological systems or land use classes according to the U.S. Geological Gap Analysis Project (USGS GAP, 2016) are displayed.
The northern extent of the LRG is largely covered by mesquite and other shrubs, and the southern extent has lost most of its native palm trees and floodplain forests (Griffith and others, 2007; U.S. Geological Survey Gap Analysis Project [USGS GAP], 2016) (fig. 1). The less-developed areas of the LRG Valley are primarily grassland, mesquite, and thornscrub (USGS GAP, 2016). The LRG Floodplain includes wet-mesic scrub forest, tidal marsh, and saline prairie (USGS GAP, 2016). The Rio Grande, which runs from south-central Colorado to the Gulf of Mexico, forms a natural border with Mexico within the study area; however, its water is mostly diverted for urban use and agricultural irrigation, such that little flow reaches the Gulf of Mexico (Griffith and others, 2007). Protected areas in the study area provide for recreation, wildlife habitat, butterfly migration, and avian stopovers that are an important part of the Central and Mississippi flyways (Griffith and others, 2007).
The LRG is a region of high-value agricultural crops including cotton, grain sorghum, pecans, citrus, sugar cane, vegetables, and melons that have an annual economic impact greater than $1 billion (Texas Water Resources Institute [TWRI], 2012). Agriculture in the drought-prone region requires as much as 85 percent of the area’s water for irrigation, with an increasing share of water resources likely going to future urban growth demands (TWRI, 2012). Urban land development and periodic freezes have diminished the extent and importance of orchards and other cropland in the study area (Knight, 2009).
Methods
A data aggregation, validation, and attribution (AVA) approach (Drummond and others, 2015) was used in the analysis. The approach involved combining available sources of spatial data to create a refined, spatially explicit analysis of landscape change and facilitate the identification of proximate land-use and natural-disturbance causes of change.
Spatial data, including LULC maps and satellite imagery, are increasingly available at the national level and at multiple time steps. To take advantage of this accessibility, the AVA approach combined several thematic LULC change datasets to develop a final dataset. During the analysis, the data were further validated and attributed with land use information using a combination of spatial analysis, decision trees, and manual verification. The characteristics of landscape change were then compiled and summarized using EPA level IV ecoregions (EPA, 2013).
This AVA algorithm was used to step through a series of decisions to identify the type, reliability, and proximate cause of changes to LULC. Changes in LULC that were corroborated by agreement between two or more datasets were labelled as validated. The remaining unvalidated changes or those from only a single data source were analyzed using manual interpretation techniques, primarily by comparing the area of unvalidated change to high-resolution orthoimagery to determine if the change occurred. LULC datasets produced to date with this approach have an overall accuracy level of 95 percent. The algorithm methods and data are standardized and described in detail in Drummond and others (2015).
The causes of change were divided into three broad categories to aid the interpretation of the types of land change processes occurring in the study area: (1) replacement processes that resulted in the conversion of prior LULC due to built-up land uses and land clearance; (2) recurrent processes that were primarily the result of natural disturbance but included cyclical water reservoir drawdown caused by human action; and (3) recovery processes such as land reclamation, tree planting, and other human activities that resulted in recovery of prior ecological or aesthetic function. The spatial data and metadata with a full description of the methodology are available in the data release associated with this report, “Data release for land-use and land-cover change in the Lower Rio Grande ecoregions, Texas (2001 to 2006 and 2006 to 2011 time intervals)” (Drummond and others, 2024).
Findings—Summary of Land-Use and Land-Cover Change in the Lower Rio Grande Ecoregions
Land-cover totals are summarized for each of the Lower Rio Grande (LRG) ecoregions in table 1. The largest absolute changes between 2001 and 2011 occurred in agriculture (pasture/hay and cultivated crops land-cover types), which decreased by 11,022 ha. Within the agricultural classes between 2001 and 2011, cultivated crop cover decreased by 2.7 percent and pasture/hay lands decreased by 3.9 percent. Developed land cover (low-, medium-, and high-intensity developed and open space) also had a large change, increasing by approximately 9,966 ha. Within the developed classes, open space increased by 8 percent, and all other developed classes increased by 10.1 percent. Other land-cover changes included a 2.9 percent (1,777 ha) increase in shrubland, a 4.6 percent (−1,221 ha) decrease in grassland, and a 1 percent (−207 ha) decrease in wetland types. Temporal land-cover change for a portion of the LRG is shown in figure 2.
Table 1.
Land-cover types and approximate extent of change in hectares for the Lower Rio Grande (LRG) ecoregions for years 2001–2011.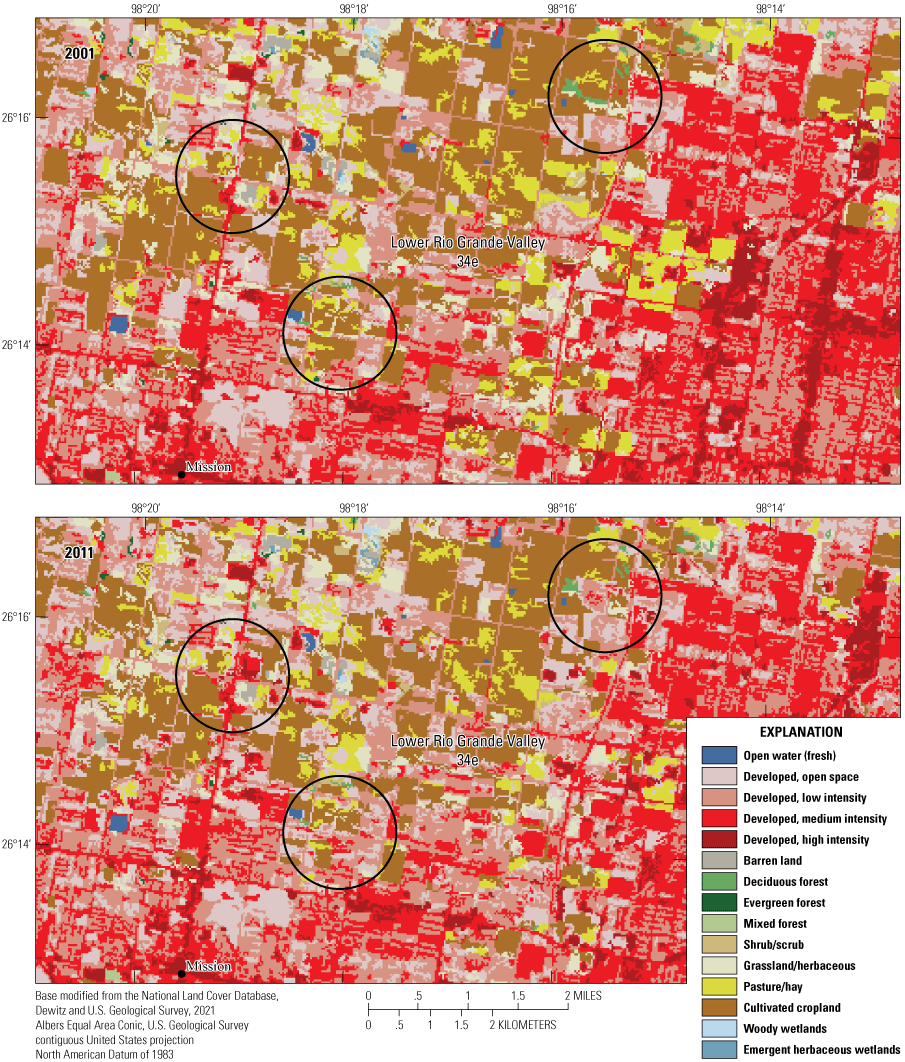
Land cover for an area northeast of Mission, Texas, for the years 2001 and 2011. Black circles highlight examples of the predominant land-cover changes in this portion of the study area—urban area infill and urban expansion at the expense of agricultural land.
The spatial location and causes of land-use and land-cover change are shown in figure 3. For the combined 2001 to 2006 and 2006 to 2011 time intervals, identified replacement processes (13 total) affected 13,748 ha (table 2). Recurrent processes (five total) affected 2,196 ha. Recovery processes (seven total) affected 5,057 ha.
Urban growth was the most extensive type of change in the study area and increased by 9.4 percent between 2001 and 2011 (table 1). The study identified 9,788 ha of new urbanization (table 2). An additional 92 ha were cleared for urbanization in the 2006 to 2011 time-interval. A total of 1,518 ha of urban intensification between 2001 and 2011 are primarily infill within the existing urban area.
Mining reclamation accounted for 315 ha of land recovery (table 2). Expansion of oil and gas pads in the northwest part of the study area is relatively small in total extent but affects a larger area as part of a development network of roads and site pads (fig. 3).
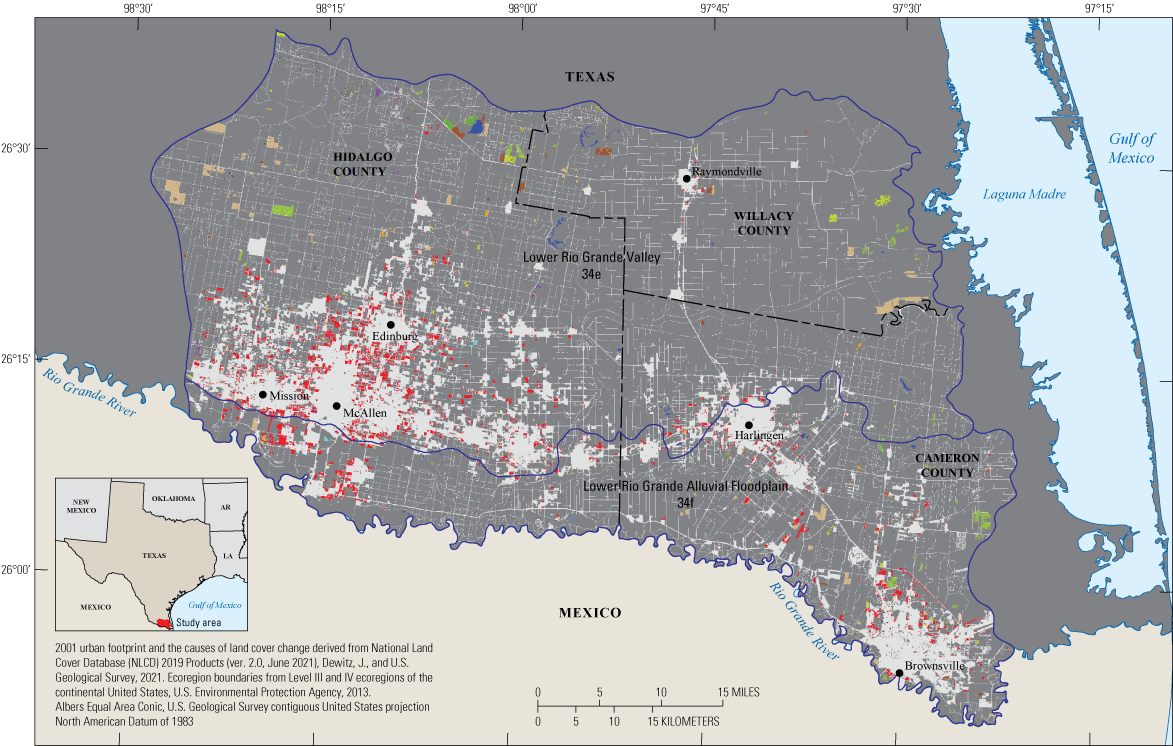
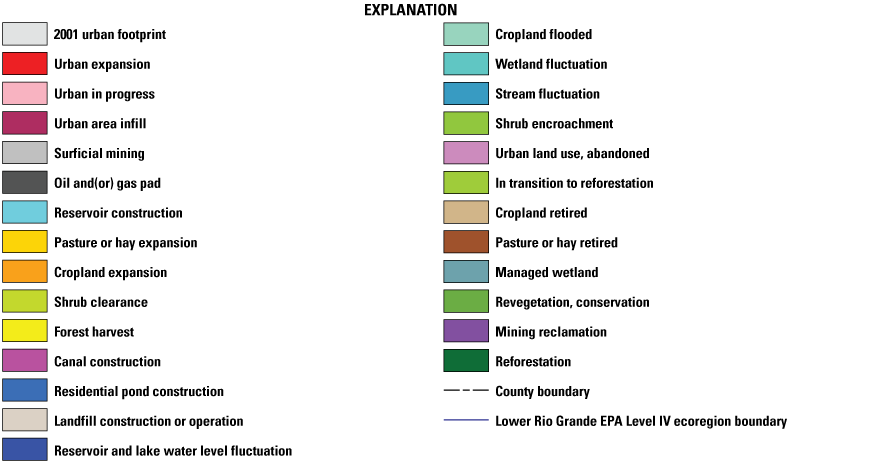
Urban growth and other causes of landscape change in the Lower Rio Grande Valley (34e) and Lower Rio Grande Alluvial Floodplain (34f) between 2001 and 2011.
Table 2.
Land-use causes and extent of change in hectares for the study area, 2001–2011.Table 3.
Total study area land-use and land-cover (LULC) conversions for 2001–2006 and 2006–2011, for conversions greater than 100 hectares (ha).When considering land-cover conversions greater than 100 ha, more than 3,500 ha were converted from agricultural land cover (pasture/hay and cultivated crops cover types) to natural cover types (grassland/herbaceous, shrub/scrub, and barren land) through processes of habitat recovery (table 3). Most of the land-cover conversion to development occurred on former agricultural land.
Conclusion
Examination of land-use and land-cover (LULC) change in the Lower Rio Grande Valley and Alluvial Floodplain ecoregions in southern Texas between 2001 and 2011 using the data aggregation, validation, and attribution approach to LULC analyses allowed identification of the types of LULC change and the causes of land conversion. The study gave equal focus to not only land-cover change from habitat loss but also to identification of the processes of recovery to natural land cover. Understanding of the processes of landscape recovery in urbanizing ecoregions, along with habitat loss, may be beneficial to habitat management and policy.
References Cited
Alberti, M., 2010, Maintaining ecological integrity and sustaining ecosystem function in urban areas: Current Opinion in Environmental Sustainability, v. 2, no. 3, p. 178–184, accessed March 18, 2022, at https://doi.org/10.1016/j.cosust.2010.07.002.
Dewitz, J., and U.S. Geological Survey, 2021, National Land Cover Database (NLCD) 2019 Products (ver. 2.0, June 2021): U.S. Geological Survey data release, accessed June 2021, at https://doi.org/10.5066/P9KZCM54.
Drummond, M.A., Griffith, G.E., Auch, R.F., Stier, M.P., Taylor, J.L., Hester, D.J., Riegle, J.L., and McBeth, J.L., 2017, Understanding recurrent land use processes and long-term transitions in the dynamic south-central United States, c. 1800 to 2006: Land Use Policy, v. 68, p. 345–354, accessed March 24, 2022, at https://doi.org/10.1016/j.landusepol.2017.07.061.
Drummond, M.A., Stier, M.P., Auch, R.F., Taylor, J.L., Griffith, G.E., Riegle, J.L., Hester, D.J., Soulard, C.E., and McBeth, J.L., 2015, Assessing landscape change and processes of recurrence, replacement, and recovery in the Southeastern Coastal Plains, USA: Environmental Management, v. 56, no. 5, p. 1252–1271, accessed March 24, 2022, at https://doi.org/10.1007/s00267-015-0574-1.
Drummond, M.A., Stier, M.P., and McBeth, J.L., 2024, Data release for land-use and land-cover change in the Lower Rio Grande ecoregions, Texas (2001 to 2006 and 2006 to 2011 time intervals): U.S. Geological Survey data release, accessed March 2024, at https://doi.org/10.5066/P9TSG892.
Frey, W., 2012, Population growth in metro America since 1980: Putting the volatile 2000s in perspective: Metropolitan Policy Program at Brookings, 28 p., accessed February 28, 2018, at https://www.brookings.edu/articles/population-growth-in-metro-america-since-1980-putting-the-volatile-2000s-in-perspective/.
Griffith, G.E., Bryce, S.B., Omernik, J.M., and Rogers, A., 2007, Ecoregions of Texas: Texas Commission on Environmental Quality, 125 p., accessed March 18, 2022, at https://texashistory.unt.edu/ark:/67531/metapth640838/.
Homer, C.G., Dewitz, J.A., Yang, L., Jin, S., Danielson, P., Xian, G., Coulston, J., Herold, N.D., Wickham, J.D., and Megown, K., 2015, Completion of the 2011 National Land Cover Database for the conterminous United States— Representing a decade of land cover change information: Photogrammetric Engineering and Remote Sensing, v. 81, no. 5, p. 345–354.
Howard, E., and Davis, A.K., 2009, The fall migration flyways of monarch butterflies in eastern North America revealed by citizen scientists: Journal of Insect Conservation, v. 13, no. 3, p. 279–286, March 2022, at https://doi.org/10.1007/s10841-008-9169-y.
Knight, L., 2009, A field guide to irrigation in the Lower Rio Grande Valley: Texas Department of Transportation Historical Studies Report No. 2009-01, 288 p., accessed March 18, 2022, at https://www.txdot.gov/inside-txdot/division/environmental/compliance-toolkits/historic-resources.html.
McDonald, R.I., Kareiva, P., and Forman, R.T., 2008, The implications of current and future urbanization for global protected areas and biodiversity conservation: Biological Conservation, v. 141, no. 6, p. 1695–1703, accessed March 24, 2022, at https://doi.org/10.1016/j.biocon.2008.04.025.
Texas Water Resources Institute [TWRI], 2012, Rio Grande Basin Initiative fact sheet: Texas A&M University, College Station, Texas, 2 p., accessed August 14, 2015, at http://riogrande.tamu.edu/media/278362/rio_grande_basin_initiative_4.2012.pdf.
U.S. Environmental Protection Agency [EPA], 2013, Level III and IV ecoregions of the continental United States: U.S. Environmental Protection Agency, Corvallis, Oregon, accessed March 24, 2022, at https://www.epa.gov/eco-research/level-iii-and-iv-ecoregions-continental-united-states.
U.S. Geological Survey Gap Analysis Project [USGS GAP], 2016, GAP/LANDFIRE National Terrestrial Ecosystems 2011: U.S. Geological Survey data release, accessed March 24, 2022, at https://doi.org/10.5066/F7ZS2TM0.
Disclaimers
Any use of trade, firm, or product names is for descriptive purposes only and does not imply endorsement by the U.S. Government.
Although this information product, for the most part, is in the public domain, it also may contain copyrighted materials as noted in the text. Permission to reproduce copyrighted items must be secured from the copyright owner.
Suggested Citation
Drummond, M.A., Stier, M.P., and McBeth, J.L., 2024, Land-use and land-cover change in the Lower Rio Grande Ecoregions, Texas, 2001–2011: U.S. Geological Survey Data Report 1185, 11 p., https://doi.org/10.3133/dr1185.
ISSN: 2771-9448 (online)
Study Area
| Publication type | Report |
|---|---|
| Publication Subtype | USGS Numbered Series |
| Title | Land-use and land-cover change in the Lower Rio Grande Ecoregions, Texas, 2001–2011 |
| Series title | Data Report |
| Series number | 1185 |
| DOI | 10.3133/dr1185 |
| Publication Date | April 01, 2024 |
| Year Published | 2024 |
| Language | English |
| Publisher | U.S. Geological Survey |
| Publisher location | Reston VA |
| Contributing office(s) | Geosciences and Environmental Change Science Center |
| Description | iv, 11 p. |
| Country | United States |
| State | Texas |
| Other Geospatial | Lower Rio Grande |
| Online Only (Y/N) | Y |