

Water-Level Data for the Albuquerque Basin and Adjacent Areas, Central New Mexico, Period of Record Through September 30, 2022
Links
- Document: Report (3.88 MB pdf) , HTML , XML
- Data Release: USGS water data for the Nation - U.S. Geological Survey National Water Information System database
- NGMDB Index Page: National Geologic Map Database Index Page (html)
- Download citation as: RIS | Dublin Core
Abstract
The Albuquerque Basin, located in central New Mexico, is about 100 miles long and 25–40 miles wide. The basin is hydrologically defined as the extent of consolidated and unconsolidated deposits of Tertiary and Quaternary age that encompasses the structural Rio Grande Rift between San Acacia to the south and Cochiti Lake to the north. Drinking-water supplies throughout the basin were obtained primarily from groundwater resources until December 2008, when the Albuquerque Bernalillo County Water Utility Authority (ABCWUA) began treatment and distribution of surface water from the Rio Grande through the San Juan-Chama Drinking Water Project.
An initial network of wells was established by the U.S. Geological Survey (USGS) in cooperation with the City of Albuquerque from April 1982 through September 1983 to monitor changes in groundwater levels throughout the Albuquerque Basin. In 1983, this network consisted of 6 wells with analog-to-digital recorders and 27 wells where water levels were measured monthly. As of water year 2022, the network consisted of 120 wells and piezometers at 54 locations. The USGS, in cooperation with the ABCWUA, the New Mexico Office of the State Engineer, and Bernalillo County, measures water levels at the wells and piezometers in the network; this report, prepared in cooperation with the ABCWUA, presents water-level data collected by USGS personnel at the sites through water year 2022 (October 1, 2021, through September 30, 2022). Water-level data that were collected in previous water years from wells that were later discontinued were published in previous USGS reports.
Introduction
The Albuquerque Basin, located in central New Mexico, is about 100 miles long and 25–40 miles wide (fig. 1). The basin is defined as the extent of consolidated and unconsolidated deposits of Tertiary and Quaternary age that encompasses the structural Rio Grande Rift (Thorn and others, 1993). The basin is approximately bisected by the southward-flowing Rio Grande, the only perennial stream extending through the length of it. The study area, which includes the Albuquerque Basin and adjacent areas, extends from just upstream from Cochiti Lake south to San Acacia and from near Tijeras Canyon west to near the intersection of Interstate 40 and the Bernalillo-Cibola County line.
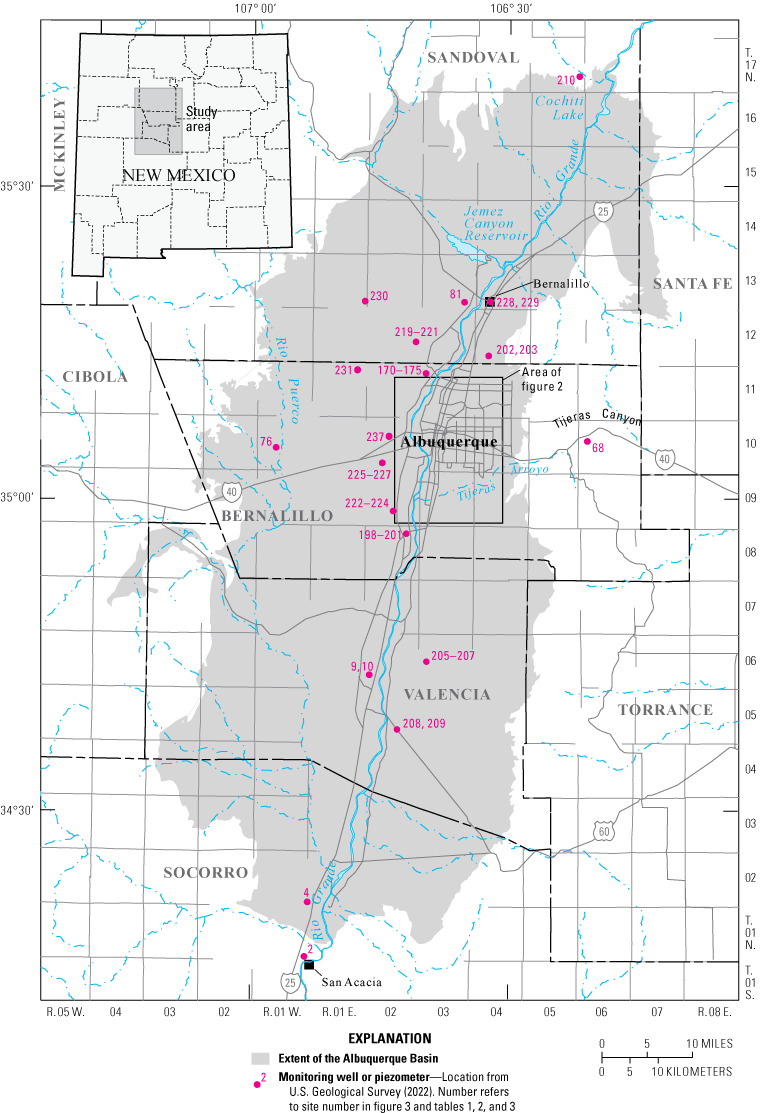
Location of the study area and active monitoring wells and piezometers in and adjacent to the Albuquerque Basin, central New Mexico.
In 2000, the population of the Albuquerque metropolitan area (including portions of Bernalillo, Sandoval, Torrance, and Valencia Counties) was 729,649. Between 2000 and 2010, the population increased approximately 22 percent to 887,077, and from 2010 to 2020, the population increased by approximately 3.3 percent to 916,528 (U.S. Census Bureau, 2023). The majority of the population is concentrated within the city limits of Albuquerque, and the Albuquerque Bernalillo County Water Utility Authority (ABCWUA) provides service to approximately 650,000 water users (ABCWUA, 2023).
Prior to 2008, drinking water in the Albuquerque Basin was primarily sourced from groundwater, resulting in an increase in groundwater withdrawals as population increased (ABCWUA, 2016). Since 2008, groundwater sourced for drinking water has been supplemented with surface water by the San Juan-Chama Drinking Water Project, along with water reuse and reclamation projects (ABCWUA, 2016). The San Juan-Chama Drinking Water Project is a diversion project that imports surface water from the headwaters of the San Juan River in the Colorado River Basin to the Rio Grande Basin (ABCWUA, 2016).
An initial network of wells was established by the U.S. Geological Survey (USGS) in cooperation with the City of Albuquerque from April 1982 through September 1983 to monitor changes in groundwater levels throughout the Albuquerque Basin. In 1983, this groundwater monitoring network consisted of 6 wells with analog-to-digital recorders and 27 wells where water levels were measured monthly. Since the initial installation, additional wells and piezometers1 have been added to the network; as of the 2022 water year, there are 120 wells and piezometers at 54 locations (tables 1, 2, and 3). Of the current wells and piezometers, 60 are equipped with continuously recording data loggers (table 2); 56 are measured discretely semiannually, quarterly, or every 2–3 months with a steel or electric tape (table 1); and 4 have both discrete and continuous groundwater-level measurements recorded and published (table 3). Discrete measurements are also collected at sites with data loggers but are not shown in this report with the exception of those from sites 42–45 (table 3), which have more than 10 years of discrete measurements prior to the installation of continuously recording data loggers. Discrete measurements collected at sites equipped with data loggers are generally used for calibration and correction of water levels because of inaccuracies resulting from drift, hysteresis, temperature effects, and offsets (Cunningham and Schalk, 2011).
A piezometer is a specialized well screened at a specific depth in an aquifer, often of small diameter and nested with other piezometers screened at different depths.
Table 1.
Data for wells and piezometers active in water year 2022 in and adjacent to the Albuquerque Basin, central New Mexico, at which discrete water levels were measured with a steel or electric tape.[USGS, U.S. Geological Survey; --, no data or not applicable. Latitude and longitude are in decimal degrees and in conformance with the North American Datum of 1983. Discontinuity in numbering sequence is due to wells omitted from this report because of lack of recent data collection. Data from discontinued wells can be seen in previous USGS open-file reports and data series (Kues, 1987; Rankin, 1994, 1996, 1998, 1999, 2000; DeWees, 2001, 2002, 2003, 2006; Beman, 2007, 2008, 2009, 2011, 2012, 2013, 2014, 2015, 2020; Beman and Torres, 2010; Beman and Bryant, 2016; Beman and others, 2019; Ritchie and Galanter, 2019; Jurney and Bell, 2021; Bell and Montero, 2022.)]
Table 2.
Data for wells and piezometers active in water year 2022 in and adjacent to the Albuquerque Basin, central New Mexico, at which water levels were measured with continuously recording data loggers.[USGS, U.S. Geological Survey; --, no data or not applicable. Latitude and longitude are in decimal degrees and in conformance with the North American Datum of 1983. Discontinuity in numbering sequence is due to wells omitted from this report because of lack of recent data collection. Data from discontinued wells can be seen in previous USGS open-file reports and data series (Kues, 1987; Rankin, 1994, 1996, 1998, 1999, 2000; DeWees, 2001, 2002, 2003, 2006; Beman, 2007, 2008, 2009, 2011, 2012, 2013, 2014, 2015, 2020; Beman and Torres, 2010; Beman and Bryant, 2016; Beman and others, 2019; Ritchie and Galanter, 2019; Jurney and Bell, 2021; Bell and Montero, 2022).]
Table 3.
Data for wells and piezometers active in water year 2022 in and adjacent to the Albuquerque Basin, central New Mexico, at which continuous (hourly) water-level data were collected with continuously recording data loggers and at which discrete water levels measured using steel or electric tapes were published.[USGS, U.S. Geological Survey; --, no data or not applicable. Latitude and longitude are in decimal degrees and in conformance with the North American Datum of 1983. Discontinuity in numbering sequence is due to wells omitted from this report because of lack of recent data collection. Data from discontinued wells can be seen in previous USGS open-file reports and data series (Kues, 1987; Rankin, 1994, 1996, 1998, 1999, 2000; DeWees, 2001, 2002, 2003, 2006; Beman, 2007, 2008, 2009, 2011, 2012, 2013, 2014, 2015, 2020; Beman and Torres, 2010; Beman and Bryant, 2016; Beman and others, 2019; Ritchie and Galanter, 2019; Jurney and Bell, 2021; Bell and Montero, 2022).]
The USGS, in cooperation with the ABCWUA, the New Mexico Office of the State Engineer (NMOSE), and Bernalillo County, measures water levels in the wells and piezometers in the groundwater monitoring network (tables 1, 2, and 3); this report, prepared in cooperation with the ABCWUA, presents water-level data collected by USGS personnel at the sites through water year 2022 (October 1, 2021, through September 30, 2022). The locations of the active monitoring wells in the Albuquerque Basin and adjacent areas are shown in figure 1, and the locations of those within the Albuquerque metropolitan area are shown in figure 2. The data presented in this report are available in the USGS National Water Information System (USGS, 2022).
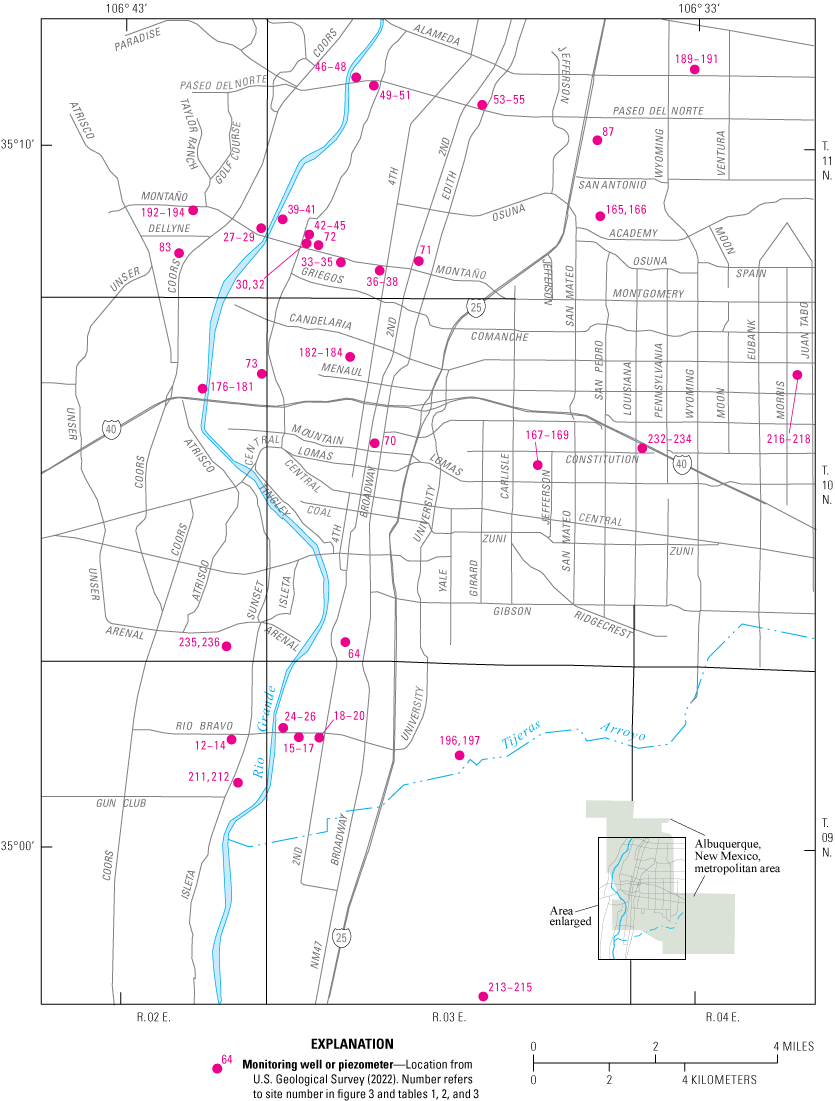
Location of active monitoring wells and piezometers within the Albuquerque, New Mexico, metropolitan area.
Purpose and Scope
The purpose of this report is to present water-level data collected from the groundwater monitoring network in the Albuquerque Basin and adjacent areas during the 2022 water year (October 1, 2021, through September 30, 2022). Measurements at certain wells have been discontinued for various reasons; water-level data that were collected from those wells in previous water years can be found in previous USGS reports (Kues, 1987; Rankin, 1994, 1996, 1998, 1999, 2000; DeWees, 2001, 2002, 2003, 2006; Beman, 2007, 2008, 2009, 2011, 2012, 2013, 2014, 2015, 2020; Beman and Torres, 2010; Beman and Bryant, 2016; Beman and others, 2019; Ritchie and Galanter, 2019; Jurney and Bell, 2021; Bell and Montero, 2022).
Methods
Water-level measurements were collected from the groundwater monitoring network during the 2022 water year by following standard USGS protocols for discrete and continuous water-level measurements using steel or electric tapes and continuously recording data loggers (Cunningham and Schalk, 2011). Discrete measurements are collected at 55 of the sites (table 1); of these, 49 sites (2, 4, 9, 10, 12–20, 24–30, 32–41, 46–51, 53–55, 68, 70–73, 76, 81, 83, 87, 229, and 237) are monitored semiannually, 2 sites (230, and 231) are monitored quarterly, and 4 sites (218, 222–224) are monitored every 2–3 months. At 60 of the sites (64, 165–184, 189–194, 196–203, 205–217, 219–221, 225–228, and 232–236; table 2), pressure transducers and data loggers are used to collect continuous (hourly) water-level data. At 4 of the sites, (42–45; table 3), discrete and continuous data are both collected and published, with discrete data being collected at a frequency of every 2–3 months.
Water-Level Data
The continuous and discrete water-level data collected from the groundwater monitoring network in the Albuquerque Basin and adjacent areas during the 2022 water year are published online through the National Water Information System (USGS, 2022). Descriptive data for the groundwater monitoring network are listed in tables 1, 2, and 3 and include site number, number of the figure on which the well location is shown, USGS site number, local identifier, other identifier (if applicable), latitude and longitude, well depth, and screened interval. In figure 3, hydrographs presenting discrete and (or) continuous water-level data collected by the USGS at these sites include water level in feet below land surface and water level in feet above the North American Vertical Datum of 1988 (NAVD 88). Elevation values are rounded to the nearest foot. Because of the rounding, elevation discrepancies between this report and the National Water Information System (NWIS) database are possible. In addition, ongoing vertical and horizontal datum updates in NWIS may create elevation, latitude, and longitude discrepancies between this report and the NWIS database. Data in hydrographs from wells that have continuous (hourly) recorders are shown by solid lines that represent daily mean water levels. Data gaps that are evident in some of the continuous hydrographs may be caused by equipment malfunction or removal of spurious data during the review and approval process. In hydrographs that present data from discretely measured wells, dashed lines connect symbols (“+”) that represent the discrete measurements. In hydrographs showing discretely measured piezometers that are nested (more than one trace per graph), the symbols were removed to make the hydrographs easier to read.
Two hydrographs present data for sites 42–45 and for site 229 (table 3): one showing continuous water-level data and one showing discrete water-level measurements (fig. 3). The period of record for discrete measurements is much longer than that of continuous data in some locations, such as sites 42–45, which have more than 10 years of discrete measurements prior to the installation of continuously recording data loggers. For those wells, both hydrographs have been included to ensure that all data are presented. The transducers and data loggers were removed from sites 222–224 in 2014, but discrete measurements have continued to be collected and published at those sites since that time
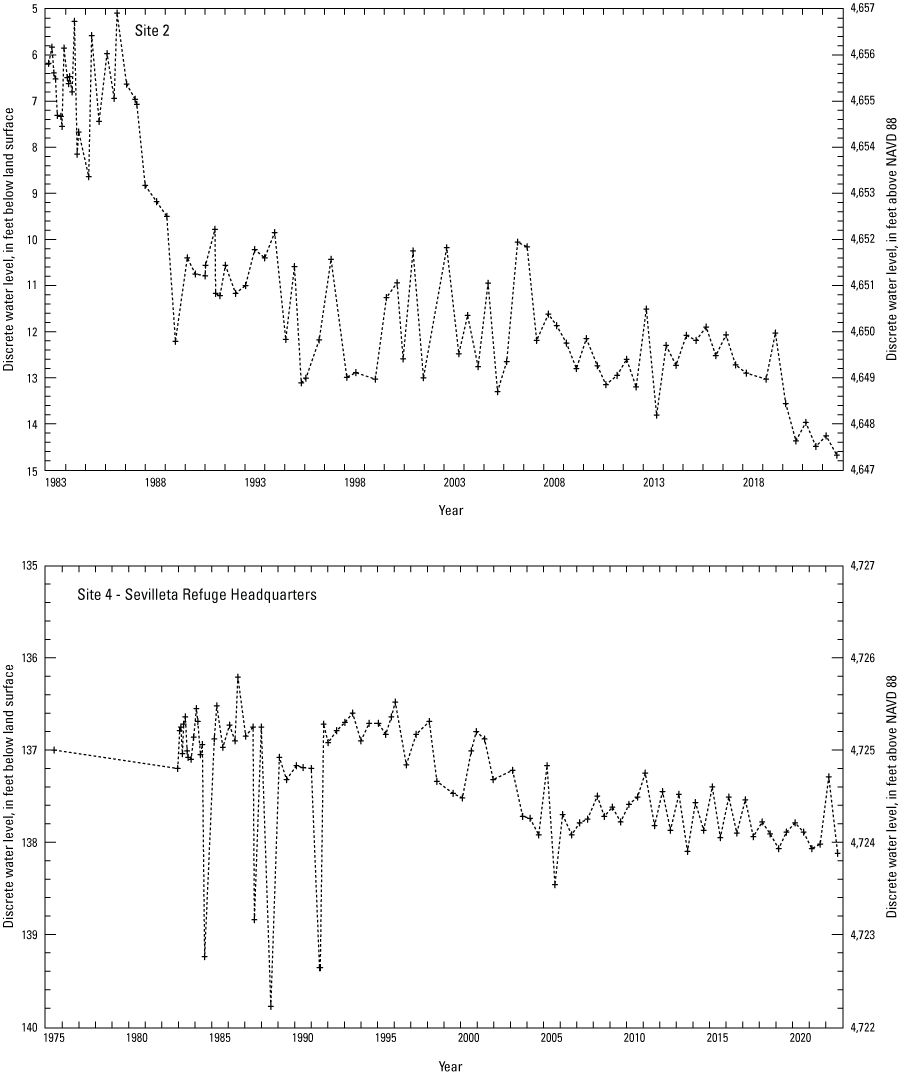
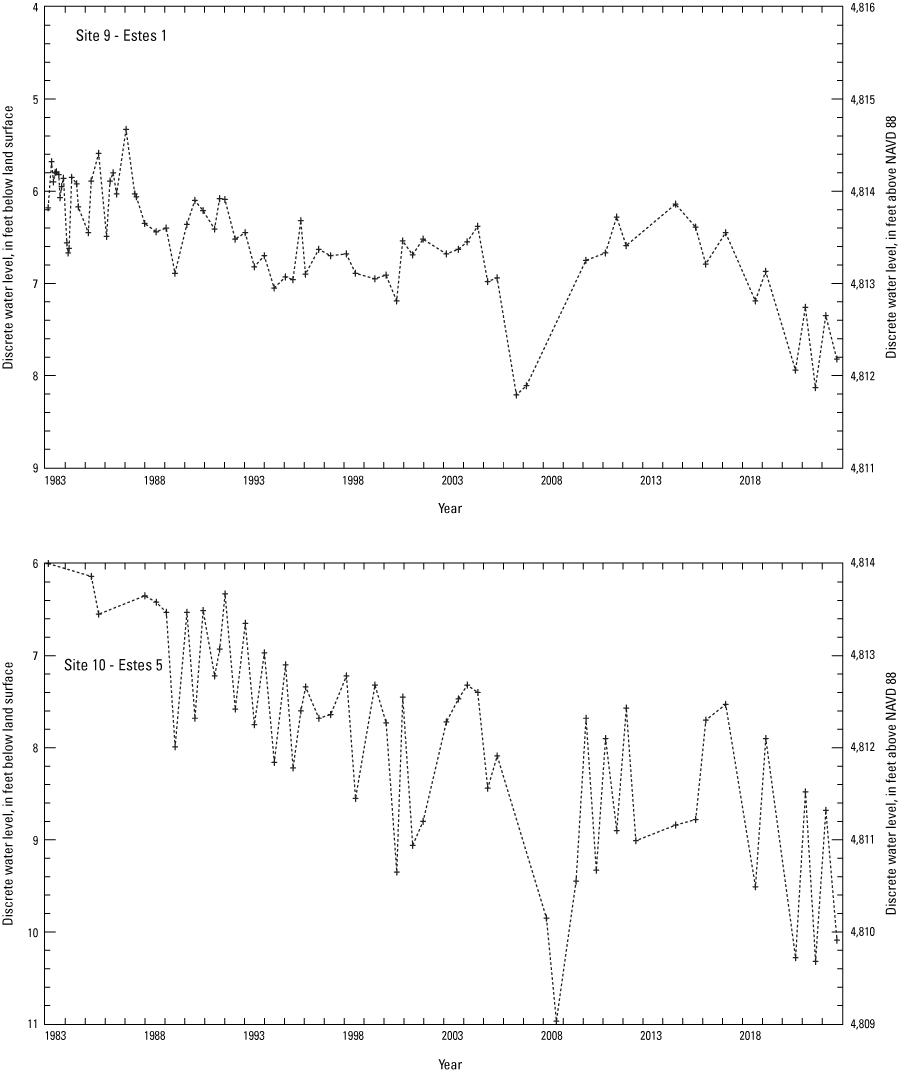
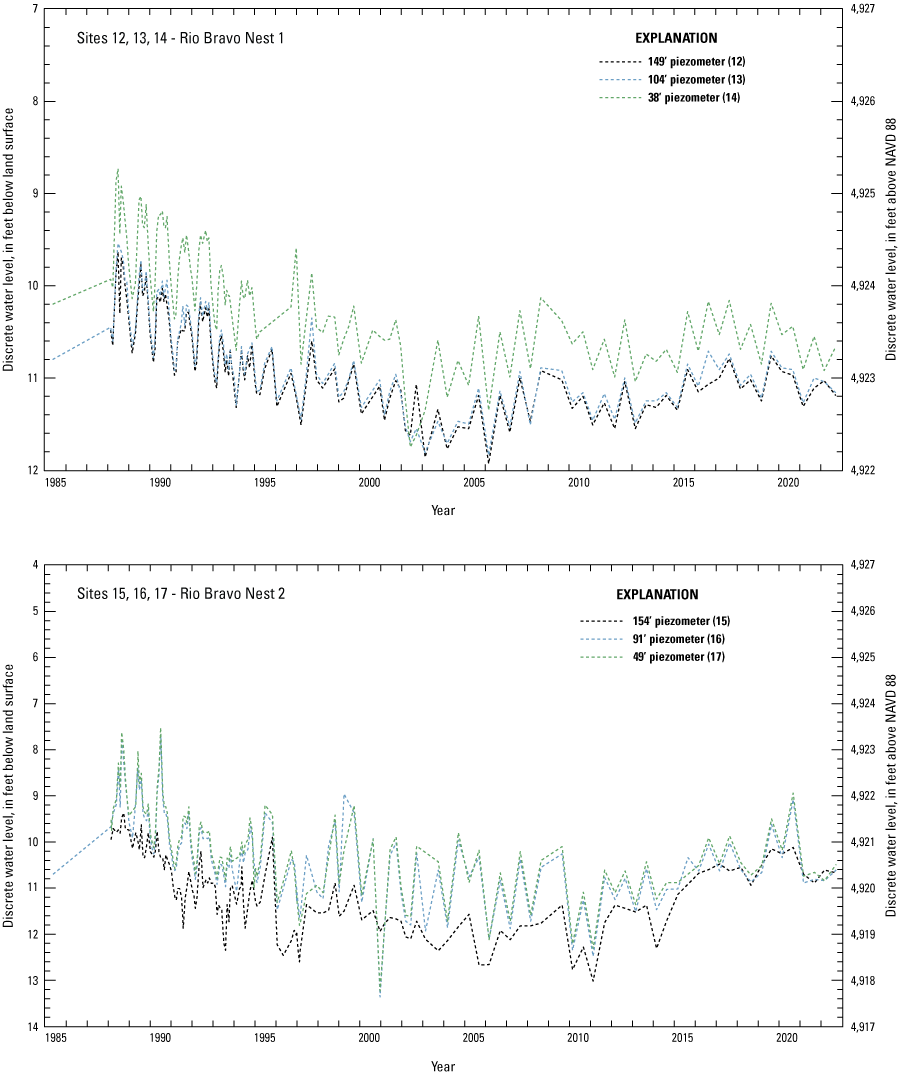
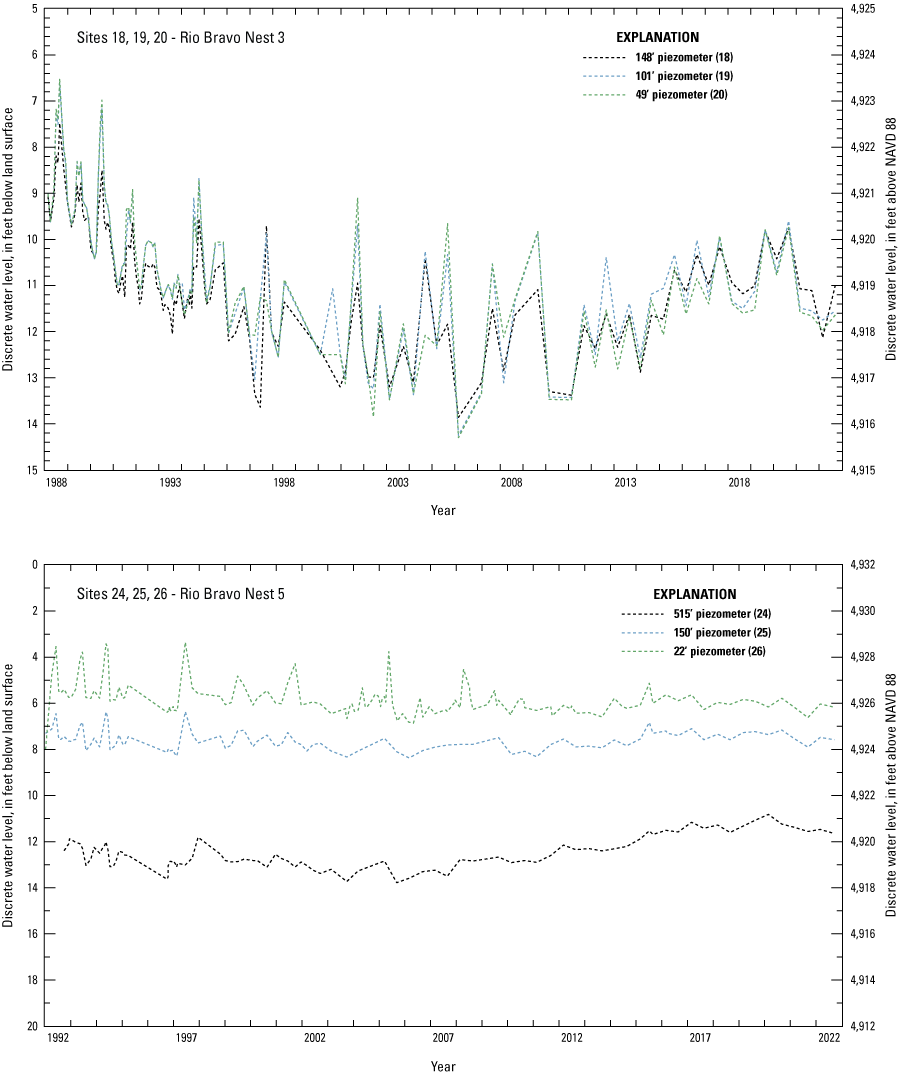
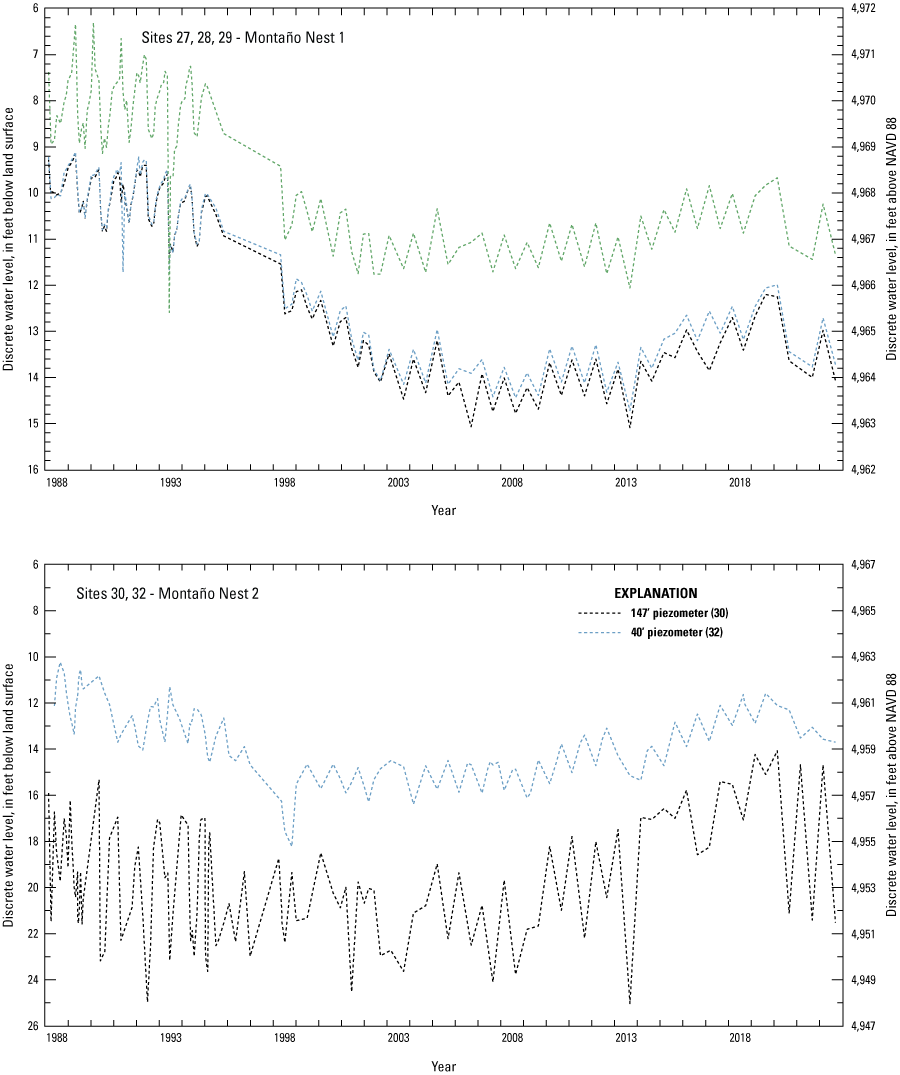
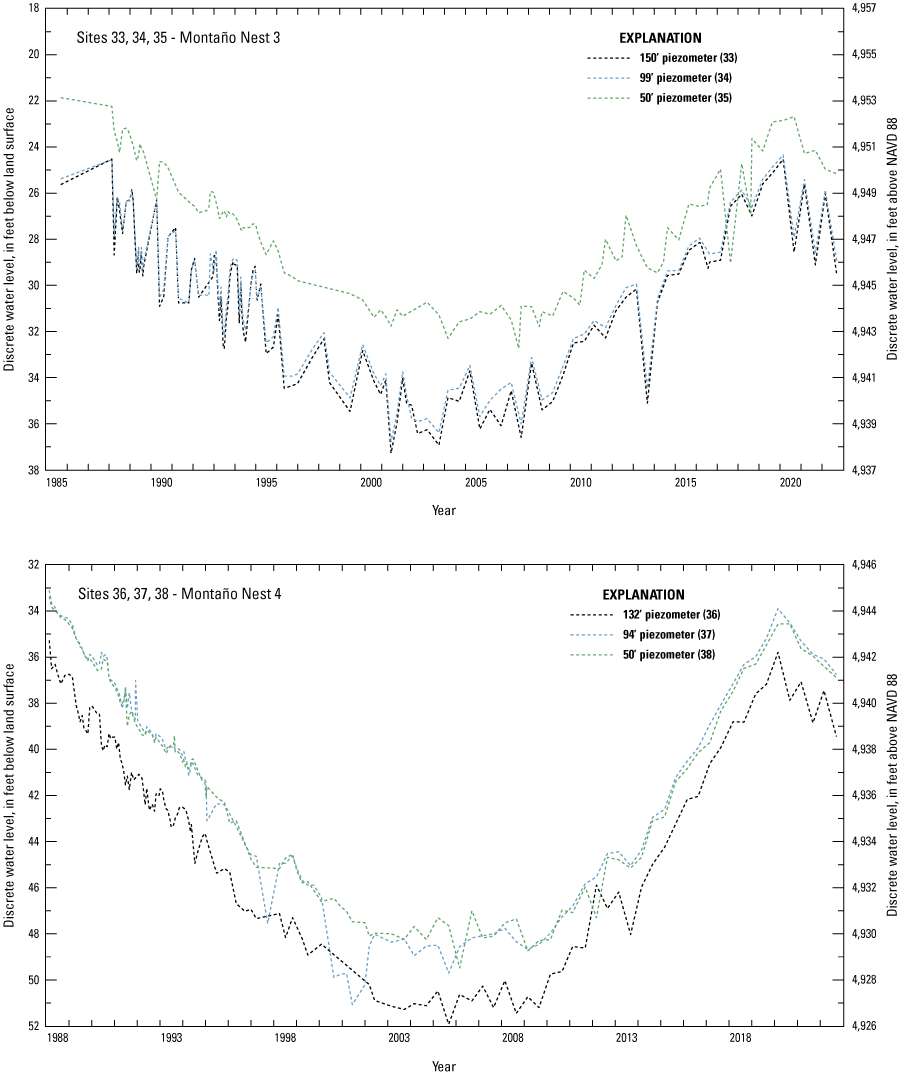
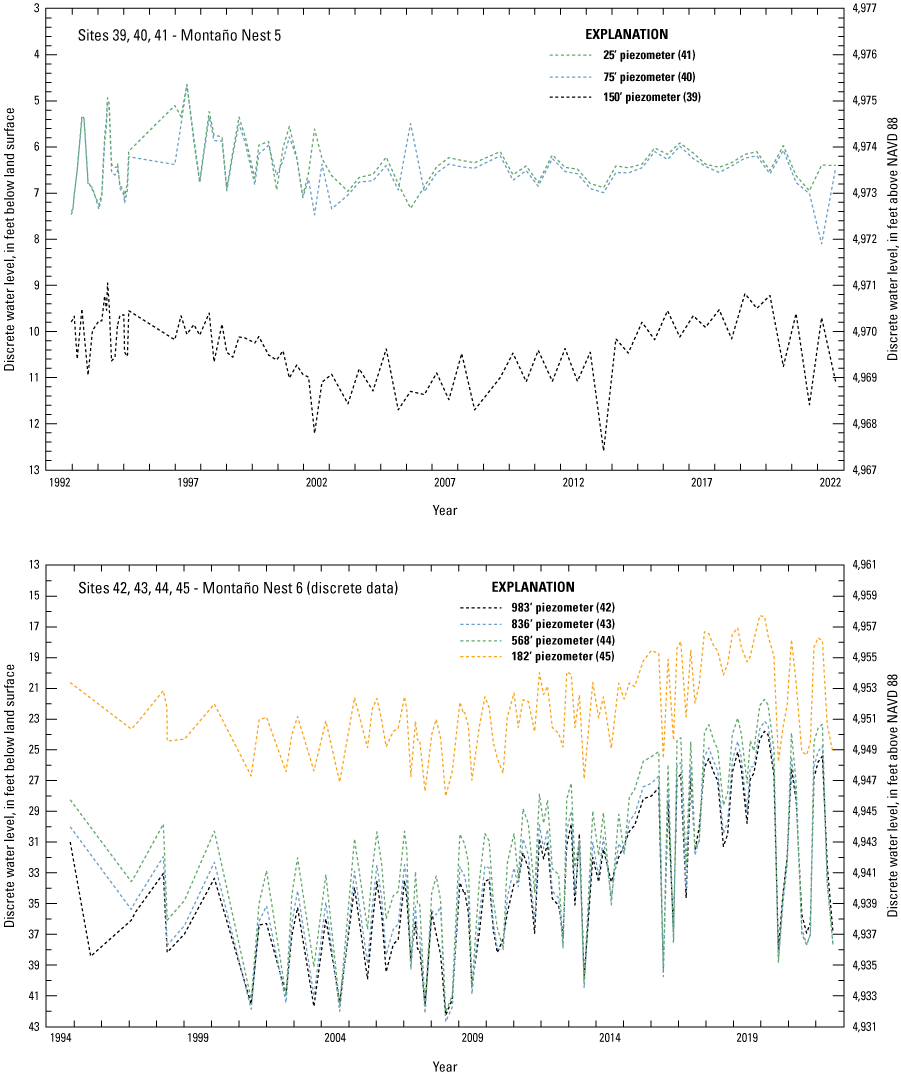
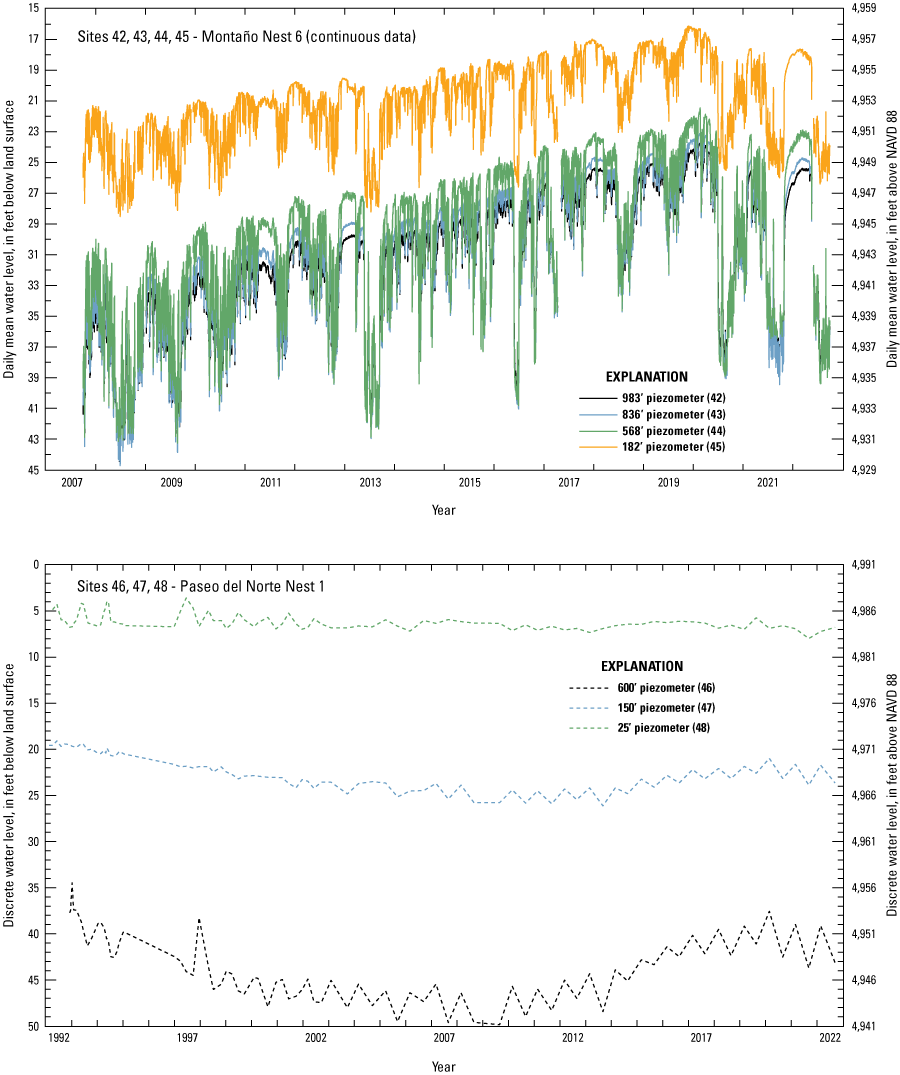
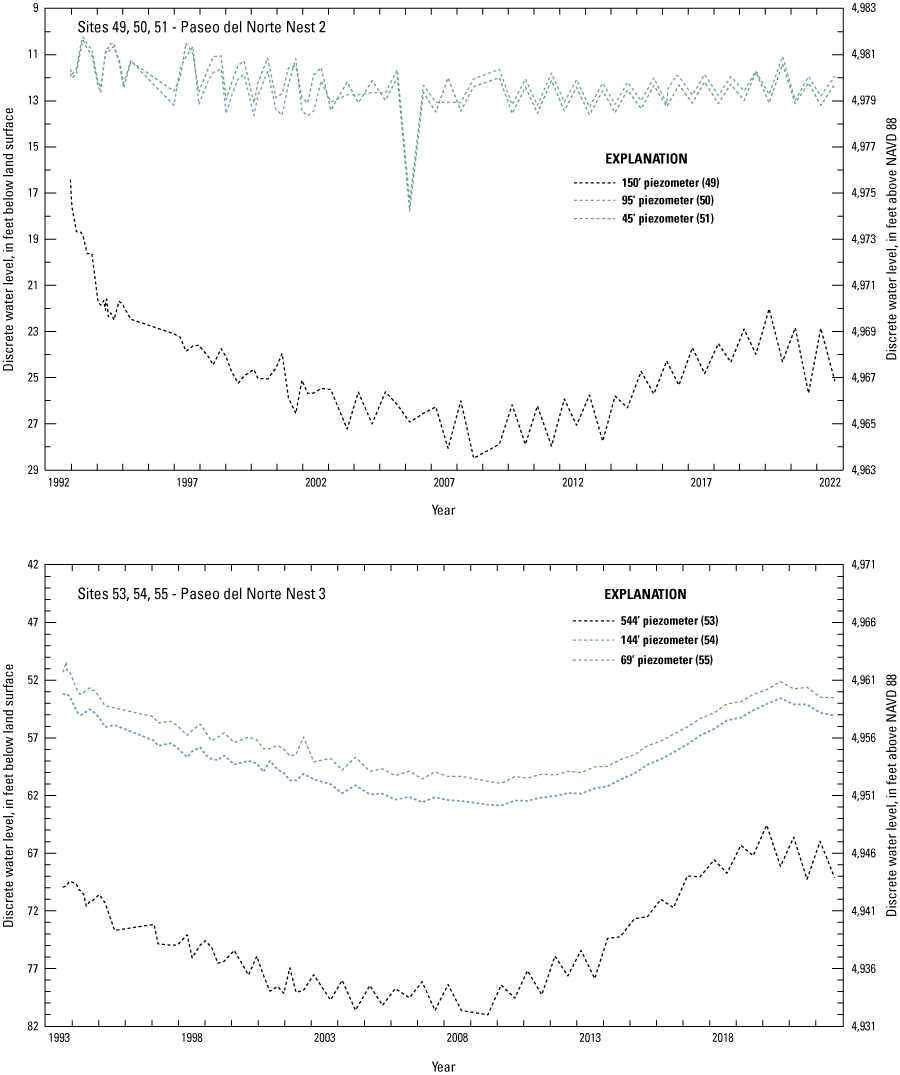
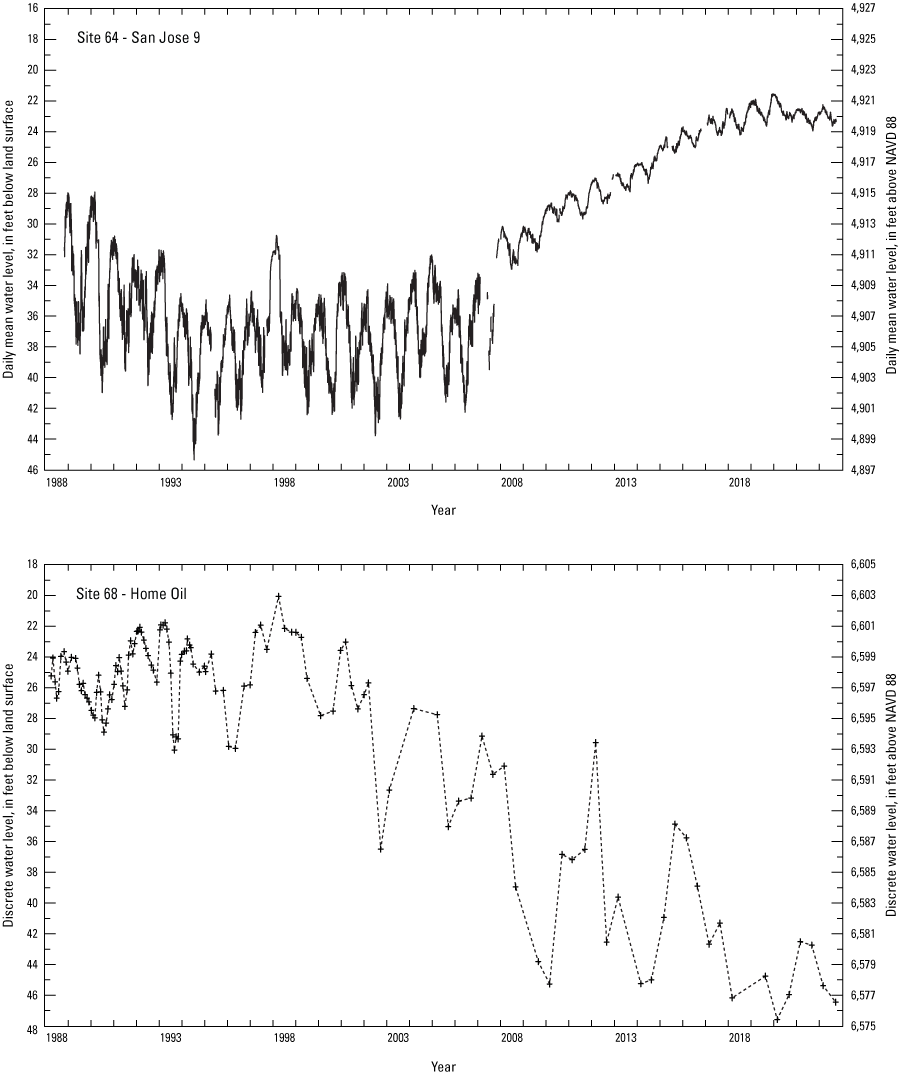
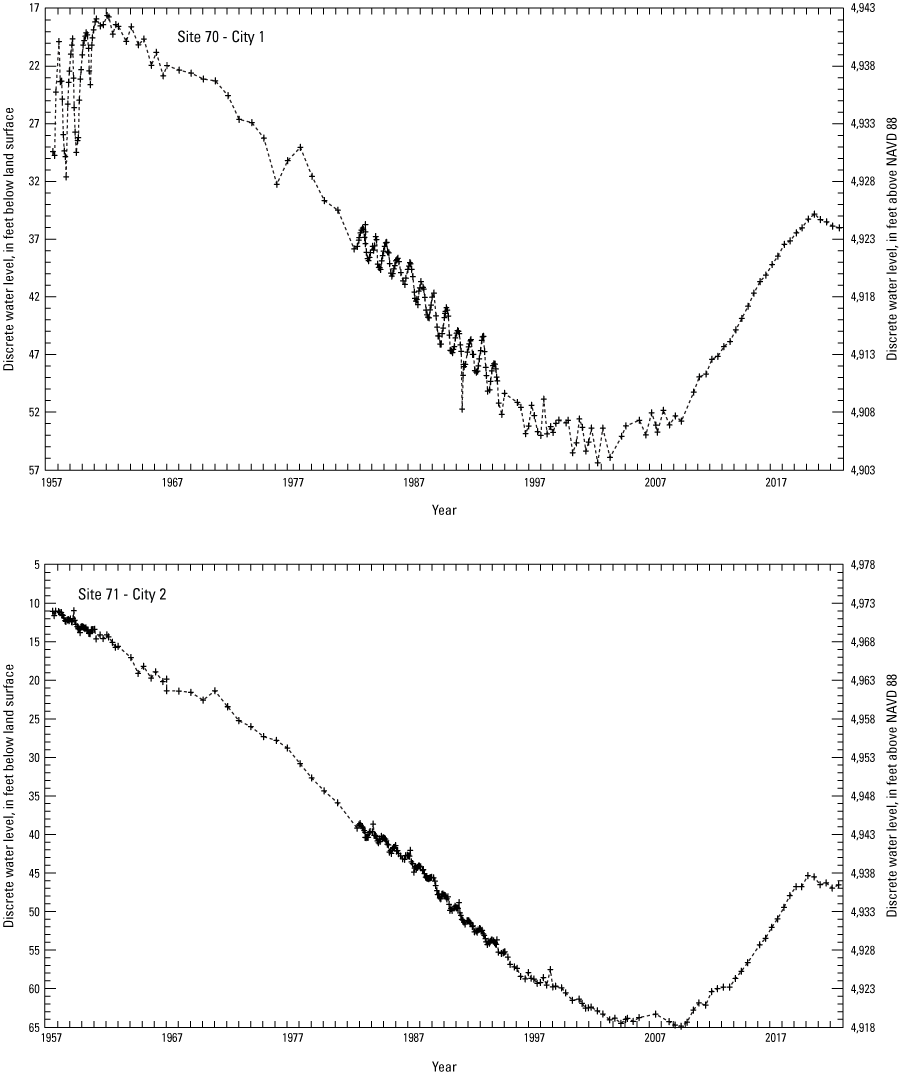
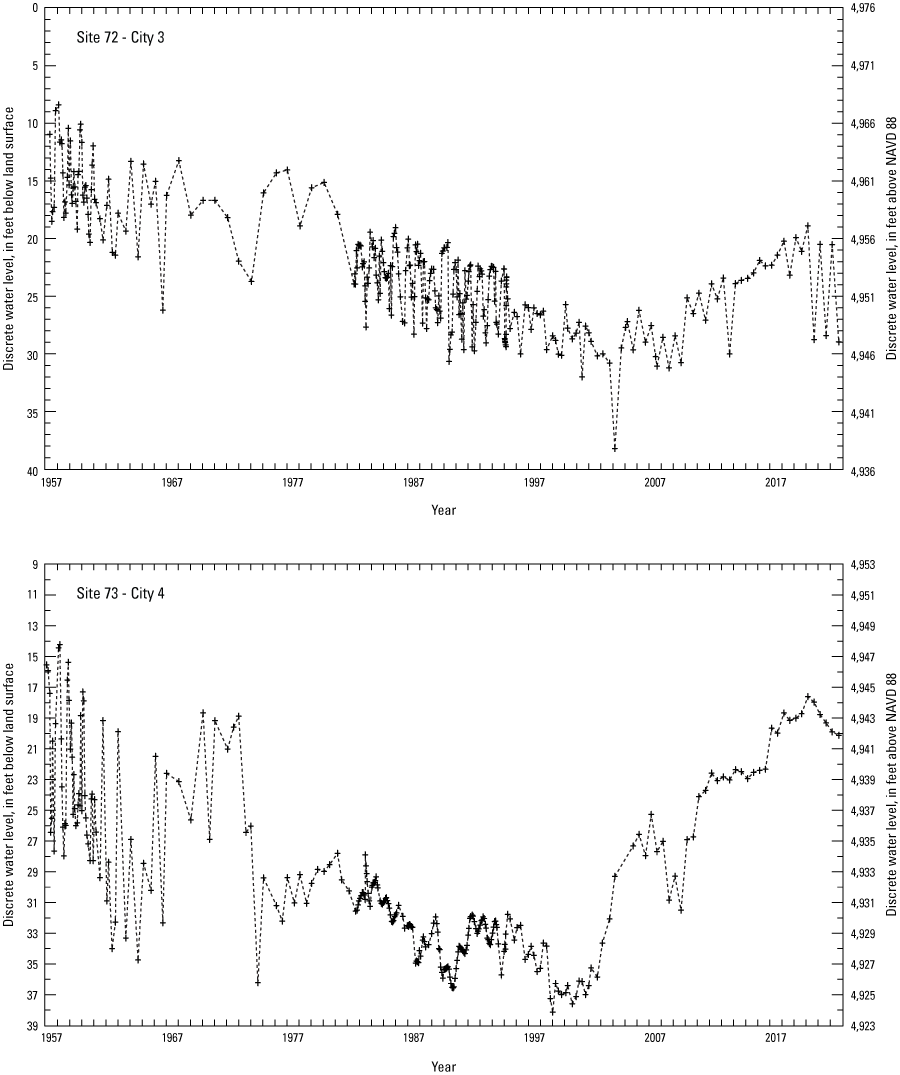
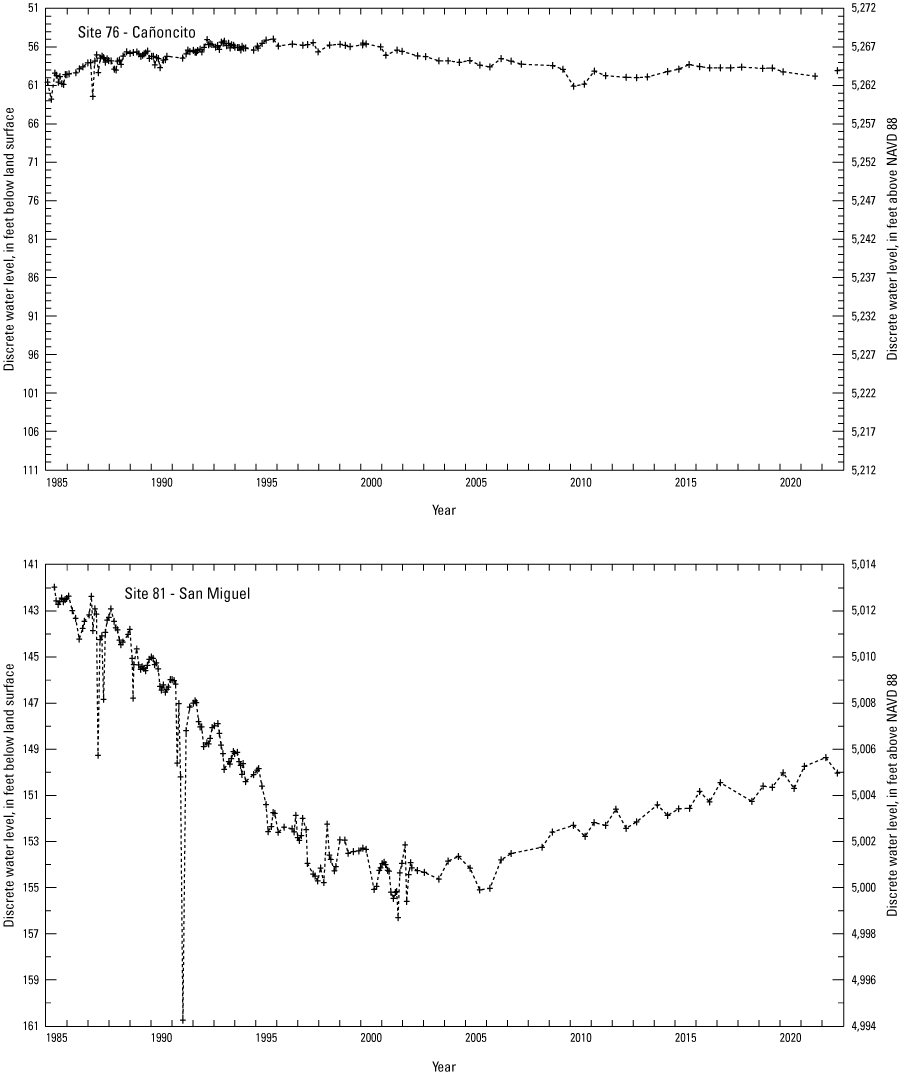
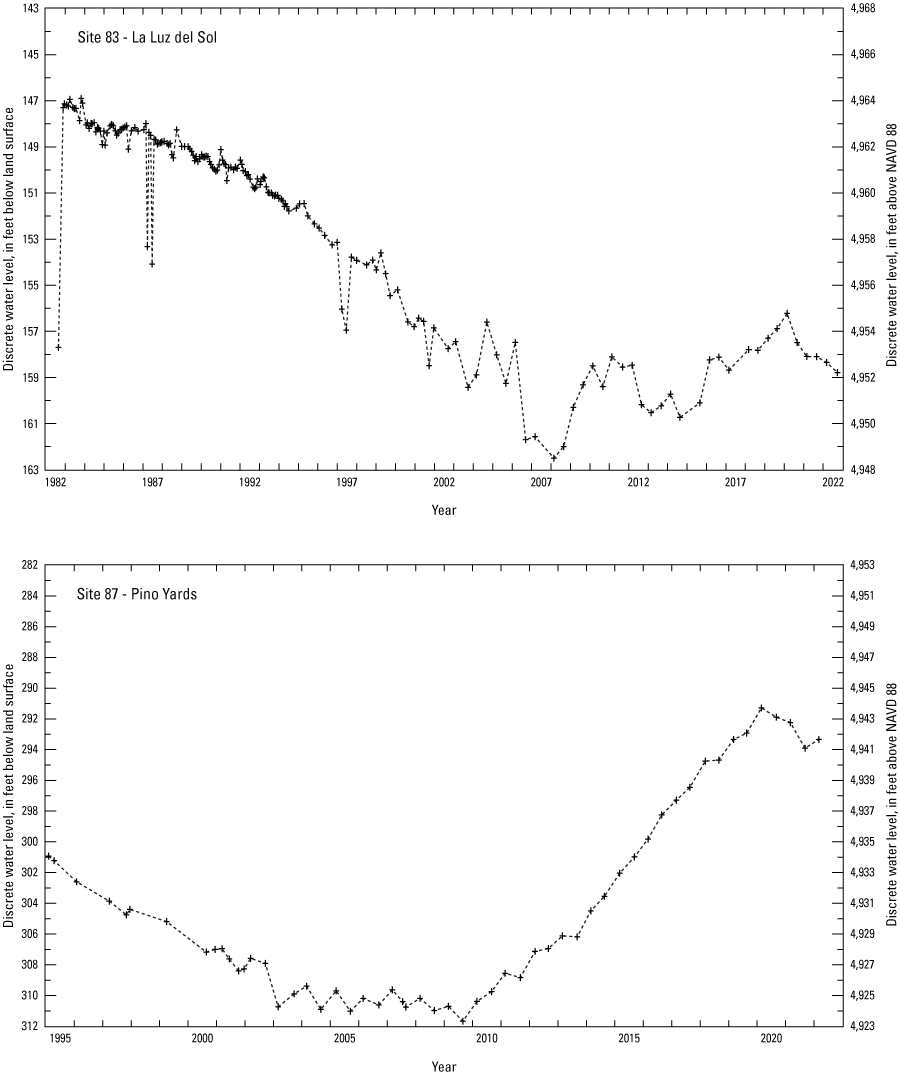
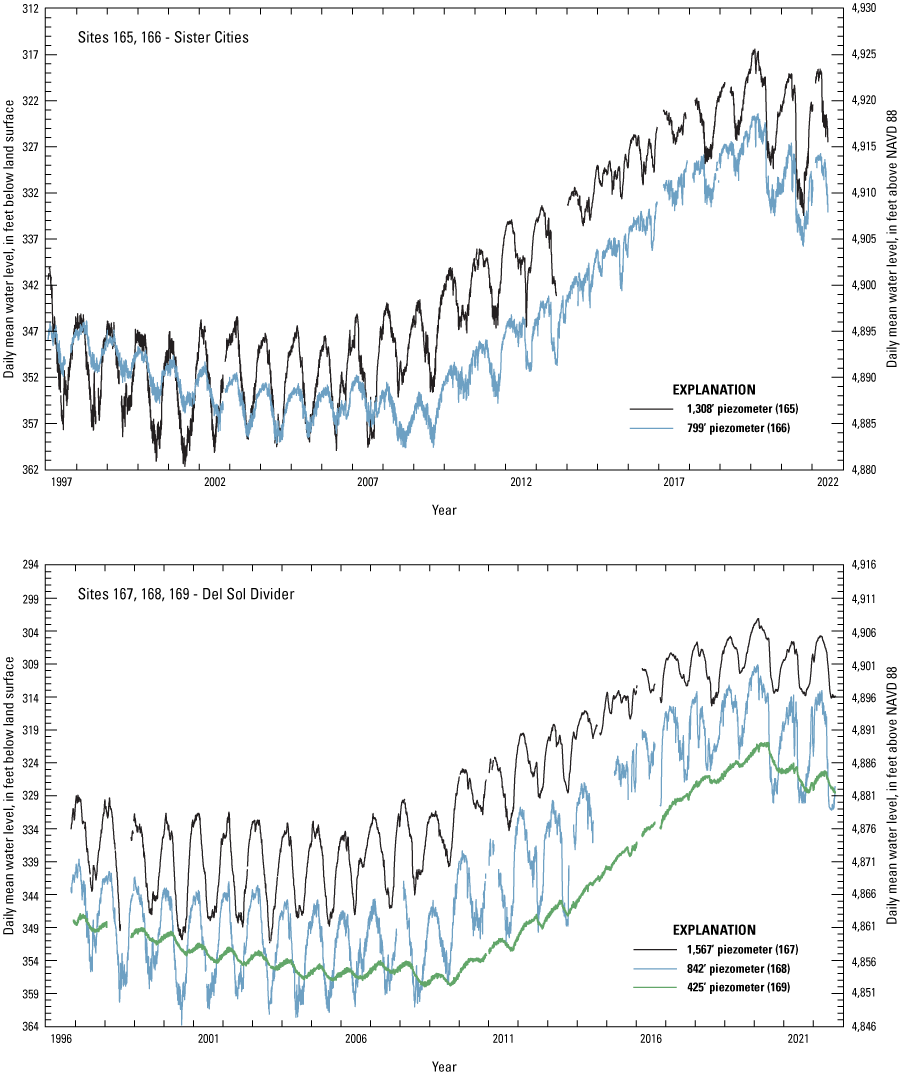
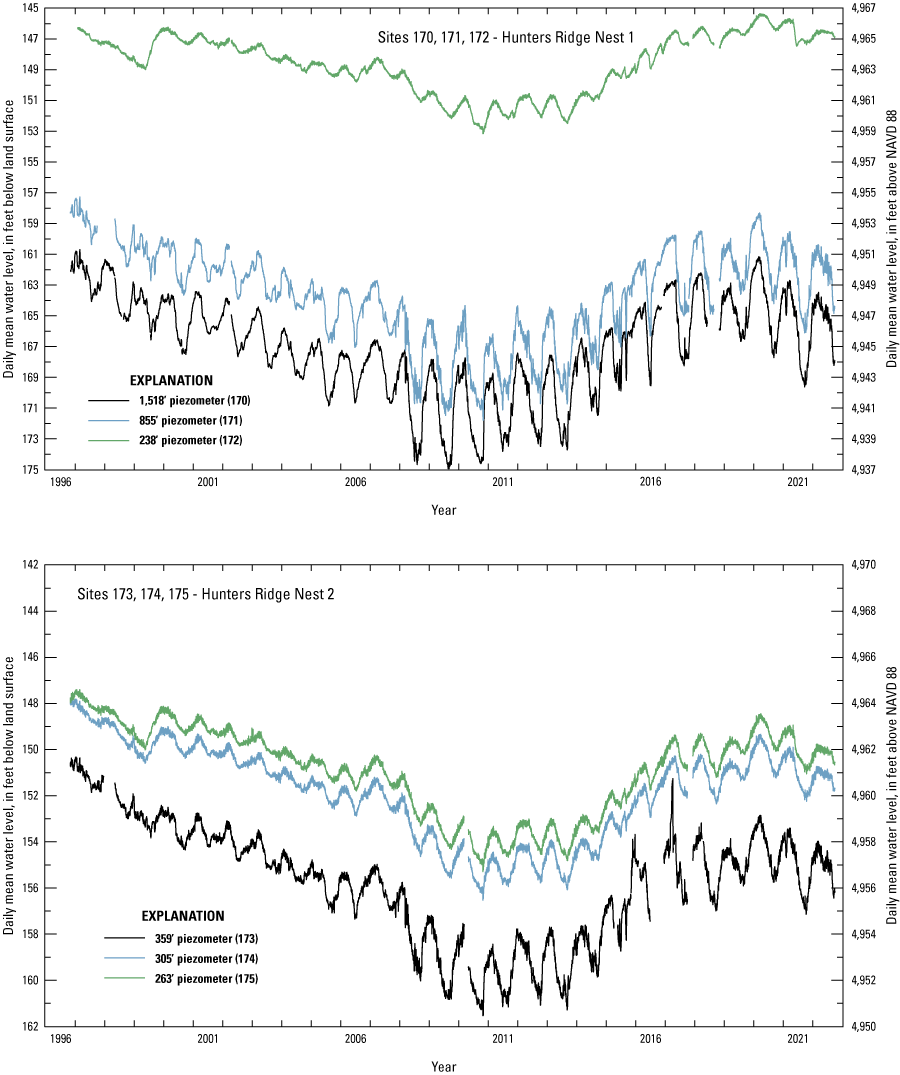
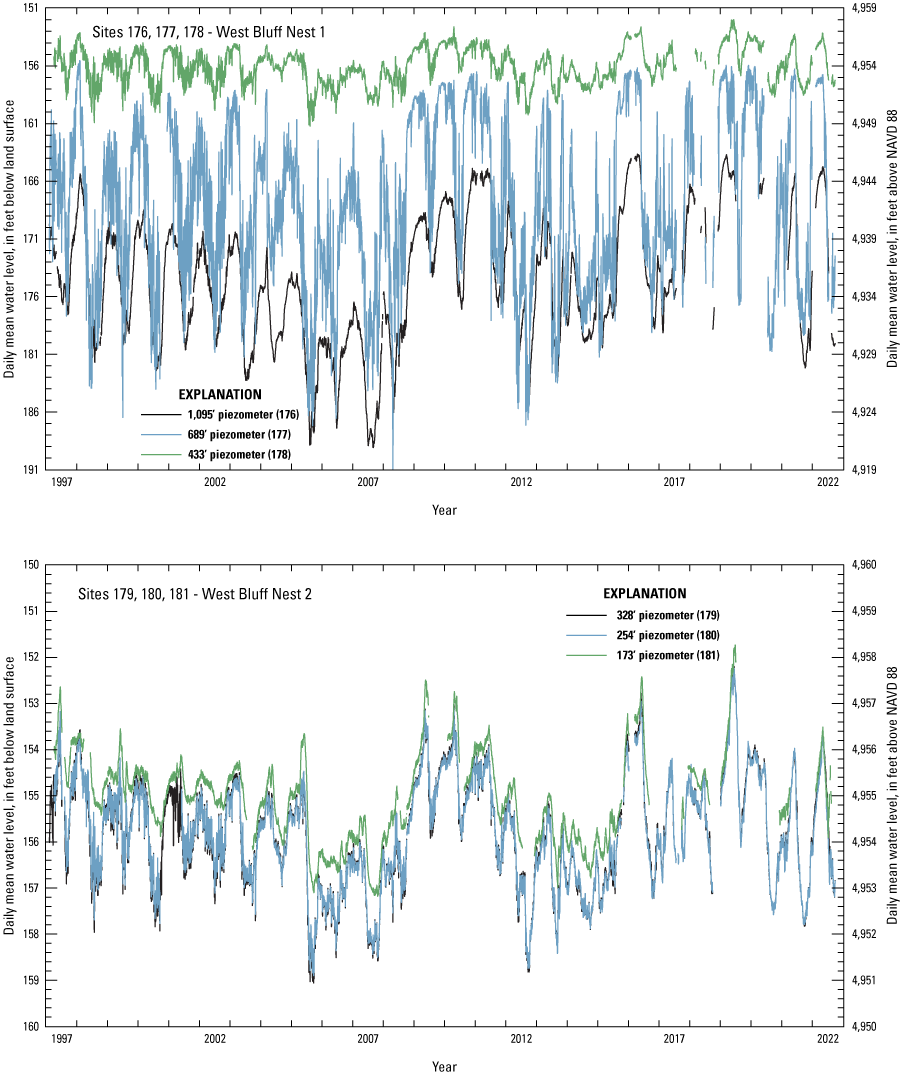
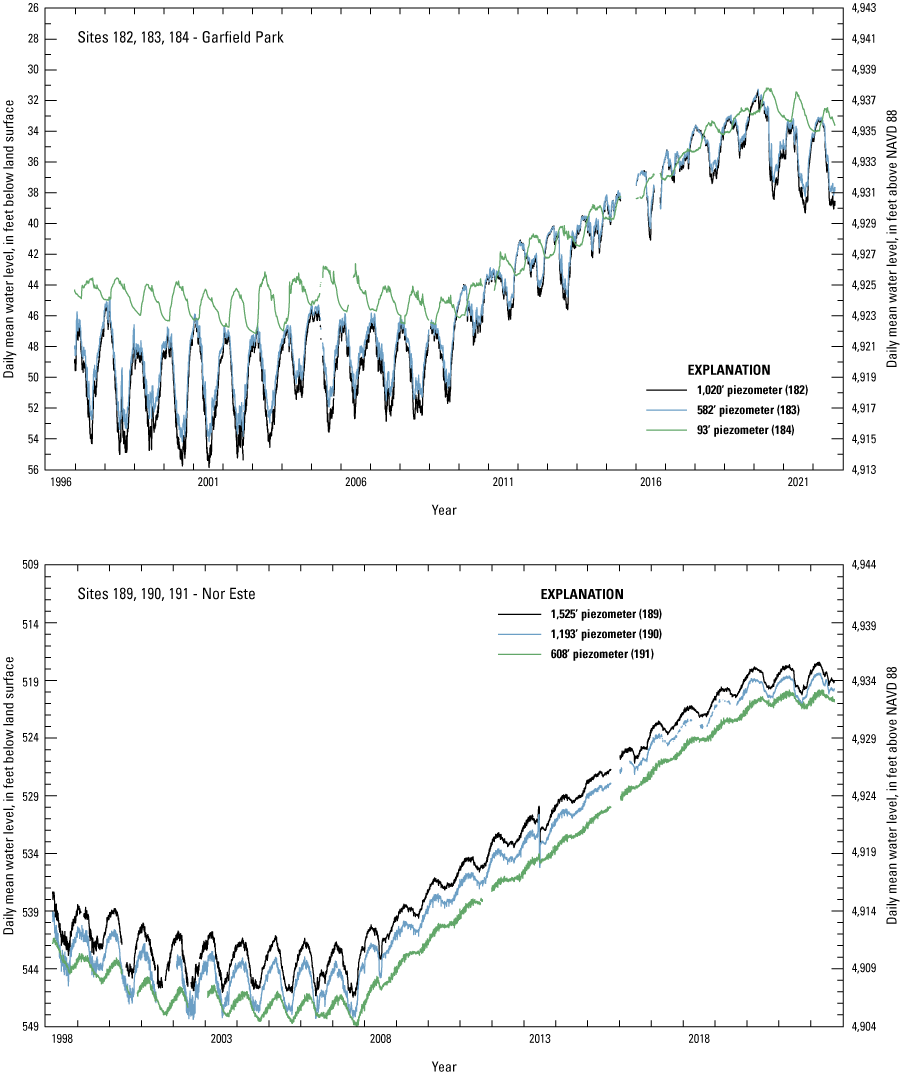
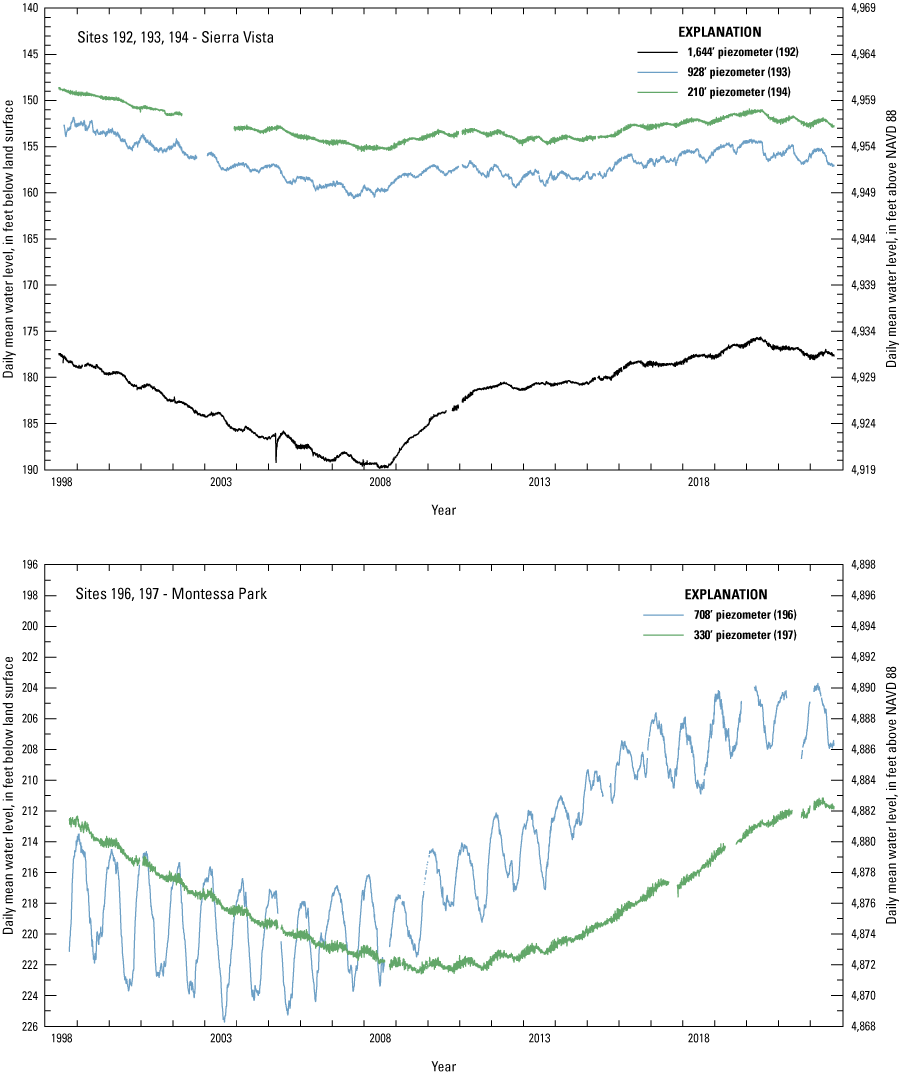
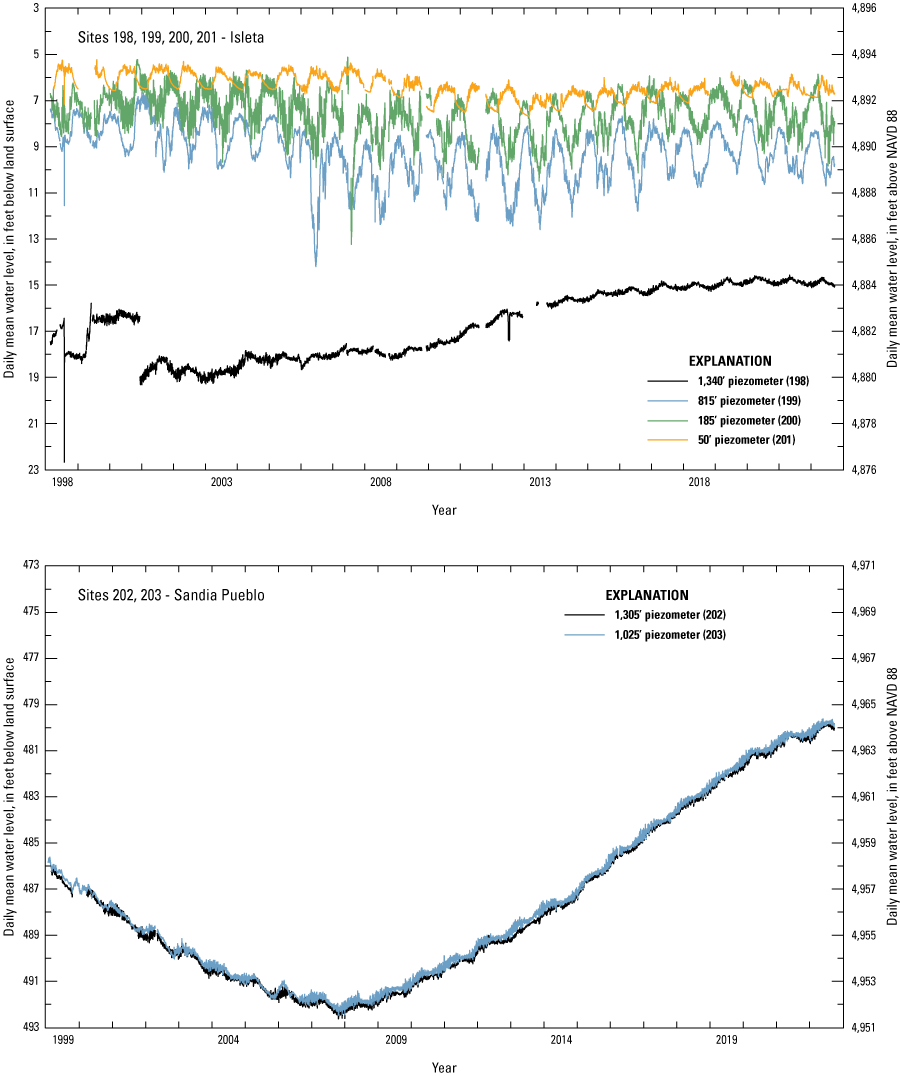
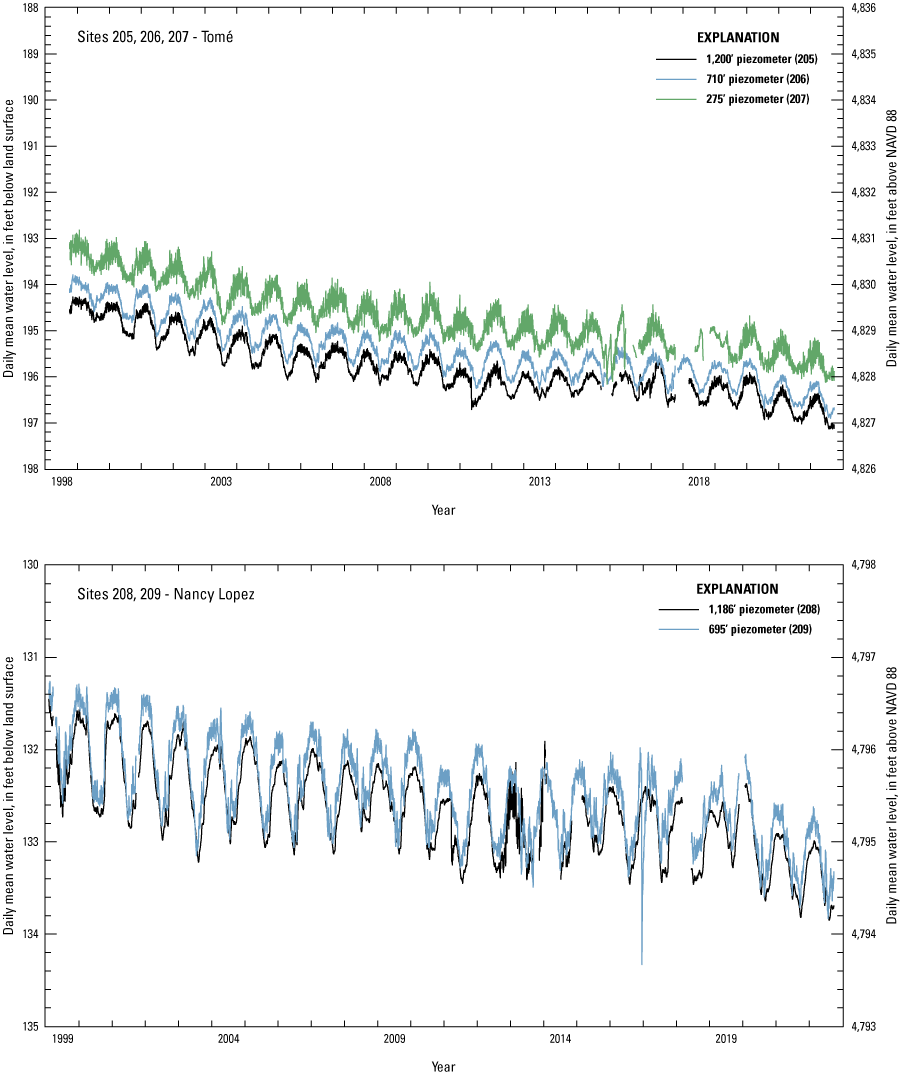
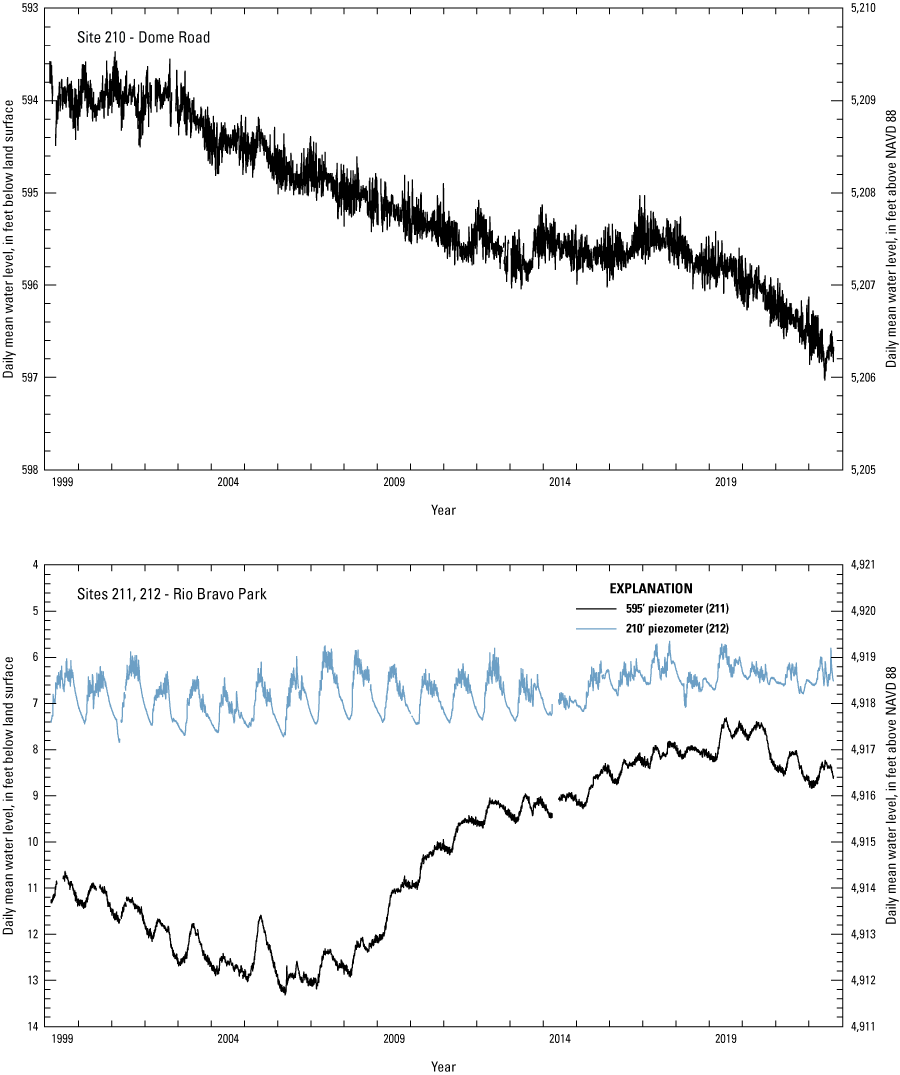
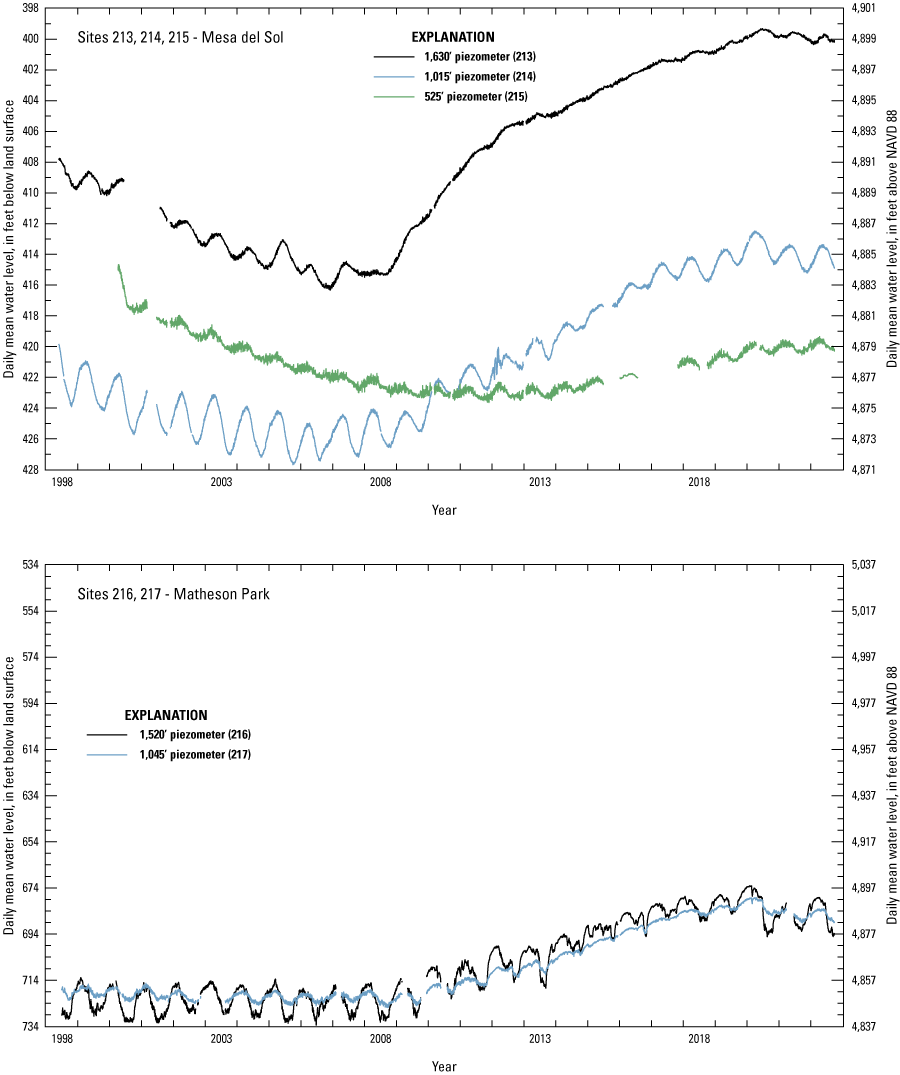
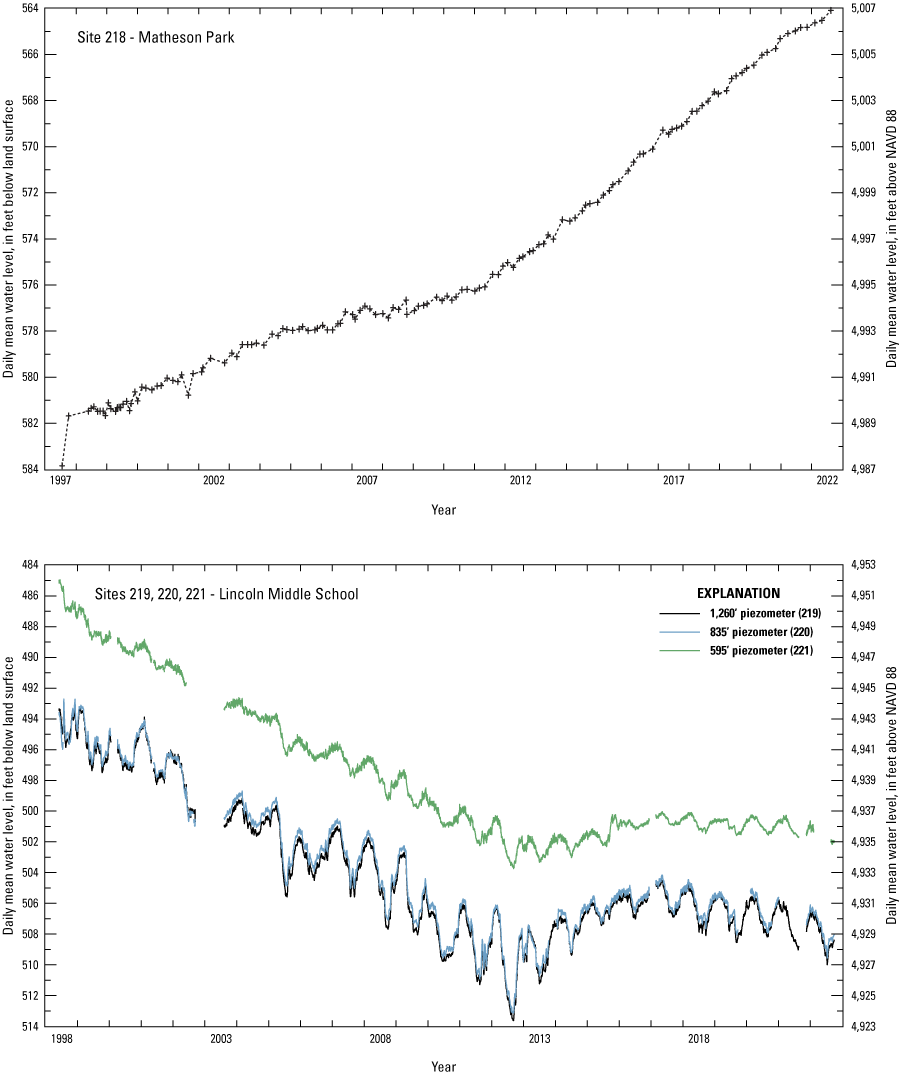
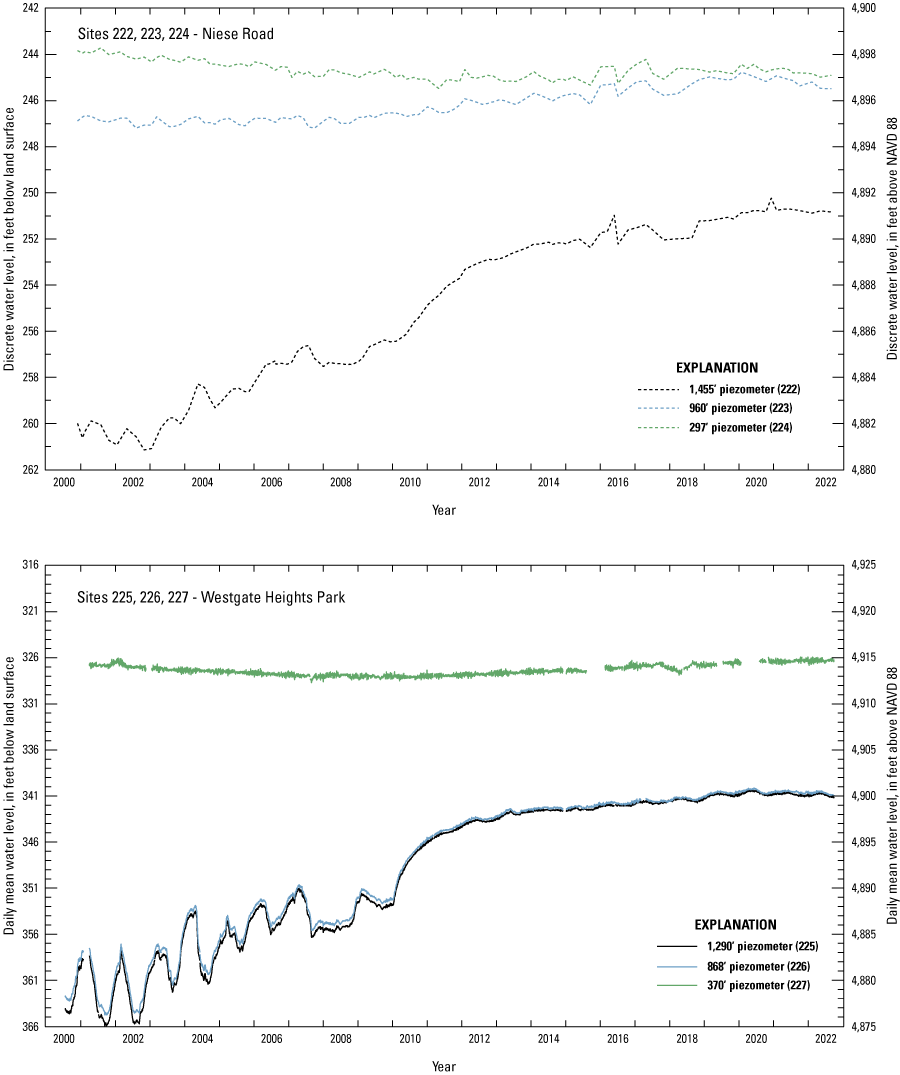
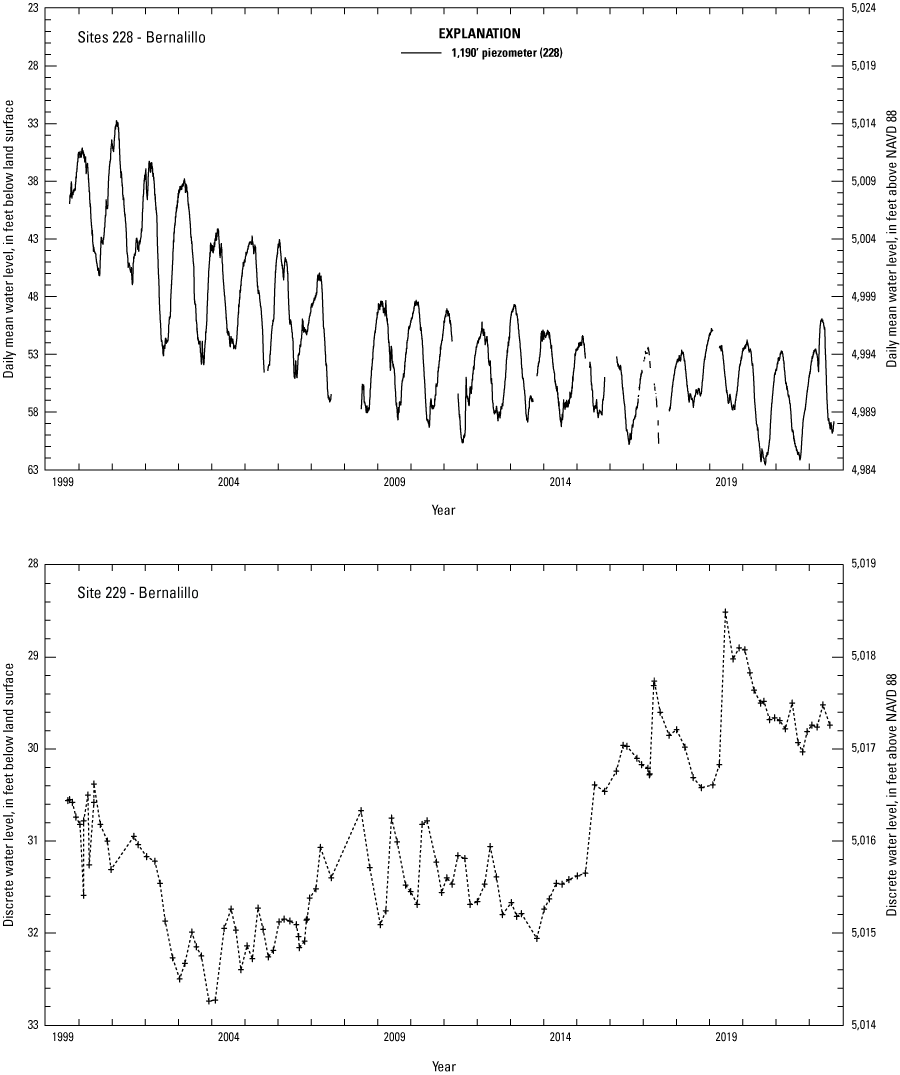
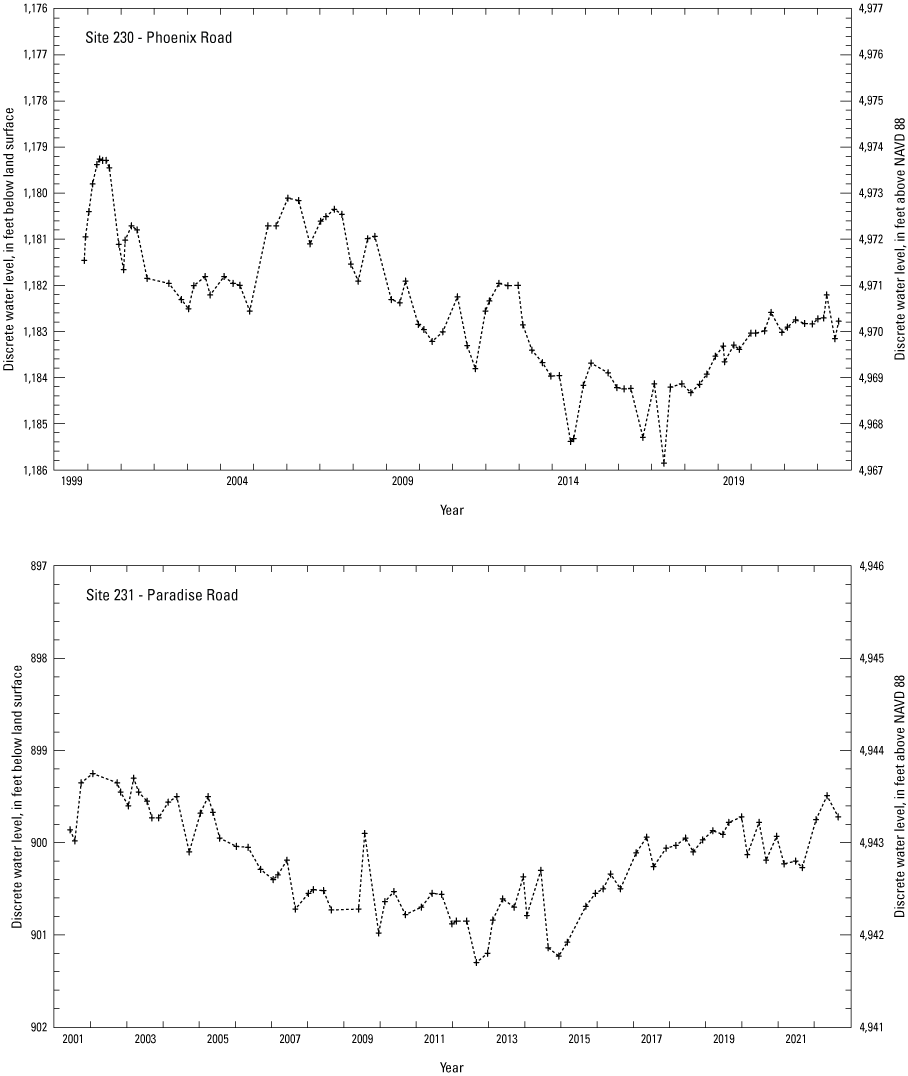
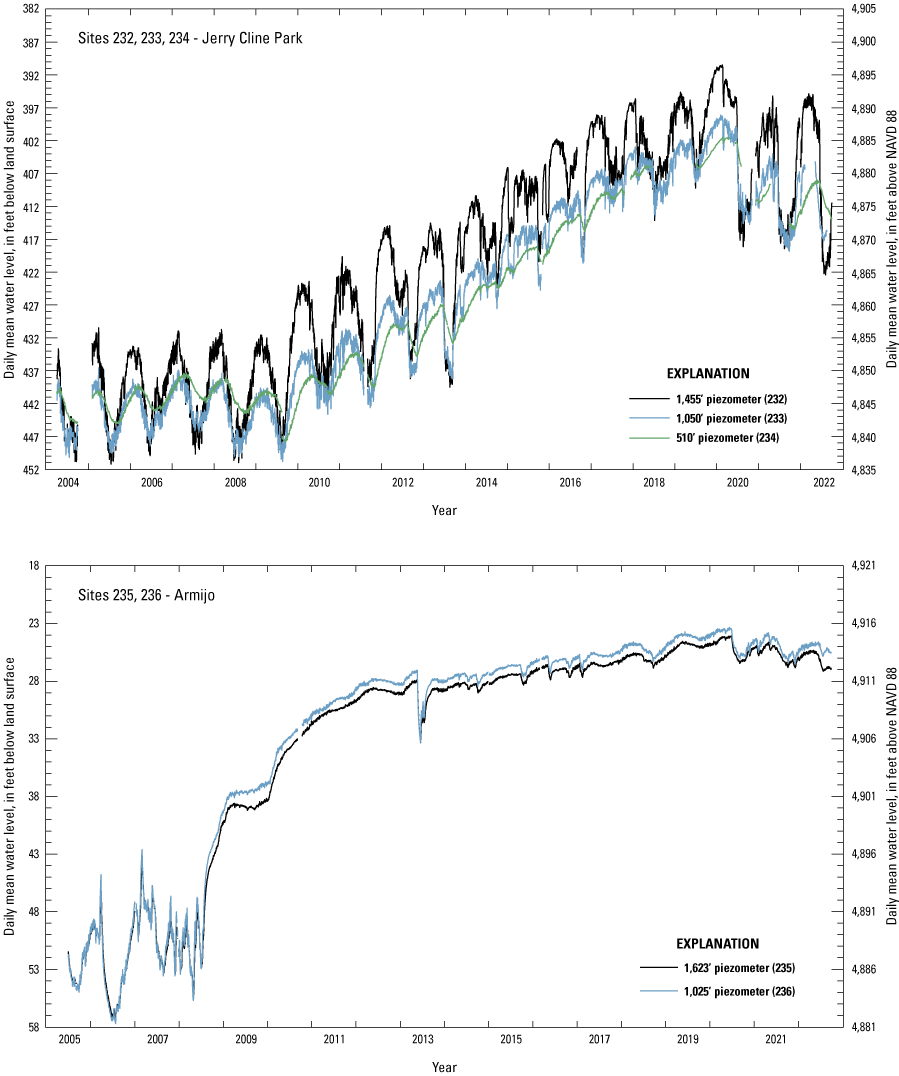
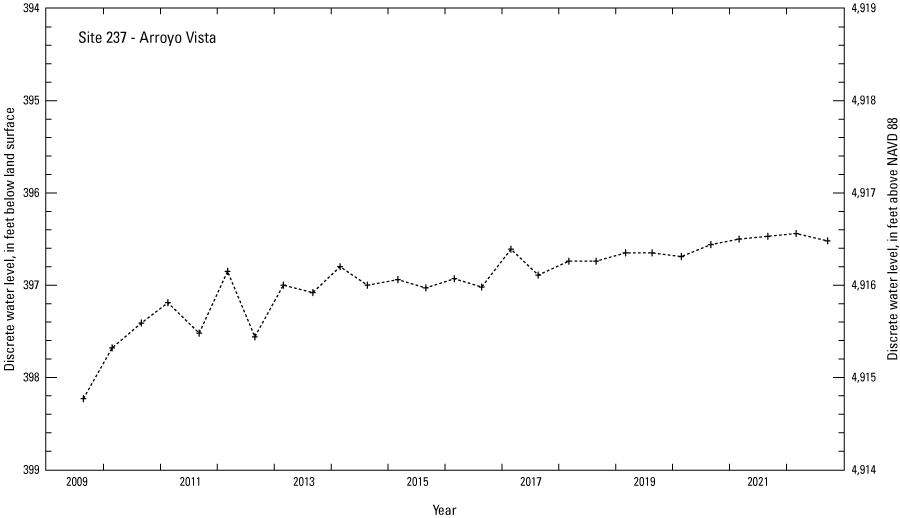
Water-level data for wells and piezometers in and adjacent to the Albuquerque Basin, central New Mexico, period of record through September 30, 2022. Site numbers and well depths correspond to those in tables 1, 2, and 3; NAVD 1988, North American Vertical Datum of 1988.
References Cited
Albuquerque Bernalillo County Water Utility Authority [ABCWUA], 2016, Main text and appendices, vol. 1 of Water 2120—Securing our water future: Albuquerque, N. Mex., Albuquerque Bernalillo County Water Utility Authority, 309 p. [Also available at https://www.abcwua.org/wp-content/uploads/Your_Drinking_Water-PDFs/Water_2120_Volume_I.pdf.]
ABCWUA, 2023, Your water authority overview: Albuquerque-Bernalillo County Water Utility Authority website, accessed May 5, 2023, at www.abcwua.org/your-water-authority-overview.
Bell, M.T., and Montero, N.Y., 2022, Water-level data for the Albuquerque Basin and adjacent areas, central New Mexico, period of record through September 30, 2021: U.S. Geological Survey Data Report 1162, 43 p. [Also available at https://doi.org/10.3133/dr1162.]
Beman, J.E., 2007, Water-level data for the Albuquerque Basin and adjacent areas, central New Mexico, period of record through September 30, 2006: U.S. Geological Survey Open-File Report 2007–1273, 34 p. [Also available at https://doi.org/10.3133/ofr20071273.]
Beman, J.E., 2008, Water-level data for the Albuquerque Basin and adjacent areas, central New Mexico, period of record through September 30, 2007: U.S. Geological Survey Open-File Report 2008–1255, 32 p. [Also available at https://doi.org/10.3133/ofr20081255.]
Beman, J.E., 2009, Water-level data for the Albuquerque Basin and adjacent areas, central New Mexico, period of record through September 30, 2008: U.S. Geological Survey Open-File Report 2009–1125, 37 p. [Also available at https://doi.org/10.3133/ofr20091125.]
Beman, J.E., 2011, Water-level data for the Albuquerque Basin and adjacent areas, central New Mexico, period of record through September 30, 2010: U.S. Geological Survey Data Series 623, 28 p. [Also available at https://doi.org/10.3133/ds623.]
Beman, J.E., 2012, Water-level data for the Albuquerque Basin and adjacent areas, central New Mexico, period of record through September 30, 2011: U.S. Geological Survey Data Series 714, 29 p. [Also available at https://doi.org/10.3133/ds714.]
Beman, J.E., 2013, Water-level data for the Albuquerque Basin and adjacent areas, central New Mexico, period of record through September 30, 2012: U.S. Geological Survey Data Series 790, 28 p. [Also available at https://doi.org/10.3133/ds790.]
Beman, J.E., 2014, Water-level data for the Albuquerque Basin and adjacent areas, central New Mexico, period of record through September 30, 2013: U.S. Geological Survey Data Series 873, 40 p. [Also available at https://doi.org/10.3133/ds873.]
Beman, J.E., 2015, Water-level data for the Albuquerque Basin and adjacent areas, central New Mexico, period of record through September 30, 2014: U.S. Geological Survey Data Series 963, 42 p. [Also available at https://doi.org/10.3133/ds963.]
Beman, J.E., 2020, Water-level data for the Albuquerque Basin and adjacent areas, central New Mexico, period of record through September 30, 2019: U.S. Geological Survey Data Series 1129, 40 p. [Also available at https://doi.org/10.3133/ds1129.]
Beman, J.E., and Bryant, C.F., 2016, Water-level data for the Albuquerque Basin and adjacent areas, central New Mexico, period of record through September 30, 2015: U.S. Geological Survey Data Series 1025, 39 p. [Also available at https://doi.org/10.3133/ds1025.]
Beman, J.E., Ritchie, A.B., and Galanter, A.E., 2019, Water-level data for the Albuquerque Basin and adjacent areas, central New Mexico, period of record through September 30, 2017: U.S. Geological Survey Data Series 1113, 39 p. [Also available at https://doi.org/10.3133/ds1113.]
Beman, J.E., and Torres, L.T., 2010, Water-level data for the Albuquerque Basin and adjacent areas, central New Mexico, period of record through September 30, 2009: U.S. Geological Survey Open-File Report 2010–1228, 31 p. [Also available at https://doi.org/10.3133/ofr20101228.]
Cunningham, W.L., and Schalk, C.W., comps., 2011, Groundwater technical procedures of the U.S. Geological Survey: U.S. Geological Survey Techniques and Methods, book 1, chap. A1, 151 p., accessed September 30, 2014, at https://pubs.usgs.gov/tm/1a1/.
DeWees, R.K., 2001, Water-level data for the Albuquerque Basin and adjacent areas, central New Mexico, period of record through 2000: U.S. Geological Survey Open-File Report 2001–184, 62 p. [Also available at https://doi.org/10.3133/ofr01184.]
DeWees, R.K., 2002, Water-level data for the Albuquerque Basin and adjacent areas, central New Mexico, period of record through 2001: U.S. Geological Survey Open-File Report 2002–312, 41 p. [Also available at https://doi.org/10.3133/ofr02312.]
DeWees, R.K., 2003, Water-level data for the Albuquerque Basin and adjacent areas, central New Mexico, period of record through 2002: U.S. Geological Survey Open-File Report 2003–321, 41 p. [Also available at https://doi.org/10.3133/ofr03321.]
DeWees, R.K., 2006, Water-level data for the Albuquerque Basin and adjacent areas, central New Mexico, period of record through 2004: U.S. Geological Survey Open-File Report 2006–1281, 40 p. [Also available at https://doi.org/10.3133/ofr20061281.]
Jurney, E.R., and Bell, M.T., 2021, Water-level data for the Albuquerque Basin and adjacent areas, central New Mexico, period of record through September 30, 2020: U.S. Geological Survey Data Series 1139, 40 p. [Also available at https://doi.org/10.3133/ds1139.]
Kues, G.E., 1987, Ground-water-level data for the Albuquerque-Belen Basin, New Mexico, through water year 1985: U.S. Geological Survey Open-File Report 87–116, 51 p. [Also available at https://doi.org/10.3133/ofr87116.]
Rankin, D.R., 1994, Water-level data for the Albuquerque Basin, New Mexico, October 1, 1986, through September 30, 1990: U.S. Geological Survey Open-File Report 94–349, 29 p. [Also available at https://doi.org/10.3133/ofr94349.]
Rankin, D.R., 1996, Water-level data for the Albuquerque Basin, New Mexico, period of record through September 30, 1995: U.S. Geological Survey Open-File Report 96–664–A, 28 p. [Also available at https://doi.org/10.3133/ofr96664A.]
Rankin, D.R., 1998, Water-level data for the Albuquerque Basin, central New Mexico, period of record through 1997: U.S. Geological Survey Open-File Report 98–408, 28 p. [Also available at https://doi.org/10.3133/ofr98408.]
Rankin, D.R., 1999, Water-level data for the Albuquerque Basin and adjacent areas, New Mexico, period of record through 1998: U.S. Geological Survey Open-File Report 99–269, 27 p. [Also available at https://doi.org/10.3133/ofr99269.]
Rankin, D.R., 2000, Water-level data for the Albuquerque Basin and adjacent areas, central New Mexico, period of record through 1999: U.S. Geological Survey Open-File Report 2000–231, 62 p. [Also available at https://doi.org/10.3133/ofr00231.]
Ritchie, A.B., and Galanter, A.E., 2019, Water-level data for the Albuquerque Basin and adjacent areas, central New Mexico, period of record through September 30, 2018: U.S. Geological Survey Data Series 1116, 40 p. [Also available at https://doi.org/10.3133/ds1116.]
Thorn, C.R., McAda, D.P., and Kernodle, J.M., 1993, Geohydrologic framework and hydrologic conditions in the Albuquerque Basin, central New Mexico: U.S. Geological Survey Water-Resources Investigations Report 93–4149, 106 p. [Also available at https://doi.org/10.3133/wri934149.]
U.S. Census Bureau, 2023, Explore census data: U.S. Census Bureau website, accessed May 5, 2023, at https://data.census.gov.
U.S. Geological Survey, [USGS], 2022, USGS water data for the Nation: U.S. Geological Survey National Water Information System database, accessed February 25, 2022, at https://doi.org/10.5066/F7P55KJN.
Datum
Vertical coordinate information is referenced to the North American Vertical Datum of 1988 (NAVD 88).
Latitude and longitude are in decimal degrees and in conformance with the North American Datum of 1983 (NAD 83).
Supplemental Information
Water year is defined as beginning on October 1 and continuing through September 30 of the following year and designated by the calendar year in which it ends.
For more information about this publication, contact
Director, New Mexico Water Science Center
U.S. Geological Survey
6700 Edith Blvd. NE
Albuquerque, NM 87113
For additional information, visit
https://www.usgs.gov/centers/nm-water
Publishing support provided by
Lafayette Publishing Service Center
Disclaimers
Any use of trade, firm, or product names is for descriptive purposes only and does not imply endorsement by the U.S. Government.
Although this information product, for the most part, is in the public domain, it also may contain copyrighted materials as noted in the text. Permission to reproduce copyrighted items must be secured from the copyright owner.
Suggested Citation
Bell, M.T., and Montero, N.Y., 2023, Water-level data for the Albuquerque Basin and adjacent areas, central New Mexico, period of record through September 30, 2022: U.S. Geological Survey Data Report 1186, 42 p., https://doi.org/10.3133/dr1186.
ISSN: 2771-9448 (online)
Study Area
| Publication type | Report |
|---|---|
| Publication Subtype | USGS Numbered Series |
| Title | Water-level data for the Albuquerque Basin and adjacent areas, central New Mexico, period of record through September 30, 2022 |
| Series title | Data Report |
| Series number | 1186 |
| DOI | 10.3133/dr1186 |
| Publication Date | December 20, 2023 |
| Year Published | 2023 |
| Language | English |
| Publisher | U.S. Geological Survey |
| Publisher location | Reston, VA |
| Contributing office(s) | New Mexico Water Science Center |
| Description | Report: iv, 42 p.; Data Release |
| Country | United States |
| State | New Mexico |
| Online Only (Y/N) | Y |