

National Shoreline Change: Summary Statistics of Shoreline Change From the 1800s To the 2010s for the Coast of California
Links
- Document: Report (1.55 MB pdf) , HTML , XML
- Data Release: USGS data release - National shoreline change—A GIS compilation of vector shorelines and associated shoreline change data from the 1800s to the 2010s for the coast of California
- Project Site: Coastal Change Hazards Portal
- NGMDB Index Page: National Geologic Map Database Index Page (html)
- Download citation as: RIS | Dublin Core
Abstract
Rates of shoreline change have been updated for the open-ocean sandy coastline of California as part of studies conducted by the U.S. Geological Survey. Shorelines from the original assessment (1800s through 1998 or 2002), as well as additional shoreline position data from 2009 to 2011, 2015, and 2016 extracted from light detection and ranging (lidar) data, were used to compute long-term rates (approximately 150 years) that incorporate the proxy-datum bias on a transect-by-transect basis. The proxy-datum bias accounts for the unidirectional onshore bias of proxy-based high water line shorelines relative to datum-based mean high water shorelines. In areas where the methods for delineating shorelines did not make it possible to compute a bias correction, the rates are reported without that correction. In this study, the coasts of northern and central California exhibited the highest average rates of erosion, whereas southern California exhibited the highest average rate of accretion. The maximum erosion rate was in San Mateo County in central California. The maximum rate of accretion was in Humboldt County in northern California. Rates were calculated at 19,063 transect locations. Shoreline positions from the mid-1800s through 2016 were used to update shoreline change rates in California using the Digital Shoreline Analysis System (DSAS) software.
Introduction
In coastal areas of the United States, the dynamic interfaces between water and land are often locations of concentrated residential and commercial development as well as Federal, State, Tribal, and local municipal landholdings managed for recreation and conservation. These areas are frequently subjected to a range of natural hazards, which include flooding and coastal erosion. In response, the U.S. Geological Survey (USGS) is compiling existing reliable historical shoreline data and calculating rates of shoreline change along the conterminous coast of the United States and parts of Alaska and Hawaii as part of the coastal change hazards priority. One component of this research effort documents changes in shoreline position, which are data used as a proxy for coastal change. Shoreline position is one of the most monitored indicators of environmental change (Morton, 1996), and it is an easily understood feature marking the location of a beach through time.
A principal focus of the shoreline change documentation effort has been to develop a consistent methodology for calculating shoreline change rates and reporting results that may be periodically updated when additional data or improved techniques become available. Beginning in 2004, the USGS has published results of shoreline monitoring work, organized and presented by coastal region, including: the U.S. Gulf of Mexico coast (Morton and others, 2004), the southeast Atlantic coast (Morton and Miller, 2005), the California sandy shorelines (Hapke and others, 2006) and California coastal cliffs (Hapke and Reid, 2007), the New England and mid-Atlantic coasts (Hapke and others, 2011), parts of the Hawaii coast (Fletcher and others, 2012), the Pacific Northwest (Ruggiero and others, 2013), and parts of Alaska (Gibbs and Richmond, 2015; Gibbs and others, 2019). Updates to the southeast Atlantic (Kratzmann and others, 2017; Kratzmann and others, 2021), Gulf of Mexico (Himmelstoss and others, 2017), and Alaska (Gibbs and Richmond, 2017) coasts have also been published. Data for open-ocean coastal regions in the United States can be viewed in the USGS Coastal Change Hazards Portal (https://marine.usgs.gov/coastalchangehazardsportal/).
This report is an update to the original USGS assessment of California shorelines (Hapke and others, 2006) and includes revised rate-of-change calculations based on additional shoreline position data, improved rate metrics, and application of a proxy-datum bias correction on a transect-by-transect basis that quantifies potential bias and errors associated with integrating shorelines referenced to different proxies (Ruggiero and List, 2009). In the original shoreline change report (Hapke and others, 2006), the proxy-datum bias correction was only applied to regional shoreline averages (not transect-by-transect). The proxy-datum bias accounts for the unidirectional onshore bias of proxy-based high water line (HWL) shorelines relative to datum-based mean high water (MHW) shorelines. If this offset is not accounted for in the rate-of-change calculations, the resulting shoreline change rates would indicate slower shoreline retreat than reality, progradation rather than retreat, or faster progradation than reality (Ruggiero and List, 2009).
In this report and the associated data release (Kratzmann and others, 2024), three new datum-based MHW shorelines derived from light detection and ranging (lidar) elevation data from 2009 to 2011, 2015, and 2016 are included in the analysis. Two methods (both described in Farris and others, 2018) were used to extract the lidar shorelines: the profile method for the 2009–2011 shoreline and the contour method for the 2015 and 2016 shorelines (Barnard and others, 2020). The full time series of the shoreline dataset spans from 1852 to 2016, compiled from several sources (table 1). The California coast has been divided into three regions (fig. 1) for data distribution and reporting of rates: northern California (from the California-Oregon border to Tomales Bay), central California (from Tomales Bay to El Capitán State Beach), and southern California (from El Capitán State Beach to the California-Mexico border).
Table 1.
Data sources and regional shoreline coverage for shoreline change in California.[Coverage is not necessarily continuous. For details regarding sources, uncertainty values, extraction methods, and shorelines present in specific areas of California, see shorelines shapefile metadata and attribute tables in Kratzmann and others (2024). T-sheet, topographic survey sheet; DRG, digital raster graphic; lidar, light detection and ranging; HWL, high water line (proxy-based shoreline); MHW, mean high water (datum-based shoreline); NOAA, National Oceanic and Atmospheric Administration; USGS, U.S. Geological Survey; NASA, National Aeronautics and Space Administration; USACE, U.S. Army Corps of Engineers; JALBTCX, Joint Airborne Lidar Bathymetry Technical Center of Expertise; UCSD, University of California, San Diego]
Lidar shoreline from Hapke and others (2006).
Lidar shoreline with proxy-datum bias values on a transect-by-transect basis. Extracted using profile method (Farris and others, 2018).
Lidar shoreline that does not have associated bias values. Extracted by Barnard and others (2020) using contour method (Farris and others, 2018).
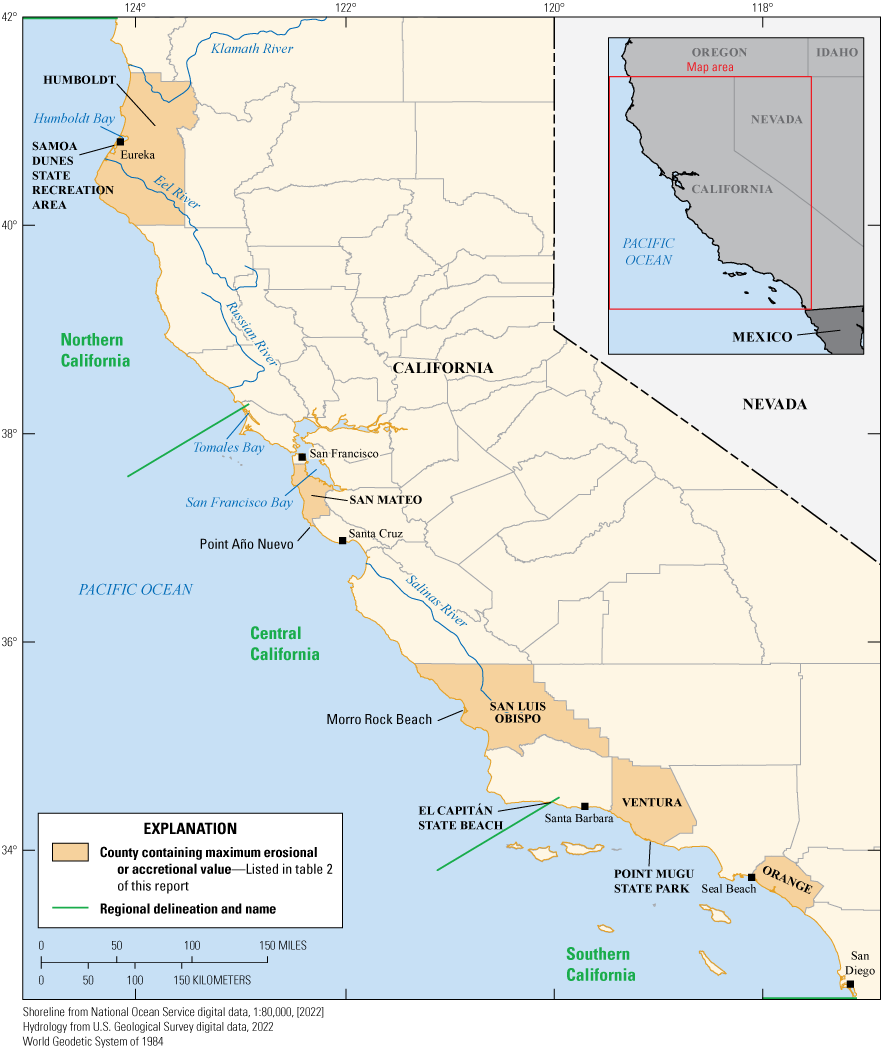
Map showing the three regions of California for the shoreline change analysis of California, defined as northern California, central California, and southern California.
Calculation and Interpretation of Shoreline Change Results
Rates of long-term (approximately 150 years) shoreline change for the California coast were computed within a geographic information system (GIS) by using the linear regression calculation included in the Digital Shoreline Analysis System (DSAS) version 5 software (Himmelstoss and others, 2018a). In this study, DSAS used an alongshore-oriented baseline to generate transects orthogonal to the coast at 50-meter (m) spacing and to subsequently calculate shoreline change statistics (Himmelstoss and others, 2018b). The shoreline change rates and rate uncertainties at individual transect locations for California are available in the associated data release (Kratzmann and others, 2024). This report provides averaged rates of long-term shoreline change and the associated average rate of uncertainty as a measure of broad-scale trends. Maximum values and long-term rates of erosion and accretion are reported at various locations in each region of California.
A value of 9999 in an attribute table in Kratzmann and others (2024) indicates a null value. These values were inserted in the attribute tables because ArcGIS automatically changes a null value to a zero value (which could be mistaken for a true zero) whenever a feature class is exported from a geodatabase to a shapefile (Esri, 2016), which was a necessary step in the workflow of this project. In addition, there may be sections of coast where the proxy-datum bias correction cannot be applied. The proxy-datum bias correction can only be applied in locations where bias values associated with the 2009–11 lidar shoreline have been calculated. In DSAS version 5, the bias correction is applied up to 2 kilometers beyond the last bias value location. The 2009–11 lidar shoreline was extracted using the profile method, which includes the slope data necessary for calculating bias values, whereas contour method shorelines (such as 2015 and 2016 in California) do not include slope data. Examples where the bias correction was not made include transects with only HWL shoreline intersections (that is, no 2009–11 lidar shoreline at that location and therefore no bias value) or transects that include MHW shoreline intersections with no bias (locations with only 2015 and 2016 contour shorelines present). A field (Bias_NB) was added to the rates and intersects attribute tables in Kratzmann and others (2024) to clearly label which locations have the bias correction applied (Bias) or no bias correction applied (NB). A user may select and export bias-only rates if desired. The statistics reported in the tables are only for bias-corrected rates.
Following Ruggiero and others (2013), each transect rate uncertainty was reasoned to be partially independent of the others. Given that some cancellation of the uncertainties is likely in a regional analysis and transect uncertainties are not likely to be independent of all the others, a partial independence approach reduces both overestimation and underestimation of the uncertainty. To estimate the regionally averaged uncertainty of partially independent transect rates, the effective number of independent uncertainty values (n*) was evaluated. Following Garrett and Toulany (1981), n* was found on the basis of the spatially lagged autocorrelation of measurement uncertainty. For the measurement uncertainty used in this study, each measure of shoreline change rate uncertainty was used. This method resulted in a large reduction of the original sample size (n). Assuming that the uncertainty of a region can be represented by , the uncertainty of a regionally averaged change rate () was as follows:
where the uncertainty of the region was multiplied by the inverse of the spatially lagged autocorrelation. The reduced effective sample size (n*) was also determined for each region (northern, central, and southern California) by summing the n* values for the individual regions within the State. Average uncertainty values found by using equation 1 are generally much smaller than the arithmetic mean confidence interval but larger than the quadrature-averaged confidence interval (Ruggiero and others, 2013).
Results From Historical Shoreline Change Analysis
Shorelines from the original report (Hapke and others, 2006) as well as additional shoreline position data derived from lidar were used to compute long-term rates that incorporate the proxy-datum bias on a transect-by-transect basis.
-
• In northern California, the average bias value is 19.8 m.
-
• In central California, the average bias value is 19.0 m.
-
• In southern California, the average bias value is 13.6 m.
Averaged rates of long-term (approximately 150 years) shoreline change and the associated average values of rate uncertainty for the three regions of the California coast are presented in table 2. The exact period analyzed varies, depending on the availability of shoreline change data at a given location, but is typically within the range of approximately 80 to 150 years.
Table 2.
Average long-term linear regression shoreline change rates and associated information for California.[Positive rates indicate accretion or seaward movement of the shoreline; negative rates indicate erosion or landward movement. Regions and locations shown on figure 1]
Two of the three region-averaged long-term rates are statistically significant in this update: central and southern California (table 2). The averaged long-term rates are considered statistically significant when the average rate is larger than the average reduced n confidence interval, or in other words when the range of the rate plus or minus the uncertainty is entirely accretional (positive) or entirely erosional (negative).
The coasts of northern and central California exhibited the highest average rates of erosion in the long-term, −0.4±0.01 meter per year (m/yr). In northern California, erosion was observed at 55 percent of the shoreline change transect locations (table 2). The maximum long-term erosion rate was observed south of the Eel River in Humboldt County at a rate of −2.5±3.8 m/yr (fig. 1; table 2). The maximum long-term accretion rate was 6.6±4.8 m/yr at Samoa Dunes State Recreation Area (north jetty) in Humboldt County (fig. 1; table 2). Accretion was observed at 44 percent of the 5,793 shoreline change transect locations in the region (table 2).
The average erosion rate on central California’s coast was −0.4±0.01 m/yr. Erosion was observed at 66 percent of the 6,584 transect locations, making this region the most erosional overall in the long term (table 2). The maximum long-term erosion rate was −3.2±2.6 m/yr at Point Año Nuevo in San Mateo County (fig. 1; table 2). The maximum long-term accretion rate in central California was 3.5±1.3 m/yr at Morro Rock Beach in San Luis Obispo County (fig. 1; table 2). Accretion was observed at 33 percent of transect locations in the region (table 2).
The average erosional rate on the southern California coast was −0.2±0.01 m/yr. Erosion was observed at 41 percent of transect locations in the long term (table 2). The maximum long-term erosion rate on this stretch of coast was −1.5±0.5 m/yr at Point Mugu State Park in Ventura County (fig. 1; table 2). The maximum long-term accretion rate on the southern California coast was 3.4±0.8 m/yr at Seal Beach in Orange County (fig. 1; table 2). Accretion was observed at 58 percent of the 6,686 transect locations in the region, making this the most accretional region in the State overall in the long term (table 2).
Summary
The U.S. Geological Survey presents updated calculations of long-term rates of shoreline change for the three regions of the California coast (northern, central, southern) as part of the Coastal Change Hazards Program. The updated calculations incorporate additional statewide shoreline position data from 2009–11, 2015, and 2016 for locations where the original rates were calculated using shoreline position data from four time periods: 1800s, 1920s to 1930s, 1950s to 1970s, and post-1997. The change measurements for long-term rates incorporate the proxy-datum bias correction on a transect-by-transect basis (rather than a regional average) to account for the proxy-based high water line shorelines being biased onshore relative to the datum-based mean high water shorelines. The calculation of uncertainty associated with the long-term average rates has also been refined.
Acknowledgments
The hard work and generous cooperation of many individuals made this summary report for updated shorelines and change rates for California possible. Special thanks are extended to Sky Smith and Amy Farris (U.S. Geological Survey) for their contributions to the compilation of shoreline data for this update. Reviews by Ann Gibbs and Alex Snyder of the U.S. Geological Survey greatly improved this report, and their time is very much appreciated. This work was done under contract to the U.S. Geological Survey.
References Cited
Barnard, P.L., Smith, S.A., and Foxgrover, A.C., 2020, California shorelines and shoreline change data, 1998–2016: U.S. Geological Survey data release, accessed October 19, 2022, at https://doi.org/10.5066/P91QSGXF.
Esri, 2016, Problem—Feature classes exported from XY data layers with null coordinate values have zeros as coordinate values: Esri technical support knowledgebase, accessed April 12, 2022, at https://support.esri.com/en/technical-article/000004442.
Farris, A.S., Weber, K.M., Doran, K.S., and List, J.H., 2018, Comparing methods used by the U.S. Geological Survey Coastal and Marine Geology Program for deriving shoreline position from lidar data: U.S. Geological Survey Open-File Report 2018–1121, 13 p., accessed August 7, 2021, at https://doi.org/10.3133/ofr20181121.
Fletcher, C.H., Romine, B.M., Genz, A.S., Barbee, M.M., Dyer, M., Anderson, T.R., Lim, S.C., Vitousek, S., Bochicchio, C., and Richmond, B.M., 2012, National assessment of shoreline change—Historical shoreline change in the Hawaiian islands: U.S. Geological Survey Open-File Report 2011–1051, 55 p., accessed August 7, 2021, at https://doi.org/10.3133/ofr20111051.
Garrett, C., and Toulany, B., 1981, Variability of the flow through the Strait of Belle Isle: Journal of Marine Research, v. 39, no. 1, p. 163–189, accessed October 21, 2019, at https://elischolar.library.yale.edu/journal_of_marine_research/1538/.
Gibbs, A.E., and Richmond, B.M., 2015, National assessment of shoreline change—Historical shoreline change along the north coast of Alaska, U.S.-Canadian border to Icy Cape: U.S. Geological Survey Open-File Report 2015–1048, 96 p., accessed August 7, 2021, at https://doi.org/10.3133/ofr20151048.
Gibbs, A.E., and Richmond, B.M., 2017, National assessment of shoreline change—Summary statistics for updated vector shorelines and associated shoreline change data for the north coast of Alaska, U.S.-Canadian border to Icy Cape: U.S. Geological Survey Open-File Report 2017–1107, 21 p., accessed August 7, 2021, at https://doi.org/10.3133/ofr20171107.
Gibbs, A.E., Snyder, A.G., and Richmond, B.M., 2019, National assessment of shoreline change—Historical shoreline change along the north coast of Alaska, Icy Cape to Cape Prince of Wales: U.S. Geological Survey Open-File Report 2019–1146, 52 p., accessed August 7, 2021, at https://doi.org/10.3133/ofr20191146.
Hapke, C.J., Himmelstoss, E.A., Kratzmann, M.G., List, J.H., and Thieler, E.R., 2011, National assessment of shoreline change—Historical shoreline change along the New England and mid-Atlantic coasts: U.S. Geological Survey Open-File Report 2010–1118, 57 p., accessed August 7, 2021, at https://doi.org/10.3133/ofr20101118.
Hapke, C.J., and Reid, D., 2007, National assessment of shoreline change; part 4—Historical coastal cliff retreat along the California coast: U.S. Geological Survey Open-File Report 2007–1133, 51 p., accessed August 7, 2021, at https://doi.org/10.3133/ofr20071133.
Hapke, C.J., Reid, D., Richmond, B.M., Ruggiero, P., and List, J., 2006, National assessment of shoreline change; part 3—Historical shoreline change and associated coastal land loss along the sandy shorelines of the California coast: U.S. Geological Survey Open-File Report 2006–1219, 72 p., accessed August 7, 2021, at https://doi.org/10.3133/ofr20061219.
Himmelstoss, E.A., Farris, A.S., Henderson, R.E., Kratzmann, M.G., Ergul, A., Zhang, O., Zichichi, J.L., and Thieler, E.R., 2018a, Digital shoreline analysis system (version 5.1): U.S. Geological Survey software release, accessed October 21, 2019, at https://code.usgs.gov/cch/dsas.
Himmelstoss, E.A., Henderson, R.E., Kratzmann, M.G., and Farris, A.S., 2018b, Digital shoreline analysis system (DSAS) version 5.0 user guide: U.S. Geological Survey Open-File Report 2018–1179, 110 p., accessed October 21, 2019, at https://doi.org/10.3133/ofr20181179.
Himmelstoss, E.A., Kratzmann, M.G., and Thieler, E.R., 2017, National assessment of shoreline change—A GIS compilation of updated vector shorelines and associated shoreline change data for the Gulf of Mexico coast: U.S. Geological Survey data release, accessed August 7, 2021, at https://doi.org/10.5066/F78P5XNK.
Kratzmann, M.G., Farris, A.S., and Himmelstoss, E.A., 2024, National shoreline change—A GIS compilation of vector shorelines and associated shoreline change data from the 1800s to 2010s for the coast of California: U.S. Geological Survey data release, https://doi.org/10.5066/P94J0K7Z.
Kratzmann, M.G., Farris, A.S., Weber, K.M., Henderson, R.E., and Himmelstoss, E.A., 2021, USGS national shoreline change—A GIS compilation of updated vector shorelines (1800s–2010s) and associated shoreline change data for the Georgia and Florida coasts: U.S. Geological Survey data release, accessed August 7, 2021, at https://doi.org/10.5066/P9J3CVN4.
Kratzmann, M.G., Himmelstoss, E.A., and Thieler, E.R., 2017, National assessment of shoreline change—A GIS compilation of updated vector shorelines and associated shoreline change data for the southeast Atlantic coast: U.S. Geological Survey data release, accessed August 7, 2021, at https://doi.org/10.5066/F74X55X7.
Morton, R.A., and Miller, T.L., 2005, National assessment of shoreline change; part 2—Historical shoreline changes and associated coastal land loss along the U.S. southeast Atlantic coast: U.S. Geological Survey Open-File Report 2005–1401, 34 p., accessed August 7, 2021, at https://doi.org/10.3133/ofr20051401.
Morton, R.A., Miller, T.L., and Moore, L.J., 2004, National assessment of shoreline change; part 1—Historical shoreline changes and associated coastal land loss along the U.S. Gulf of Mexico: U.S. Geological Survey Open-File Report 2004–1043, 41 p., accessed August 7, 2021, at https://doi.org/10.3133/ofr20041043.
Ruggiero, P., Kratzmann, M.G., Himmelstoss, E.A., Reid, D., Allan, J., and Kaminsky, G., 2013, National assessment of shoreline change—Historical shoreline change along the Pacific Northwest coast: U.S. Geological Survey Open-File Report 2012–1007, 62 p., accessed August 7, 2021, at https://doi.org/10.3133/ofr20121007.
Ruggiero, P., and List, J.H., 2009, Improving accuracy and statistical reliability of shoreline position and change rate estimates: Journal of Coastal Research, v. 25, no. 5, p. 1069–1081, accessed August 7, 2021, at https://doi.org/10.2112/08-1051.1.
For more information, contact
Director, Woods Hole Coastal and Marine Science Center
U.S. Geological Survey
384 Woods Hole Road
Quissett Campus
Woods Hole, MA 02543-1598
(508) 548–8700 or (508) 457–2200
WHSC_science_director@usgs.gov
or visit our website at
https://www.usgs.gov/centers/whcmsc
Publishing support provided by the Pembroke Publishing Service Center
Disclaimers
Any use of trade, firm, or product names is for descriptive purposes only and does not imply endorsement by the U.S. Government.
Although this information product, for the most part, is in the public domain, it also may contain copyrighted materials as noted in the text. Permission to reproduce copyrighted items must be secured from the copyright owner.
Suggested Citation
Kratzmann, M.G., 2024, National shoreline change—Summary statistics of shoreline change from the 1800s to the 2010s for the coast of California: U.S. Geological Survey Data Report 1187, 7 p., https://doi.org/10.3133/dr1187.
ISSN: 2771-9448 (online)
Study Area
| Publication type | Report |
|---|---|
| Publication Subtype | USGS Numbered Series |
| Title | National shoreline change—Summary statistics of shoreline change from the 1800s to the 2010s for the coast of California |
| Series title | Data Report |
| Series number | 1187 |
| DOI | 10.3133/dr1187 |
| Publication Date | January 16, 2024 |
| Year Published | 2024 |
| Language | English |
| Publisher | U.S. Geological Survey |
| Publisher location | Reston, VA |
| Contributing office(s) | Woods Hole Coastal and Marine Science Center |
| Description | Report: iv, 7 p.; Data Release |
| Country | United States |
| State | California |
| Online Only (Y/N) | Y |
| Additional Online Files (Y/N) | N |