

National Shoreline Change: Summary Statistics for Vector Shorelines from the Early 1900s to the 2010s for Puerto Rico
Links
- Document: Report (6.08 MB pdf) , HTML , XML
- Data Release: USGS data release - Puerto Rico shoreline change—A GIS compilation of shorelines, baselines, intersects, and change rates calculated using the digital shoreline analysis system version 5.1
- Project Site: Coastal Change Hazards Portal
- NGMDB Index Page: National Geologic Map Database Index Page (html)
- Download citation as: RIS | Dublin Core
Acknowledgments
The hard work and generous cooperation of many individuals made this report of updated shorelines and change rates for Puerto Rico possible. This effort is part of the Supplemental Appropriations for Disaster Relief Requirements Act of 2018 (Public Law 115–123; 132 Stat. 64), which provided funds to support science associated with recovery and rebuilding activities in the wake of the 2017 Hurricanes Irma and Maria.
Special thanks to our colleagues at University of Puerto Rico, Professor Maritza Barreto-Orta and her research students Loderay Bracero-Marrero, Nias Hernández-Montcourt, and Rubén Maldonado-González for their efforts creating and contributing to the compilation of shoreline data for this update. Working in conditions that were unprecedented at the time, they developed creative solutions to collaborate with U.S. Geological Survey (USGS) scientists and generate shoreline data in a completely remote environment. Additional support was provided by researchers Laura Martí, Leticia Silva, Tatiana Gladkikh, and Zulimar Alvira.
Additional thanks go to Amy Faris and Kathy Weber of the USGS for the contributions in the underlying data releases, the calculation of mean high water elevation value for Puerto Rico, and the extraction of profile shorelines from lidar data.
This collaboration between the USGS and the Coastal Research and Planning Institute of Puerto Rico maintains local data extraction, data sharing from academic research, data evaluation and validation, and supports the use of research and technical data to solve problems by stakeholders and decision-making sectors. In addition, the collaboration expands the knowledge of students and new professionals.
Abstract
The U.S. Geological Survey (USGS) maintains a database of historical shoreline positions for the United States coasts derived from historical sources, such as aerial photographs or topographic surveys, and contemporary sources, such as modern orthophotography, light detection and ranging (lidar) point clouds, and digital elevation models. These shorelines are compiled within a geographic information system and analyzed in the USGS Digital Shoreline Analysis System (version 5.1) software to calculate rates of change. Keeping a record of historical shoreline positions is an effective method to monitor change over time, enabling scientists and resource managers to identify areas that are historically most susceptible to erosion or accretion.
The effort in this report represents an expansion of the USGS national-scale shoreline database to include Puerto Rico and the islands of the territory, Vieques and Culebra. The USGS, in cooperation with the Coastal Research and Planning Institute of Puerto Rico (part of the Graduate School of Planning at the University of Puerto Rico, Río Piedras Campus) has derived and compiled a database of historical shoreline positions for Puerto Rico from the early 1900s through 2018, with the goal of providing beneficial insight for coastal managers and communities vulnerable to coastal change.
Introduction
The coastal areas of the United States are dynamic interfaces between water and land. They are often locations of concentrated population and infrastructure as well as the site of Federal, State, Tribal, and local municipal landholdings managed for recreation and conservation. These areas are frequently subjected to a range of natural hazards, which include flooding, storm effects, and coastal erosion. In response to increasing coastal hazards and as part of the Coastal and Marine Hazards and Resources Program of the Coastal Change Hazards priority, the U.S. Geological Survey (USGS) has been compiling historical shoreline data along open-ocean sandy shores of the conterminous United States, parts of Alaska, and Hawaii. One component of this research effort documents changes in shoreline position, which are used as a proxy for identifying areas susceptible to coastal change. Shoreline position is one of the most monitored indicators of coastal change (for example, Morton, 1996), and it is an easily understood feature marking the location of a beach through time.
A principal focus of the shoreline change effort has been to develop a consistent methodology for compiling historical data, calculating shoreline change rates, and reporting results that can be periodically updated when additional data or improved techniques are available. Since 2004, the USGS has been publishing results of shoreline monitoring work organized and presented by coastal region, including the U.S. Gulf of Mexico coast (Morton and others, 2004), the southeast Atlantic coast (Morton and Miller, 2005), California sandy shorelines (Hapke and others, 2006) and coastal cliffs (Hapke and Reid, 2007), the New England and mid-Atlantic coasts (Hapke and others, 2011), parts of the Hawaii coast (Fletcher and others, 2012), the Pacific Northwest coasts (Ruggiero and others, 2013), and parts of the Alaska coast (Gibbs and Richmond, 2015). Updates to the southeast Atlantic coast (Kratzmann and others, 2017, 2021), Gulf of Mexico coast (Himmelstoss and others, 2017), Massachusetts coast (Bartlett and others, 2021), and Alaska coast (Gibbs and Richmond, 2017; Gibbs and others, 2019) have also been published.
During Hurricane Maria in 2017, Puerto Rico experienced significant coastal effects to beaches, dunes, mangroves, and coral reefs (Barreto-Orta and others, 2019; Branoff, 2020; Viehman and others, 2020; Zimmerman and others, 2020; Storlazzi and others, 2021). These hazards put critical infrastructure at risk to future flooding and erosion (Mendez-Tejeda and others, 2020; Zimmerman and others, 2020). The impact of this storm provided the impetus to expand the USGS shoreline monitoring to this region. In cooperation with the Coastal Research and Planning Institute of Puerto Rico (part of the Graduate School of Planning at the University of Puerto Rico) existing historical shoreline data were compiled (Barreto-Orta and others, 2019; Bracero-Marrero and others, 2021; Heslin and others, 2021b), and new shoreline data were extracted (Heslin and others, 2021a) to evaluate coastal erosion along Puerto Rico and its islands, Culebra and Vieques. Shoreline positions from the early 1900s through 2018 were compiled to generate shoreline change rates for these regions (Henderson and others, 2021). The shoreline positions and updated coastal change rates provide actionable information to homeowners, coastal communities, and managers of public and private properties to improve resiliency for long-term hazards.
This report is an update and expansion of existing shoreline change reports for Puerto Rico from a variety of sources and a first attempt for the USGS to compile available shorelines, create new shorelines, and generate rates of change for all of Puerto Rico. Previous studies (Morelock, 1978; Thieler and Danforth, 1993; Barreto-Orta, 1997 Morelock and others, 2001, 2010; Morelock and Barreto, 2003; Thieler and others, 2007; Barreto, 2017; Barreto-Orta and others, 2019; Barreto and others, 2021) have provided background research and laid the groundwork shoreline change data for extensive areas of Puerto Rico. Here we have combined newly extracted shoreline data with shorelines from these past studies to update the existing shoreline analysis and provide a baseline for future shoreline research in this dynamic region. This report includes sections that, where relevant, have been repurposed and in some cases copied from recent USGS national shoreline reports, including Hapke and others (2011), Ruggiero and others (2013), and Kratzmann (2022).
Environmental and Geologic Framework of Puerto Rico
The main island of Puerto Rico is between the Atlantic Ocean and the Caribbean Sea, approximately between latitudes 18°31′ and 17°55′ N and longitudes 65°37′ and 67°17′ W. The main island is nearly rectangular, with an east-to-west distance of 178 kilometers (km) and a north-to-south distance of 62 km. The island coastline is approximately 1,285 km. East of the main island are two small island municipalities, Vieques and Culebra, with total coastline lengths of approximately 110 km and 48 km, respectively.
Caribbean islands are frequented by hurricanes, winter storms, and North Atlantic swells that may modify geomorphological features along the coastline in both short- and long-term periods. They are also affected by other natural hazards, such as sea-level rise and earthquakes, which have a potential to alter the location where the sea meets the land. In Puerto Rico, shoreline changes were identified after the passage of two major hurricanes (Irma and Maria) approximately 2 weeks apart in September 2017. Hurricane Maria produced major losses in beach width and elevation on beaches in the west-northwestern (from Mayagüez to Camuy), north-central (from Arecibo to west San Juan), and southeastern (from Ceiba to Santa Isabel) municipalities of Puerto Rico (Barreto-Orta and others, 2019). The impacts of these types of storms and flooding can be carried further inland as sea levels rise, affecting a greater area. Changes in relative sea levels at San Juan have been documented at an average of 1.8 centimeters (cm) per decade since 1962 (Runkle and others, 2022), corresponding to an increase of approximately 10.7 cm in the last 60 years. Moreover, since December 2019, the southern part of Puerto Rico has experienced an active seismic period, including a 6.4-magnitude earthquake on January 7, 2020. This event caused remarkable geomorphic changes, the destruction of coastal infrastructure, and coastal subsidence resulting in flooding (Pérez-Valentín and others, 2021). The effects of subsidence from recent earthquake activity make this region more vulnerable to storms and waves, influencing shoreline changes in the future.
Study Area
The coast of the main island of Puerto Rico was divided into five regions for the shoreline change analysis: North, East, South, West, and Northwest. These were determined based on two criteria: general geographic location and wave energy regimes (Barreto-Orta, 1997). In addition, the islands of Vieques and Culebra are summarized as separate regions (fig. 1). Regarding wave energy regimes, the coast of the North region is characterized by swells and winter storm waves. From Aguadilla to Fajardo, coastal sites are exposed to North Atlantic winter swells (Canals Silander and García Moreno, 2019). In contrast, the coasts of the South and West regions are sheltered from these large waves and, in some areas, are surrounded by a series of keys (Cayo Enrique and Cayo Laurel in Lajas) and mangrove shorelines that offer some protection from wave energy. Similarly, the coast of the East region is sheltered from larger waves by Vieques and Culebra. It is also important to distinguish between the West and Northwest regions because of differences in the insular platform and exposure to swell (Barreto-Orta, 1997).
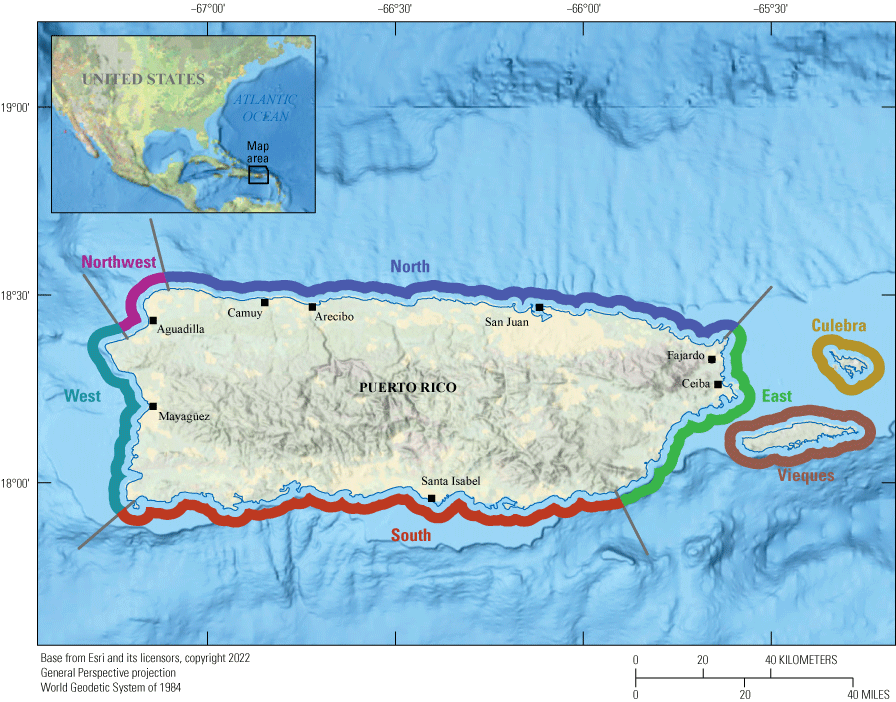
Map of Puerto Rico with regions defined by geographic location for the analysis of historical shoreline change along the coasts of Puerto Rico, Culebra, and Vieques.
The insular shelf surrounding Puerto Rico ranges in width from less than 0.5 km on the northern shelf to more than 25 km on the western shelf. The greater width of the shelf reduces the occurrence of high amplitude waves. As presented by Canals Silander and García Moreno (2019), the calculation of wave power surrounding Puerto Rico includes terms for wave height and the impact they have in the near shore. The variation of wave energy environments for Puerto Rico, Vieques, and Culebra are identified in figure 2. The white lines indicate wave power contours, and the black dashed line represents the 30-m depth contour.
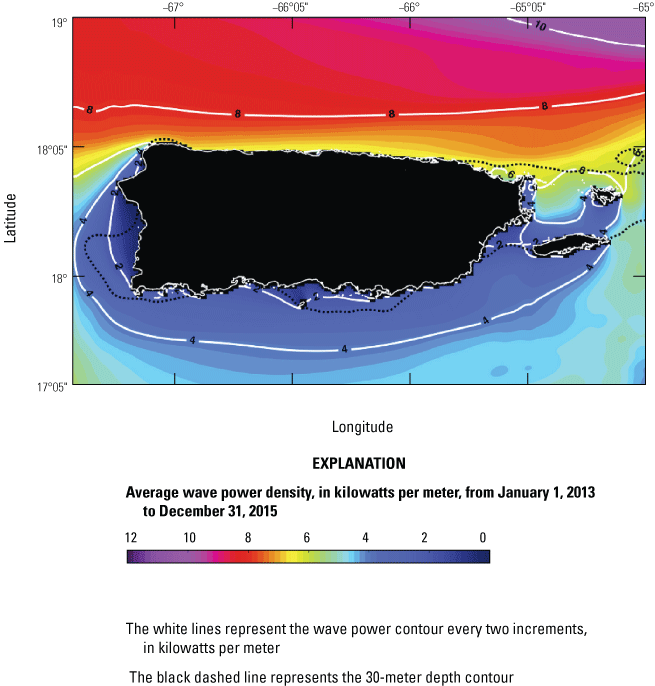
Map of Puerto Rico, Culebra, and Vieques, showing average wave power density, in kilowatts per meter of wave front, from January 1, 2013, to December 31, 2015. Modified from Canals Silander and García Moreno (2019, fig. 5).
Shoreline Classification
Four main shoreline types were identified in Puerto Rico, Vieques, and Culebra: beach (unconsolidated sediment deposit), vegetated (wetlands, mangrove, forests, and pasture, among other vegetation), rocky shorelines (including bedrock bluffs or cliffs, beach rock, and aeolianites), and human engineered (coastlines engineered with hard structures or other anthropogenic modifications). The most commonly occurring shoreline type throughout Puerto Rico is beach (30 percent), followed by vegetated (28 percent), rocky shorelines (15 percent), and human engineered (18 percent). The island has approximately 1,225 beaches in 44 coastal municipalities, including Vieques and Culebra (Barreto-Orta and others, 2019). These beaches vary greatly in width and length, slope, sediment grain size, and composition because of the complexity of both geologic and oceanographic processes identified at island systems. Beach rock formations and aeolianites exposed around the tidal platform are found in many locations and may offer protection from erosion by providing a natural wave break. Other areas of the coast, particularly the South coast, are protected by dense mangrove forests. The areas that experience the highest rates of erosion are generally of the shoreline type classified as beach. The geologic setting, coastal classification, and the connection to erosion following Hurricane Maria are detailed by Barreto-Orta and others (2019).
The shoreline change assessment was primarily focused in areas classified as sandy shorelines; however, there is some variation of shoreline types included in the assessment because change was observed in areas classified as developed, along vegetated shorelines, or at the base of a rocky headland. In most cases transects classified as mangrove, rocky cliff, developed or human engineered were removed from the analysis. Figure 3 provides an overview of the shoreline types by region, synthesized from the 2010 shoreline classification by Bracero-Marrero and others (2021).
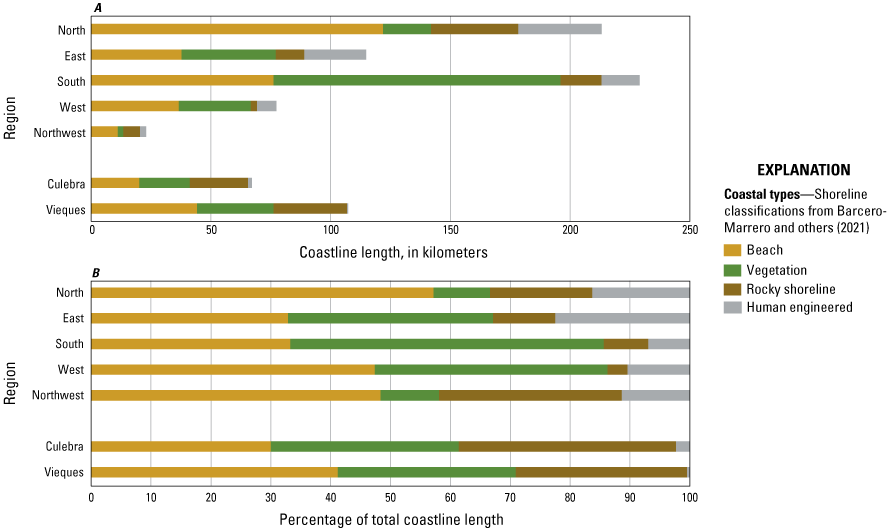
Bar graphs showing shoreline classification for Puerto Rico, Vieques, and Culebra as A, cumulative length of shoreline type in kilometers for each region and B, shoreline type by percentage of total coastline length.
Methods of Extracting Shoreline Position and Measuring Change
Shoreline data compiled for this report were derived from elevation-based three-dimensional data, such as light detection and ranging (lidar) point clouds and digital elevation models, and two-dimensional sources, such as topographic surveys or aerial photographs. To create the shoreline database, the following three USGS data releases were combined: University of Puerto Rico-derived shorelines from 1970 and 2010 extracted from aerial photographs (Bracero-Marrero and others, 2021), USGS shorelines from 1901 to 1987 compiled from historical reports (Heslin and others, 2021b), and the most recent shorelines from 2015 to 2018 derived from lidar (Heslin and others, 2021a). These shorelines were compiled in ArcGIS and analyzed in the USGS Digital Shoreline Analysis System (DSAS), version 5.1 software (Himmelstoss and others, 2018) to calculate rates of shoreline change. The shorelines and rates of change were published by Henderson and others (2021).
Delineating Proxy-Based Shorelines
The shoreline data from 1970 and 2010 (Bracero-Marrero and others, 2021), was digitized from georeferenced photographs and used various shoreline proxies: high-water line (HWL), groundwater exit point, wet-dry line (WDL), or the instantaneous water line as specified in the shoreline data attribute table and described in the metadata of the datasets used. Common shoreline proxies are reviewed in detail by Boak and Turner (2005). Shoreline data ranging from 1901 to 1987 (Heslin and others, 2021b) rely on user interpretation of shoreline location from the data source (historical aerial photography and topographic surveys) and may vary according to the proxy used. The variations are accounted for in the calculation of shoreline positional uncertainty as described in the “Uncertainty and Error” section of this report.
Delineating Datum-Based Shorelines
The shoreline data derived from lidar are defined by the datum-based mean high-water (MHW) elevation using either a contour or profile method to extract shorelines (Farris and others, 2018). Both methods use the MHW elevation to represent the shoreline. The average MHW for Puerto Rico was calculated by Heslin and others (2021a) using the National Oceanic and Atmospheric Administration (2020) VDatum tool (version 4.1.2) to model the regional surface using local MHW values based on the Puerto Rico Vertical Datum of 2002. Following the method used by Weber and others (2005), a single, average MHW value for a continuous section of coast was used (as opposed to using a continuously varying value). The MHW value from all tide observation stations on the main island of Puerto Rico, Vieques, and Culebra ranged from 0.09 to 0.19 meter (m). Taking the mean from those MHW observations resulted in an elevation of 0.13 m. This one contour value was used to delineate the shoreline and is recorded as the contour attribute in the MHW shoreline data shapefile for 2015, 2016, and 2018 (Heslin and others, 2021a). For additional details of the contour and profile method of shoreline extraction for Puerto Rico, see the complete data release by Heslin and others (2021a). For a discussion on the impact of choosing one MHW over multiple regional MHW values, see the “Considerations for Future Work” section of this report.
Uncertainty and Error
Each of the published data releases accounted for sources of uncertainty. In general, each shoreline positional accuracy measurement attempts to account for (1) errors inherent to the data source, (2) errors and uncertainty related to the interpretation of the shoreline proxy, and (3) errors related to the extraction of the shoreline data from the data source. Various terms are defined for each shoreline data product, and they are combined in quadrature to calculate the shoreline positional uncertainty for each shoreline date. For additional information and equations for calculating shoreline positional uncertainty, see Ruggiero and others (2013, p. 7–17).
For the lidar shorelines, Heslin and others (2021a) used terms related to the vertical and horizontal uncertainty of the lidar data, the cell size of the lidar data, uncertainty of the MHW elevation value, and uncertainty caused by extrapolation. For the shorelines derived from aerial photos and topographic surveys, Heslin and others (2021b) and Bracero-Marrero and others (2021) used terms that include uncertainty related to georeferencing of the source material, an error accounting for digitization error, the pixel size of the digitized data, and an estimated horizontal uncertainty in the shoreline position since the HWL varies with tide. For complete details on the calculation of individual shoreline positional uncertainty, see the process steps in the metadata of each data release (Heslin and others 2021a, b21; Bracero-Marrero and others, 2021).
The range of horizontal positional uncertainty for all shorelines varies from less than a meter for the lidar data, up to 13 m for some of the oldest datasets. The positional uncertainty for each shoreline is included as an attribute with the compiled shoreline data in Henderson and others (2021). Summarized in table 1 are the year, source, shoreline proxy, source data agency, and range of published uncertainty for the given year.
Table 1.
Shoreline data used for shoreline change analysis for Puerto Rico, Vieques, and Culebra.[For spatial coverage over time, see figure 5. m, meter; T-sheet, topographic survey; lidar, light detection and ranging; HWL, high-water line; WDL, wet-dry line; MHW, mean high-water line; NOAA, National Oceanic and Atmospheric Administration ; USGS, U.S. Geological Survey; PRDC, Departamento de Carreteras (Puerto Rico Department of Transportation); USDA-SCS, United States Department of Agriculture Soil Conservation Service; PRDNR, Departamento de Recursos Naturales (Puerto Rico Department of Natural Resources); NGS, National Geodetic Survey; USACE, United States Army Corps of Engineers; FEMA, Federal Emergency Management Agency]
Measuring Shoreline Change
Shoreline change for Puerto Rico, Vieques, and Culebra was computed using the DSAS version 5.1 software (Himmelstoss and others, 2018). The software was used to generate cross-shore transects at 50 m interval spacing along the coast. A visual assessment of the transects with shorelines, shoreline classification data (Barreto and others, 2021), and underlying base-map imagery was performed to make the final determination of transect suitability. Once transects were established and verified, DSAS was used to calculate long-term (approximately 120 years) and short-term (approximately 40 years) linear regression rates of shoreline change. Figure 4 illustrates an example of a transect with eight shoreline intersection points and how the distance from each point to a baseline is measured. The figure also demonstrates the different range of shoreline dates used to calculate short-term and long-term change.
The shoreline change rates and rate uncertainties at individual transect locations in Puerto Rico are available in the data release associated with this report (Henderson and others, 2021). This report also provides summary information for long-term and short-term shoreline change for each region, as well as maximum values of erosion and accretion at individual locations.
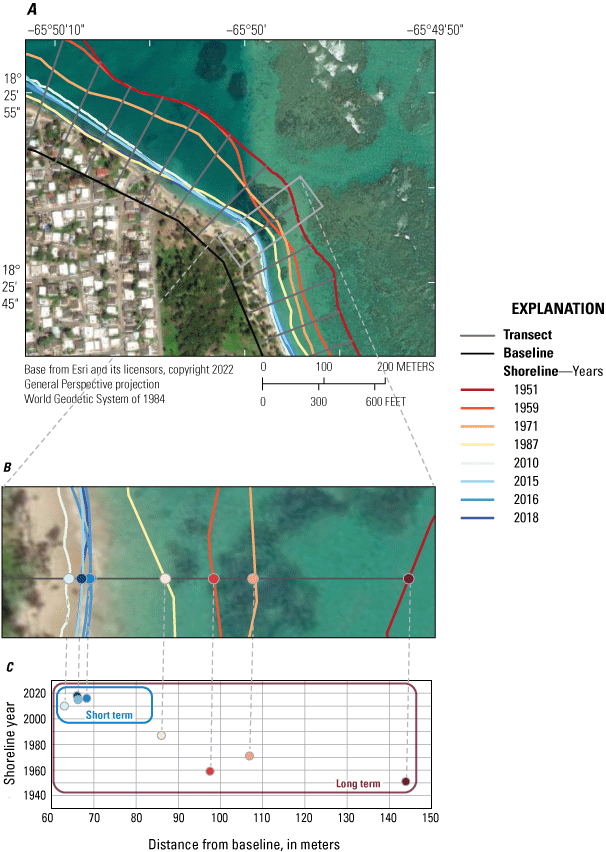
Aerial photographs of Punta Uvero, Loíza, in the North region of Puerto Rico showing A, shoreline change components, B, a close up of a transect in the area with shoreline and shoreline-intersect positions, and C, a graph showing the distance from each shoreline intersect from the baseline and which positions are used for short- and long-term analysis.
Calculating Rate Uncertainty
This section is modified from the discussion of the methods for calculating and interpreting shoreline change results produced by a study of the Georgia and Florida coasts by Kratzmann (2022); where needed, parts of the report were replicated verbatim. Following Ruggiero and others (2013), each transect rate uncertainty was reasoned to be partially independent of the others. Given that some cancellation of the individual uncertainty components is likely in a regional analysis and transect uncertainties are not likely to be independent of all the others, a partial independence approach reduces both overestimation and underestimation of the uncertainty (Ruggiero and others, 2013). To estimate the regionally averaged uncertainty of partially independent transect rates, the effective number of independent uncertainty values, n* (reduced n) was evaluated. Following Garrett and Toulany (1981), n* was found based on the spatially lagged autocorrelation of measurement uncertainty. For our measurement uncertainty, we used each measure of shoreline change rate uncertainty. This method resulted in a large reduction of the original sample size, n. Assuming that the uncertainty of an area can be represented by , we found the uncertainty of a regionally averaged change rate as follows:
The reduced effective sample size (n*) and regional uncertainty () was determined for the seven study regions (North, East, South, West, Northwest, Vieques, and Culebra). Average uncertainty values found using equation 1 are generally much smaller than the arithmetic mean confidence interval (CI) but larger than the quadrature-averaged CI (Ruggiero and others, 2013). See appendix 1 for the regionally averaged uncertainty and averaged CI values for each region.
Results From Historical Shoreline Change Analysis
This shoreline change analysis combines the shorelines from three corresponding USGS data releases (Bracero-Marrero and others, 2021; Heslin and others, 2021a, b) and includes shorelines from historical aerial photographs and topographic surveys (1901–1987), and from more recent orthophotographs (2010) and lidar datasets (2015–2018). The spatial and temporal distribution of available shorelines varies significantly across regions. For instance, even though the South region covers the largest coastal area, shoreline change was only measured for 40 to 45 percent of the total coastline because of the limited availability of shoreline sources and the less frequent occurrence of sandy shorelines (fig. 2). The timeframe of available shorelines for Puerto Rico ranged from 1901 to 2018. A total of 29 shoreline dates were available, with some locations having as many as 17 observed shorelines and others having fewer than 3. The resulting rates of change are based on a combination of shorelines that may be unique to each location. Figure 5 displays the geographical coverage of shorelines for locations where change was measured, as well as a visual breakdown of the shoreline dates over time that comprise the long-term and short-term rates of change. The varying distribution and frequency of shorelines by region is listed in table 2.
Shoreline data coverage for Puerto Rico, Vieques, and Culebra between the 1900s and 2018. A, Bar graph showing the relative percentage coverage of total shorelines and B, map showing the geographical coverage of shorelines.
Table 2.
Date range and number of shorelines used to determine the long- and short-term shoreline change rates for regions in Puerto Rico and the islands of Vieques and Culebra.[Regions are defined in figure 1]
Average rates of short-term and long-term shoreline change and the associated values of uncertainty for the coasts of Puerto Rico, Vieques, and Culebra are presented in table 3. The average rates were computed considering all the values (average change rate), only the positive rates (average accretion rate), and only the negative rates (average erosion rate). It is important to distinguish between short- and long-term rates because the signal of shoreline change may vary depending on the period used. Historically, the USGS national compilation of shoreline change has used shoreline positions within the past 30 years to compute short-term rates of change. However, this study included data going back roughly 40 years to ensure there were enough shoreline data available to measure a short-term rate. For a linear regression rate, there must be at least three shorelines available at each transect location. As a result, transects with fewer than three shoreline intersection points are not reported in this analysis. Most often, this happened where removing the old shoreline data to calculate a short-term rate yielded an insufficient number of shorelines required for the linear regression analysis. There were approximately 200 fewer short-term transect locations than long-term transects in the database for the main island of Puerto Rico and nearly 450 fewer short-term transect locations than long-term transect locations for Vieques and Culebra.
Table 3.
Average long- and short-term shoreline change rates for regions in Puerto Rico and the islands of Vieques and Culebra.[Number of transects, average linear regression shoreline change rates with reduced n uncertainty, percentage of erosional transects, percentage of accretional transects, and average erosion and accretion (positive and negative values separated then averaged) for the Puerto Rico regions: North, East, South, West, Northwest, Vieques, and Culebra. Regions are shown in figure 1. Dates used to determine change rates for each region are listed in table 2. Positive rates indicate accretion or seaward movement; negative rates indicate erosion or landward movement. m/yr, meter per year; n*, reduced n uncertainty; ±, plus or minus]
It is important to note that in some locations the magnitude of the 90 percent CI is larger than the rates of change. If the value of the rate plus or minus the 90 percent CI crosses zero, the upper and lower values of the range are not entirely positive or entirely negative; change rates in these locations may not be statistically significant and should be considered carefully. Note that rates with a 90 percent CI value many times larger than the rate of change indicate the rate of change is not captured within the linear fit to the data. This does not mean the rate of change is inaccurate; it can merely indicate data for that location do not fit well within a linear model. Table 4 summarizes the maximum shoreline change per region and distinguishes between statistically significant locations. The rest of this section provides an overview of the results by region.
Table 4.
Greatest amounts of shoreline change for regions in Puerto Rico and the islands of Vieques and Culebra.[Short-term and long-term erosion rates at maximum erosion and maximum accretion locations for each region in the study area. Locations of rates of change are highlighted in each corresponding regional map. Positive rates indicate accretion or seaward movement; negative rates indicate erosion or landward movement. ±, plus or minus]
North Region
The most commonly occurring shoreline type in the North region (fig. 3B) is beach (57 percent), followed by rocky shorelines (17 percent; includes bluffs, beach rock, and aeolianites), human engineered structures and modifications (16 percent), and finally vegetated shoreline type (9 percent; mainly mangroves).
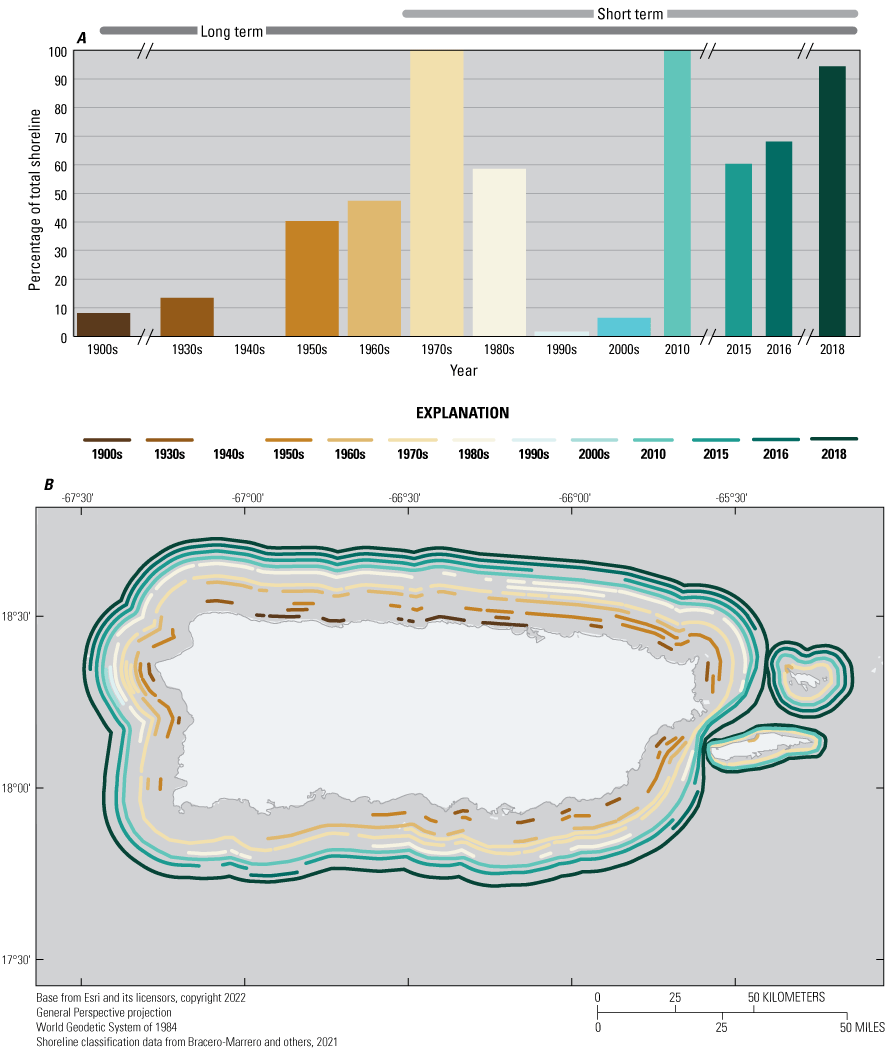
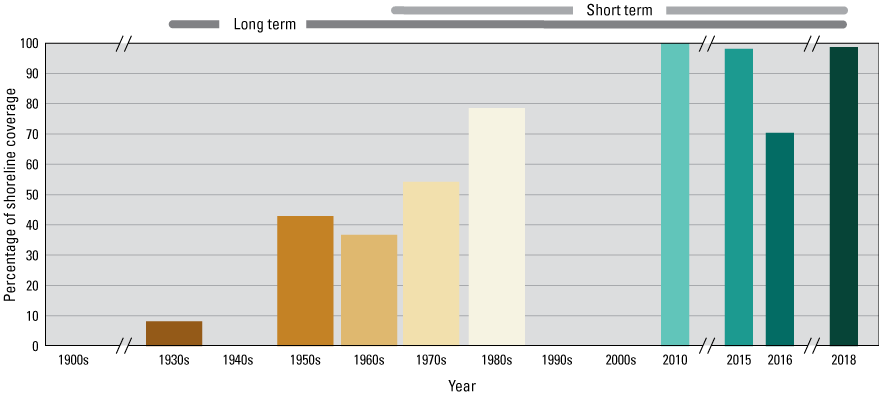
The percentage coverage (length of each shoreline year compared to the total shoreline for the region) of available shorelines over time for the North region is shown in figure 6. The long-term rate includes up to 10 shorelines from 1901 to 2018. While the coverage of some of these older shorelines was less than 30 percent of the study area extent. Up to six shoreline years from 1977 to 2018 were used to calculate short-term rates.
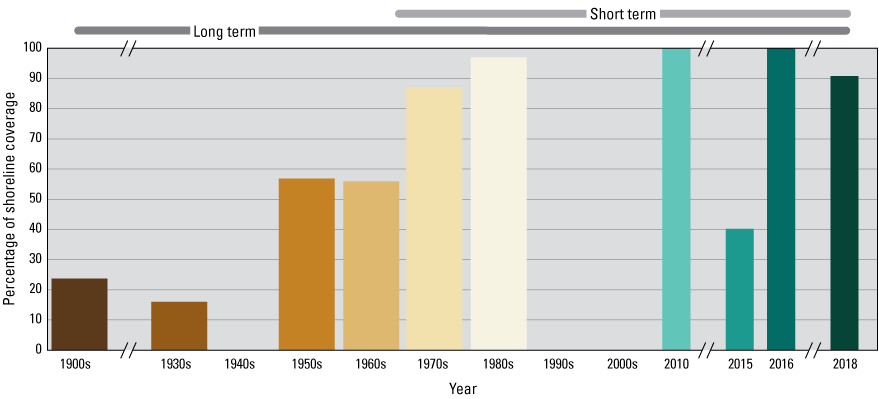
Bar graph showing the relative percentage coverage of shorelines over time for the North region of Puerto Rico between the 1900s and 2018 and the range of dates used to calculate long- and short-term rates of change.
For the North region of Puerto Rico, long-term shoreline change was measured for approximately 70 percent of the region, and short-term rates were measured for approximately 60 percent. The percentage of coastline suitable for shoreline analysis is influenced by the regional distribution of shoreline type and the number of available shoreline dates for the period. For the North region, areas not included in the shoreline change analysis were inland bays (such as Bahía de San Juan), select areas developed with armored structures, and locations with rocky cliffs.
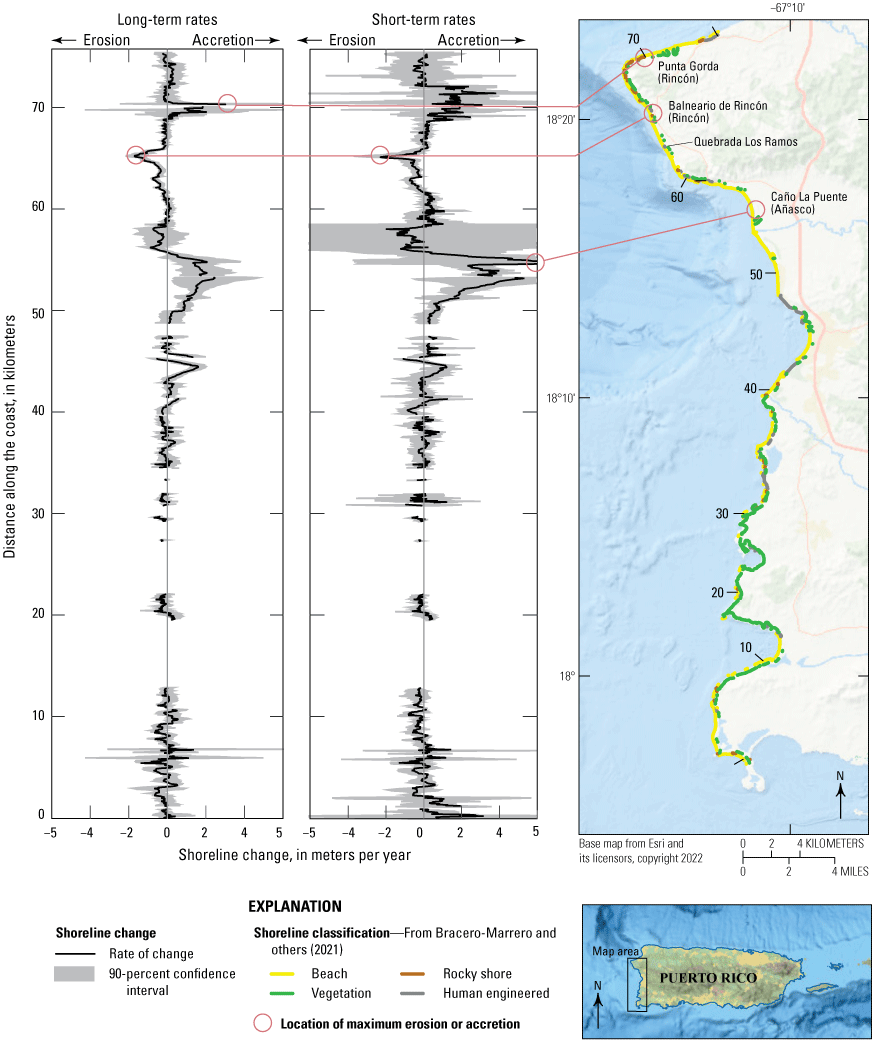
Average and maximum values of long-term and short-term shoreline change for the North region are shown in figure 7. These graphics are provided to assist users in a visual understanding of the statistical data provided in tables 3 and 4. The locations of maximum rates of change and other areas of interest are shown in figure 8, alongside plots of the short-term and long-term rates of change along the coast.
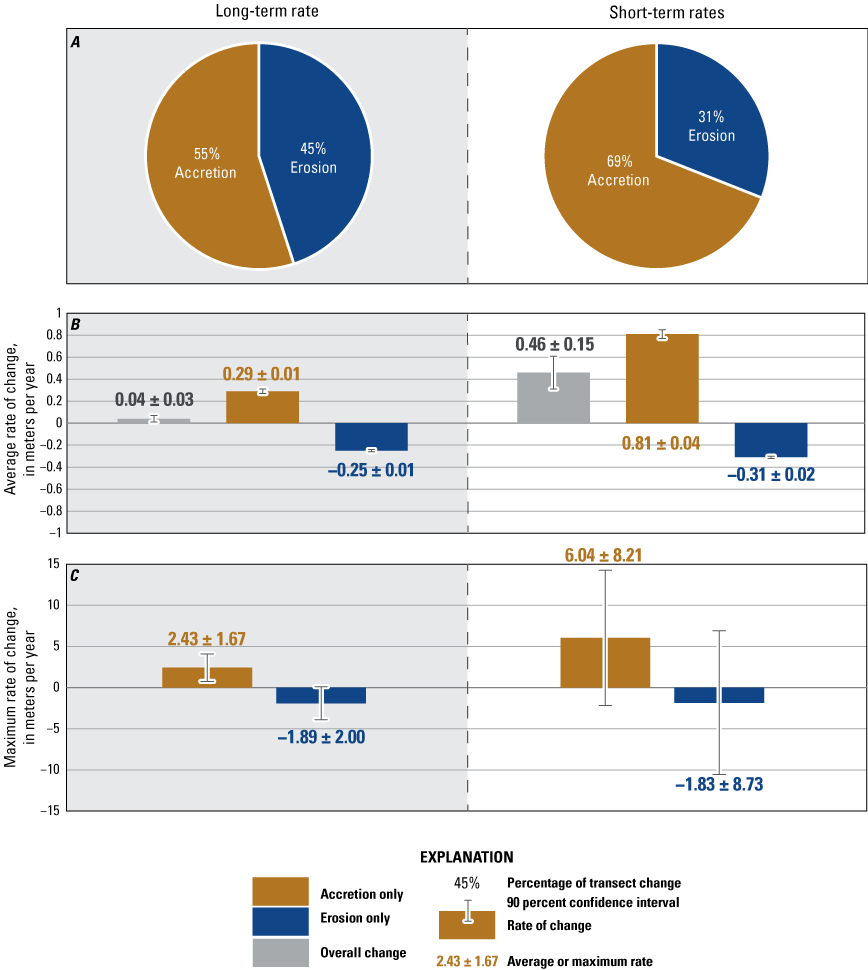
Summary of long-term (early 1900s–2018) and short-term (1970s–2018) shoreline change rates for the North region of Puerto Rico: A, Pie charts showing the percentage of accretionary and erosional transects, B, bar graph showing the average long- and short-term rates of change and average accretion and erosion rates, with corresponding 90 percent confidence intervals, and C, Maximum erosion and accretion.
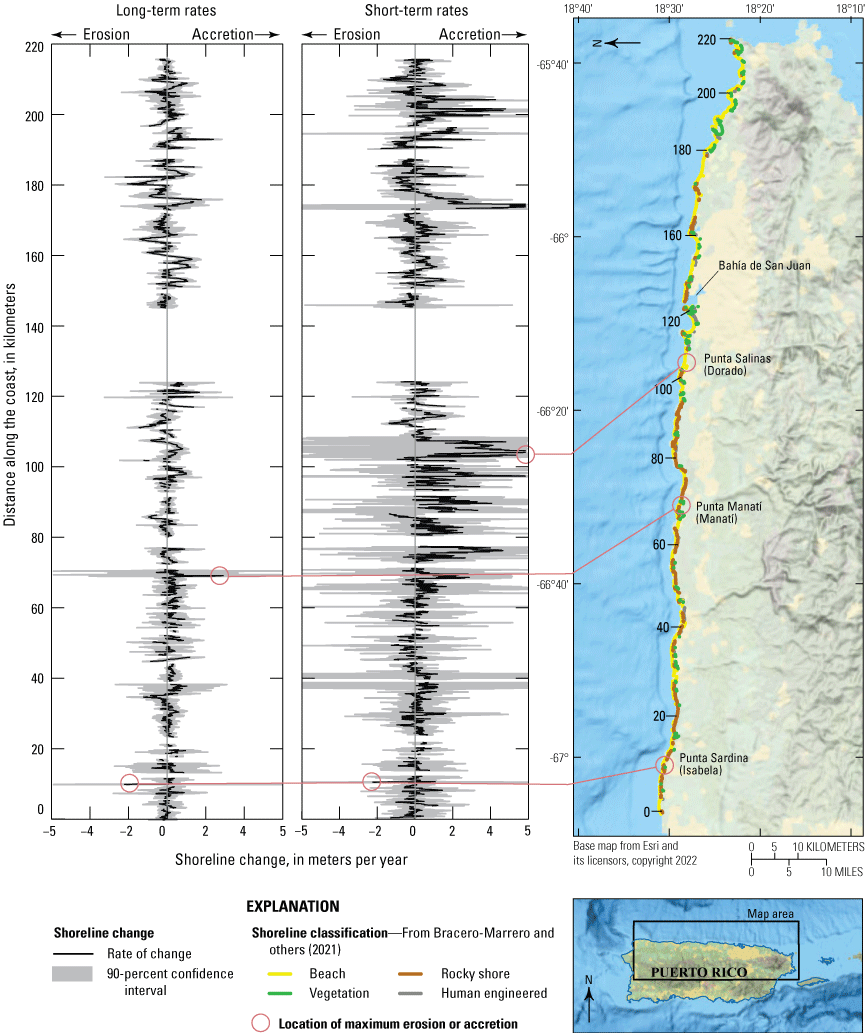
Long-term (1900s–2018) and short-term (1970s–2018) shoreline change rates along the North region of Puerto Rico.
The percentage of erosional transects decreased from 45 percent (long term) to 31 percent (short term), suggesting decreased erosion (or increased accretion) over time. However, this shift might also be explained by the differences between proxy-based HWL shorelines and datum-based MHW shorelines. Because MHW shorelines tend to be unidirectionally biased in a seaward direction compared with the HWL shorelines, the greater percentage of MHW shorelines used in the short-term analysis may result in an increased accretional signal. This offset is known as the proxy-datum bias (PDB; Ruggiero and List, 2009). In other regional assessments, the USGS calculated a PDB that was applied to older shorelines to account for the difference between the datum-based MHW position and proxy-based HWL shoreline. For Puerto Rico, the PDB for this research effort could not be generated. The “Proxy-Datum Bias” section of this report illustrates an example and includes additional details about the PDB.
The average short-term rate of change for the North region was positive, at 0.46±0.15 meter per year (m/yr). The average short-term erosion rate was −0.31±0.02 m/yr, and the average short-term rate of accretion was 0.81±0.04 m/yr. The largest short-term erosion rate, −1.83±8.73 m/yr, was observed at Punta Sardina, Isabela, whereas the maximum short-term accretion rate, 6.04±8.21 m/yr, was observed at Punta Salinas, Dorada.
The average long-term rate of change for the North region was positive, at 0.04±0.03 m/yr. The average long-term erosion rate was −0.25±0.01 m/yr, and the average long-term rate of accretion was 0.29±0.01 m/yr. The largest long-term erosion rate, −1.89±2.0 m/yr, was observed east of Punta Sardina, Isabela, whereas the maximum long-term accretion rate, 2.43±1.67 m/yr, was observed to the east of Punta Manatí, Manatí.
East Region
The most commonly occurring shoreline type in the East region (fig. 3B) is vegetated (34 percent; mainly mangroves), followed closely by beach (33 percent), human engineered structures and modifications (22 percent), and rocky shorelines (10 percent; includes bluffs, beach rock, and aeolianites).
The percentage coverage of available shorelines over time for the East region is shown in figure 9. There were up to six shorelines available for short-term analysis, and up to nine shorelines available for the long-term calculation from the 1930s to 2018. The coverage of shorelines from the 1930s to the 1960s is limited, so in many locations the short-term and long-term analysis was based on a similar range of dates.
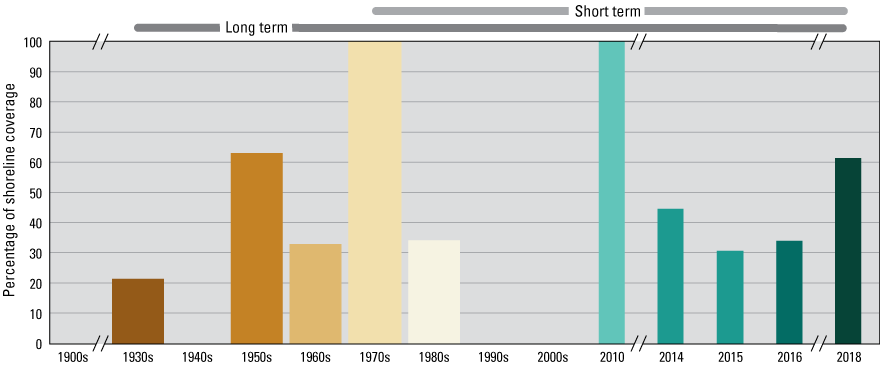
Bar graph showing the relative percentage coverage of shorelines over time for the East region of Puerto Rico between the 1930s and 2018 and the range of dates used to calculate long- and short-term rates of change.
For the East region of Puerto Rico, long-term shoreline change was measured for 60 percent of the coastline, and short-term analysis was conducted for approximately 55 percent. The percentage of coastline suitable for shoreline analysis is influenced by the regional distribution of shoreline type and the number of available shoreline dates for the period. For the East region, areas not included in the analysis are developed shorelines with armored structures, rocky cliffs, mangrove shorelines, and areas with insufficient shoreline data to generate a linear regression (less than three shorelines).
Average and maximum values of long-term and short-term shoreline change are compiled for the East region in figure 10. The locations of maximum rates of change and other areas of interest are shown in figure 11, alongside plots of the short-term and long-term rates of change along the coast. The percentage of erosional transects decreased from 51 percent (long term) to 34 percent (short term), suggesting either decreased erosion (or increased accretion) over time or the effect of PDB.
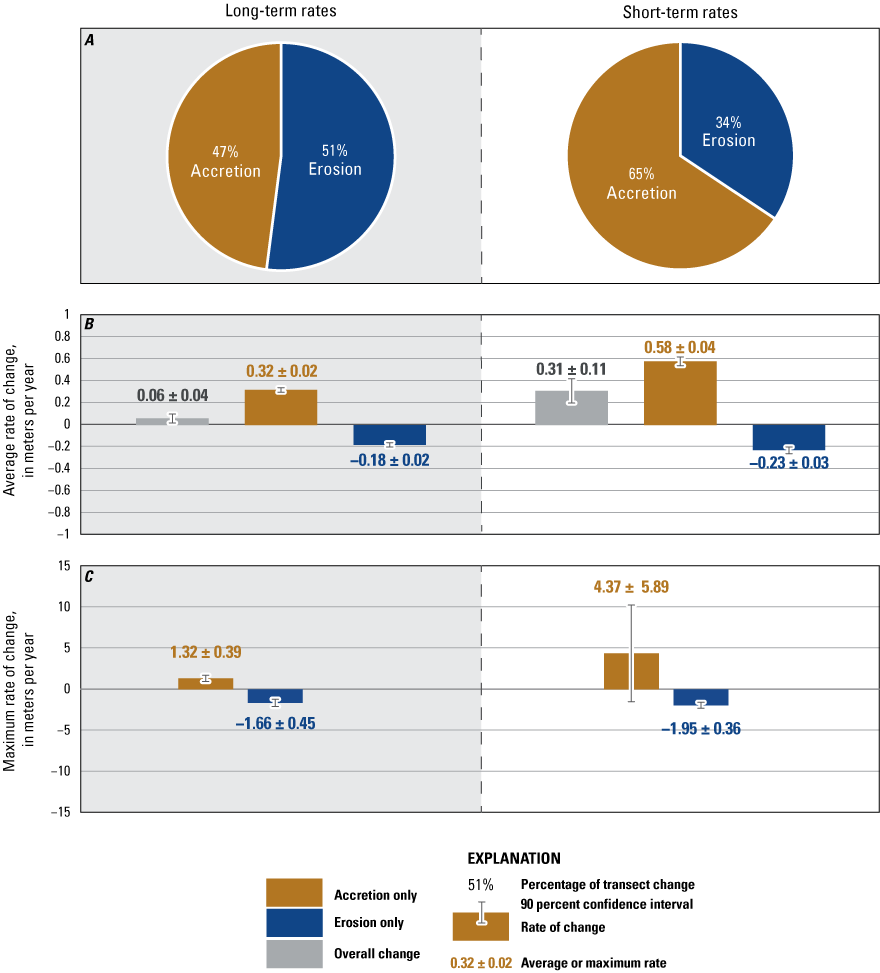
Long-term (1930s–2018) and short-term (1970s–2018) shoreline change rates for the East region of Puerto Rico: A, pie charts showing the percentage of accretional and erosional transects, B, bar graphs showing the average short- and long-term rate of change, as well as the average accretion and erosion rates, with corresponding 90 percent confidence intervals, and C, Maximum erosion and accretion.
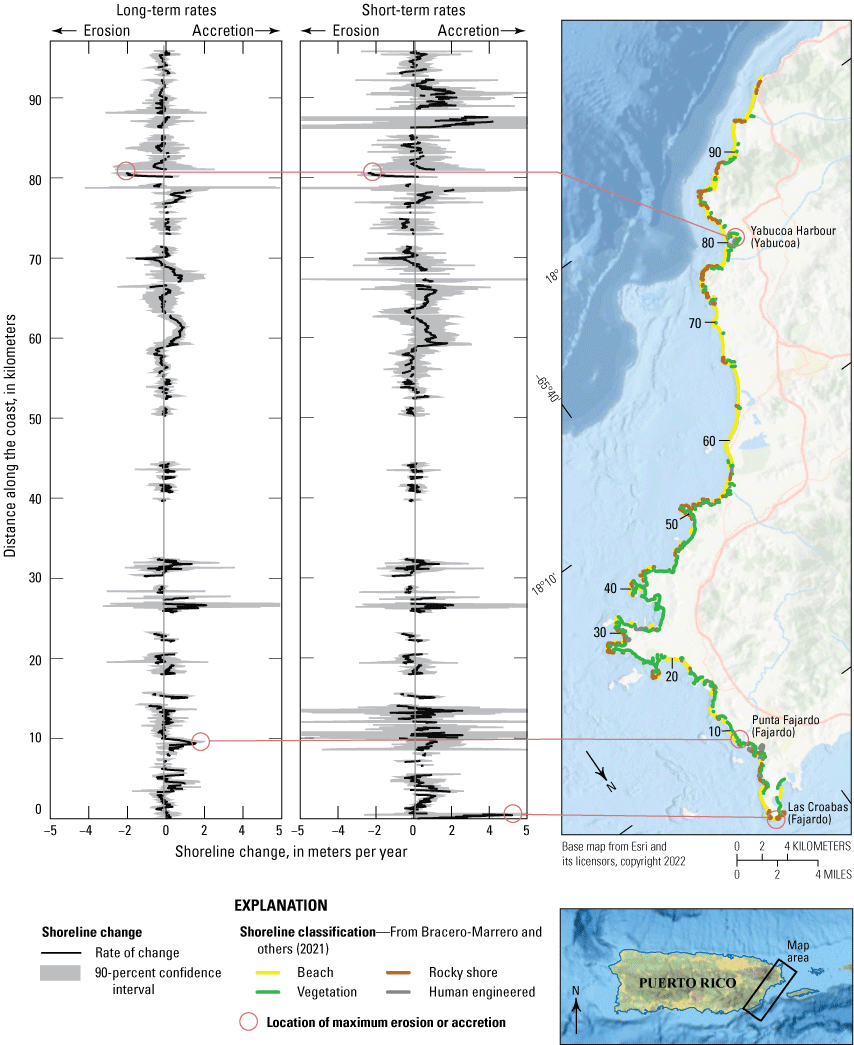
Long-term (1930s–2018) and short-term (1970s–2018) shoreline change rates along the East region of Puerto Rico.
The average short-term rate of change for the East region was positive, at 0.31±0.11 m/yr. The average rate of short-term erosion was −0.23±0.03 m/yr, and the average rate of accretion was 0.58±0.04 m/yr. The largest short-term erosion rate, −1.95±0.36 m/yr, was observed at Yabucoa Harbor, Yabucoa, and the maximum short-term accretion rate, 4.37±5.89 m/yr, was observed at Las Croabas, Fajardo.
The average long-term rate of change for the East region was positive, 0.06±0.04 m/yr. The average rate of erosion was −0.18±0.02 m/yr, and the average rate of accretion was 0.32±0.02 m/yr. The largest erosion rate, −1.66±0.45 m/yr, was observed at Yabucoa Harbor, Yabucoa. The maximum long-term accretion rate, 1.32±0.39 m/yr, was observed at Punta Fajardo, Fajardo. Note the similarity in shoreline trend between short term and long term at the 60- to 70-km distance mark alongshore (fig. 11). Similar to those observed in the North region, rates tend to be less erosional and more accretional from long term to short term.
South Region
The most commonly occurring shoreline type in the South region (fig. 3B) is the vegetated (52 percent; mainly mangroves), followed by beach (33 percent), human engineered structures and modifications (7 percent), and rocky shorelines (7 percent; includes bluffs, beach rock, and aeolianites).
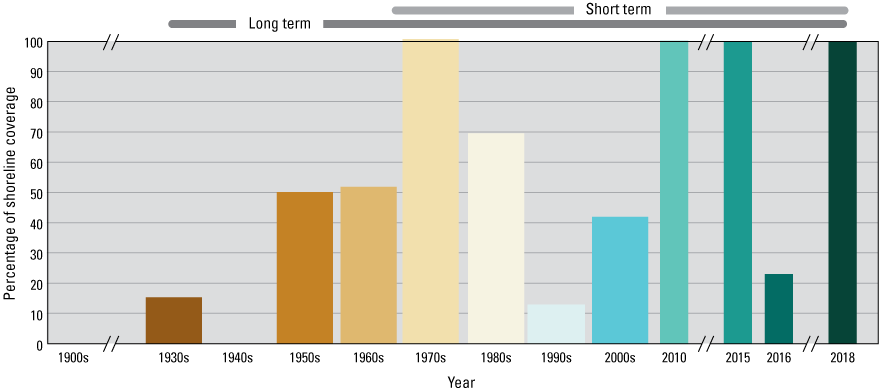
The percentage coverage of available shorelines over time for the South region is shown in figure 12. There were up to five shorelines available for short-term analysis, and a total of eight shorelines available for the long-term calculation, ranging from the 1930s to 2018. Because the number of historical shorelines before the 1970s are limited in some cases, the long-term and short-term rates are based on a similar span of shoreline dates.
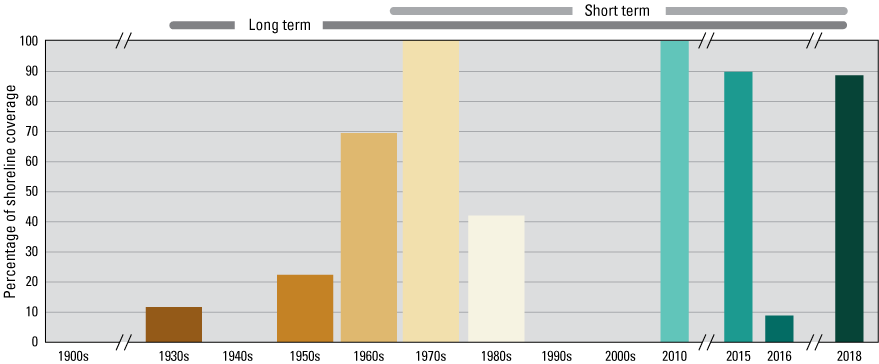
Bar graph showing the relative percentage coverage of shorelines over time for the South region of Puerto Rico from the 1930s to 2018 and the range of dates used to calculate long- and short-term rates of change.
For the South region, long-term shoreline change was measured for only 45 percent of the shoreline, whereas short-term change was measured for approximately 40 percent of the region. The percentage of coastline suitable for shoreline analysis is influenced by the regional distribution of shoreline type and the number of available shoreline dates for the period. For the South region, areas not included in analysis were primarily mangrove shorelines and areas with fewer than the three required shorelines needed to complete the linear regression.
Average and maximum values of long-term and short-term shoreline change for the South region are shown in figure 13. The locations of maximum rates of change and other areas of interest are shown in figure 14, alongside plots of the short-term and long-term rates of change along the coast. The percentage of erosional transects decreased slightly from 63 percent (long term) to 51 percent (short term), suggesting decreased erosion, increased accretion, or the presence of the PDB.
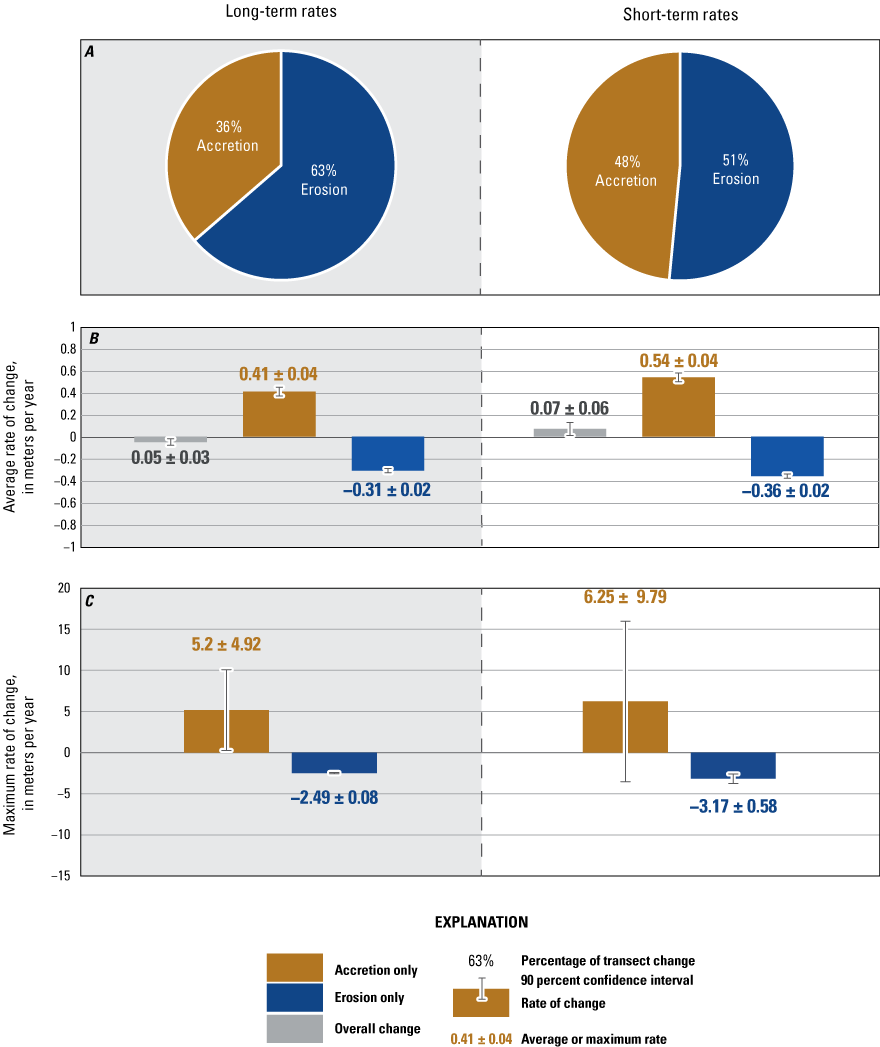
Summary of long-term (1930s–2018) and short-term (1970s–2018) shoreline change rates for the South region of Puerto Rico: A, pie charts showing the percentage of accretionary and erosional transects, B, bar graphs showing the average long- and short-term rate of change, as well as the average accretion and erosion rates, with corresponding 90 percent confidence intervals, and C, Maximum erosion and accretion.
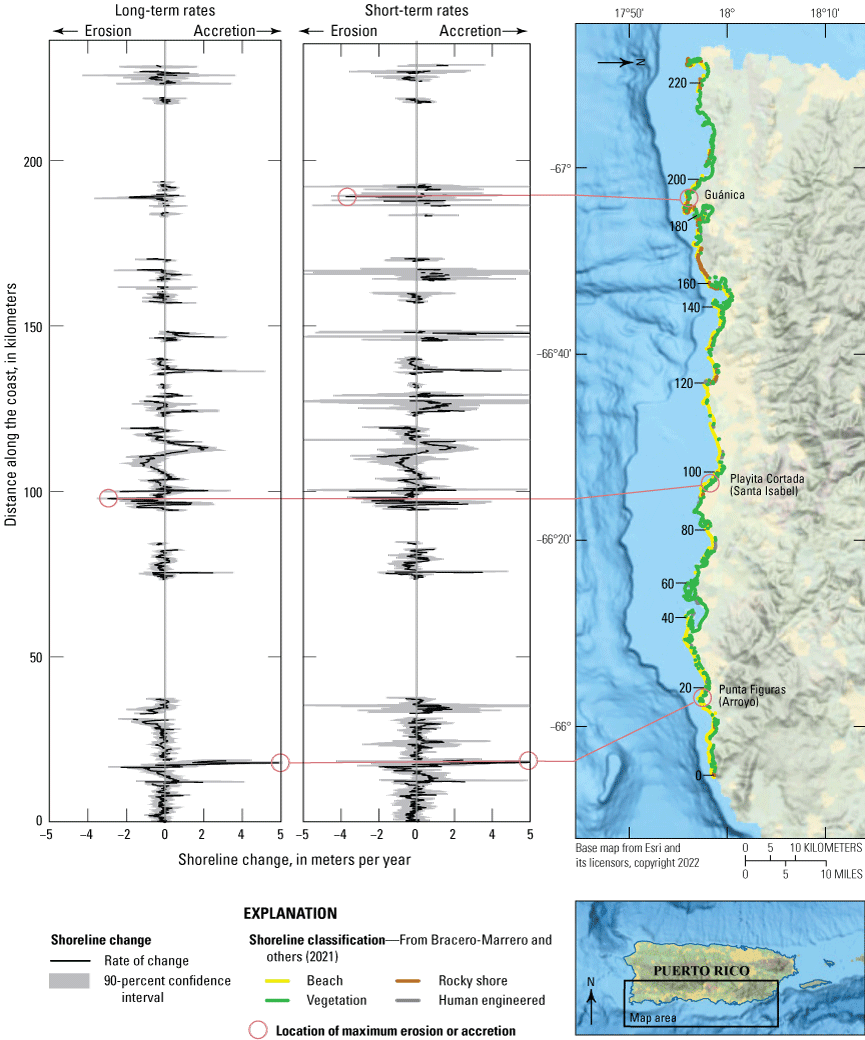
Long-term (1930s–2018) and short-term (1970s–2018) shoreline change rates along the South region of Puerto Rico.
The average short-term rate of change for the South region was positive, at 0.07±0.06 m/yr. The average rate of erosion was −0.36±0.02 m/yr, and the average short-term rate of accretion was 0.54±0.04 m/yr. The largest erosion rate, −3.17±0.58 m/yr, was observed at Guánica, and the maximum short-term accretion rate, 6.25±9.79 m/yr, was observed at Punta Figuras, Arroyo.
The average long-term rate of change for the South region was negative, at −0.05±0.03 m/yr. The average rate of erosion was −0.31±0.02 m/yr, and the average rate of accretion was 0.41±0.04 m/yr. The maximum erosion rate, −2.49±0.08 m/yr, was observed north of Punta Cayito, Santa Isabel. The maximum long-term accretion rate, 5.2±4.92 m/yr, was observed at Punta Figuras, Arroyo.
West Region
The most commonly occurring shoreline type in the West region (fig. 3B) is beach (47 percent), followed by vegetated (39 percent), human engineered structures and modifications (10 percent), and rocky shorelines (3 percent; includes bluffs, beach rock, and aeolianites).
The percentage coverage of available shorelines over time for the West region is shown in figure 15. For the West region, there were up to 12 shorelines available for short-term analysis, and as many as 17 shorelines available for the long-term calculation ranging from the 1930s to 2018. The data density along the West region is the result of existing shoreline change data from a USGS report that focused on the municipality of Rincón (Thieler and others, 2007). These data were published as part of the USGS historical shoreline data release (Heslin and others, 2021b) and included in this analysis.
Bar graph showing the relative percentage coverage of shorelines over time for the West region of Puerto Rico from 1930s to 2018 and the range of dates used to calculate long- and short-term rates of change.
For the West region, long-term shoreline change was measured for 70 percent of the coastline, and short-term change was measured for approximately 60 percent of the region. The percentage of coastline suitable for shoreline analysis is influenced by the regional distribution of shoreline type and the number of available shoreline dates for the period. For the West region, areas not included in analysis were primarily mangrove shorelines and locations with fewer than three shoreline positions available for analysis.
Average and maximum values of long-term and short-term shoreline change for the West region are shown in figure 16. The locations of maximum rates of change and other areas of interest are shown in figure 17, alongside plots of the short-term and long-term rates of change along the coast. The percentage of erosional transects decreased slightly from long term (52 percent) to short term (48 percent), suggesting a shift to accretional or stable and less of an effect from the PDB offset.
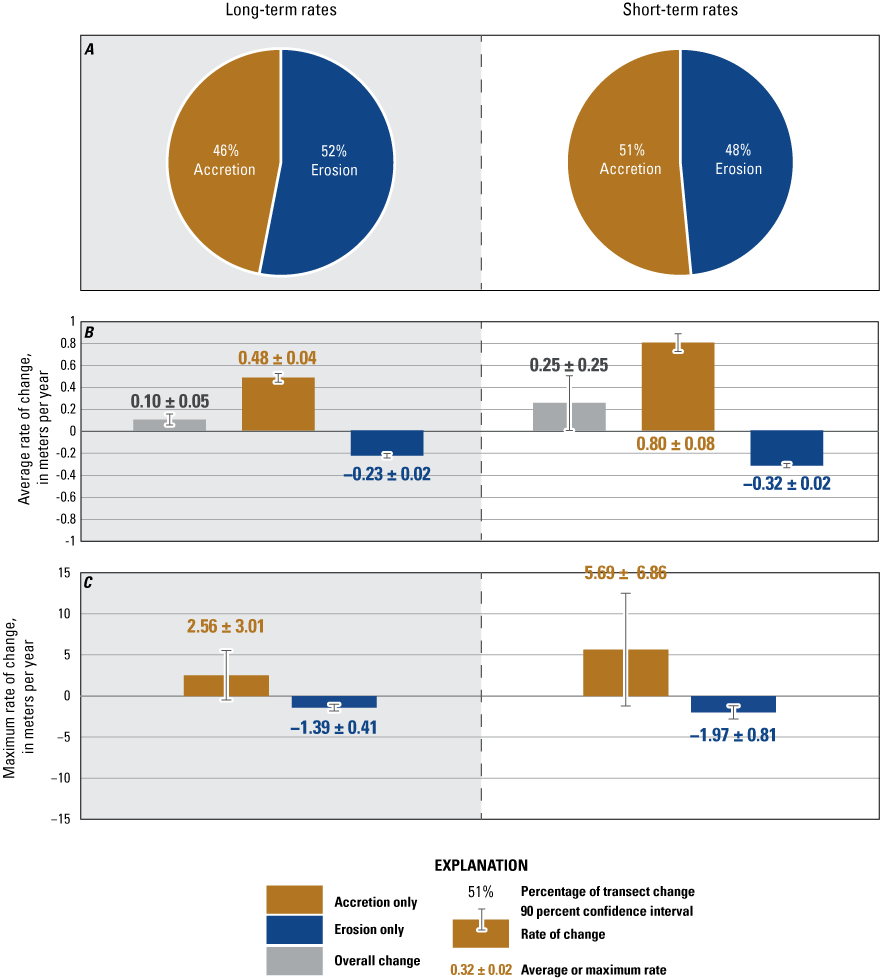
Summary of long-term (1930s–2018) and short-term (1970s–2018) shoreline change rates for the West region of Puerto Rico: A, pie charts showing the percentage of accretionary and erosional transects, B, bar graphs showing the average long- and short-term rate of change, as well as the average accretion and erosion rates, with corresponding 90 percent confidence intervals, and C, Maximum erosion and accretion.
Long-term (1930s–2018) and short-term (1970s–2018) shoreline change rates along the West region of Puerto Rico.
The average short-term rate of change for the West region is positive, at 0.25±0.25 m/yr. The average erosion rate was −0.32±0.02 m/yr, and the average rate of accretion was 0.8±0.08 m/yr. The largest erosion rate, −1.97±0.81 m/yr, was observed Balneario de Rincón, Rincón, and the maximum short-term accretion rate, 5.69±6.86 m/yr, was observed at Caño La Puente, Añasco.
The average long-term rate of change for the West region is positive, at 0.10±0.05 m/yr. The average erosion was −0.23±0.02 m/yr, and the average rate of accretion was 0.48±0.04 m/yr. The maximum accretion rate, 2.56±3.01 m/yr, was observed at Punta Gorda, Rincón. The maximum long-term erosion rate, −1.39±0.41 m/yr, was observed at Balneario de Rincón, Rincón.
Maximum erosion rates for the short and long term for the West region are found in the same location, Balneario de Rincón, Rincón. Previous shoreline change studies (Thieler and others, 2007) for the West region concluded that Rincón was on average experiencing consistent erosion from 1936 to 2006. When compared with the results of this analysis, reaches of the coast identified by Thieler and others (2007) were found to have consistent, if slightly larger rates of erosion than this study. For example, the reach identified from Balneario de Rincón to just south of the mouth of Quebrada Los Ramos was found to have an average erosion rate of −1.1±0.3 m/yr from 1936 to 2006 (Thieler and others, 2007). For the same location, shoreline change rates from 1936 to 2018 were found to be slightly less erosional at −0.91±0.21 m/yr. This shift to a less erosional period might be explained by the differences between proxy-based HWL shorelines and datum-based MHW shorelines. The greater percentage of MHW shorelines used in the more recent analysis may result in a seaward shift of the average shoreline position because of PDB. Another conclusion supported by this study is the suggestion that long-term and short-term rates of shoreline change are statistically similar. This is seen in the similar pattern of change observed in the plots on figure 17, which show the rates of change along the West region.
Northwest Region
Although the Northwest region is relatively small compared with the other regions, it was important to separate it from the West and North because of the significant differences in the insular platform, resulting in higher exposure to swell and high amplitude waves (Barreto-Orta, 1997).
The most commonly occurring shoreline type in the Northwest region (fig. 3B) is beach (48 percent), followed by rocky shorelines (31 percent; includes bluffs, beach rock, and aeolianites), human engineered structures and modifications (11 percent), and vegetated shoreline type (10 percent).
The percentage coverage of available shorelines over time for the Northwest region is shown in figure 18. There were up to six shorelines available for short-term analysis and as many as eight shorelines available for the long-term calculation from the 1930s to 2018.
Bar graph showing the relative percentage coverage of shorelines over time for the Northwest region of Puerto Rico from the 1930s to 2018 and the range of dates used to calculate long- and short-term rates of change.
For the Northwest region, shoreline change for both short-term and long-term analyses were measured for approximately 80 percent of the shoreline. The percentage of coastline suitable for shoreline analysis is influenced by the regional distribution of shoreline type and the number of available shoreline dates for the period. For the Northwest, areas not included in the analysis were primarily classified as rocky shoreline.
Average and maximum values of long-term and short-term shoreline change are compiled for the Northwest region in figure 19. The locations of maximum rates and other areas of interest are specified in figure 20, alongside plots of the short-term and long-term rates of change along the coast. The percentage of erosional transects decreased from 42 percent (long-term) to 30 percent (short-term), suggesting significant decreased erosion (or increased accretion) over time or the influence of the PDB offset.
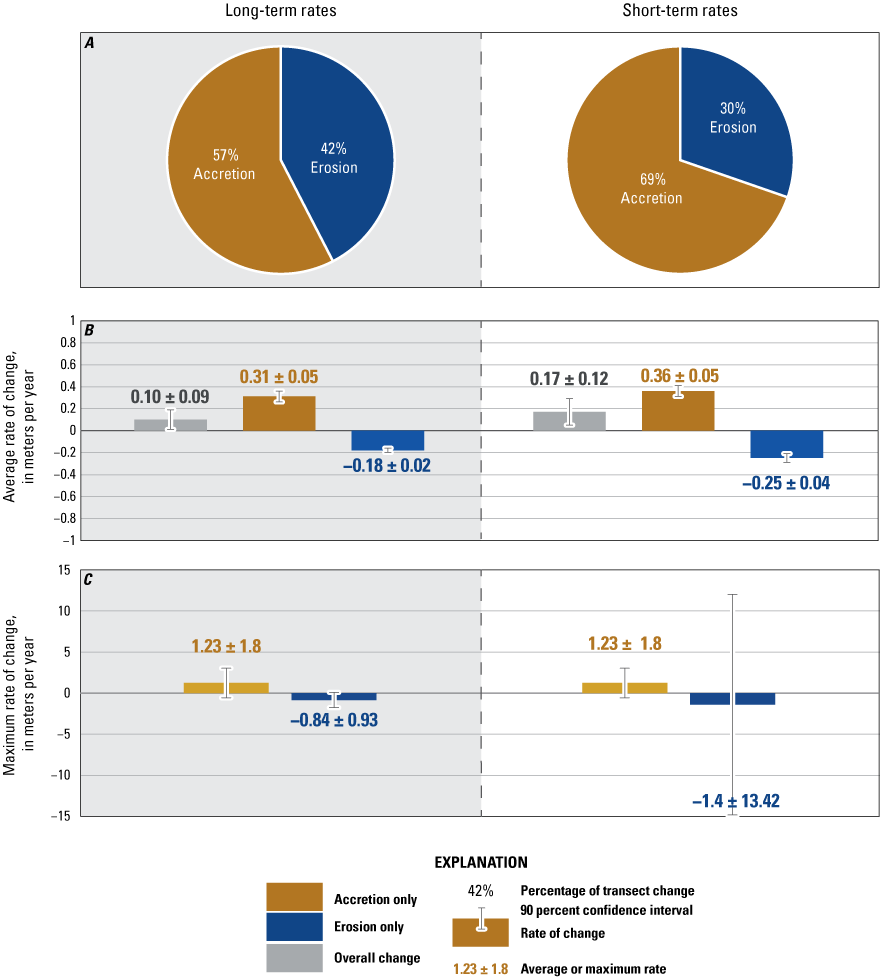
Summary of long-term (1930s–2018) and short-term (1970s–2018) shoreline change rates for the Northwest region of Puerto Rico: A, pie charts showing the percentage of accretionary and erosional transects, B, bar graphs showing the average long- and short-term rate of change, as well as the average accretion and erosion rates, with corresponding 90 percent confidence intervals, and C, Maximum erosion and accretion.
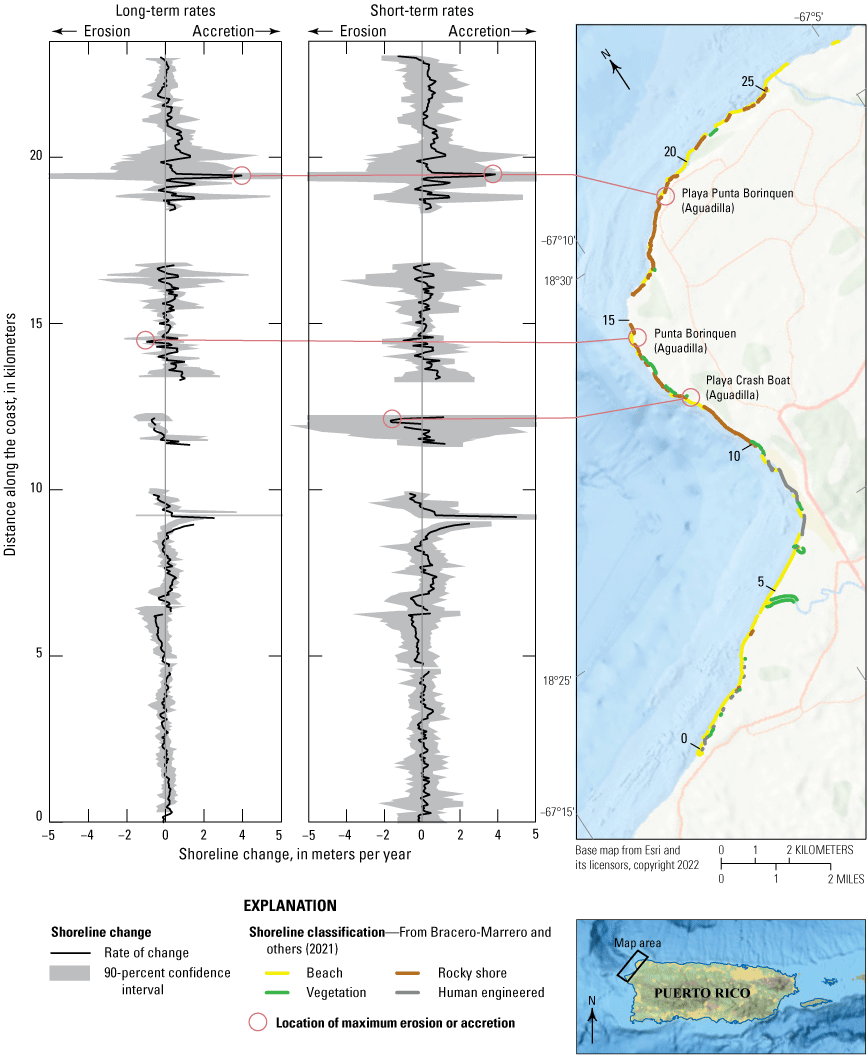
Long-term (1930s–2018) and short-term (1970s–2018) shoreline change rates along the Northwest region of Puerto Rico.
The average short-term rate of change for the Northwest region was positive, at 0.17±0.12 m/yr. The average erosion rate was −0.25±0.04 m/yr, and the average rate of accretion was 0.36±0.05 m/yr. The largest erosion rate, −1.4±13.42 m/yr, was observed Playa Crash Boat, Aguadilla, and the maximum short-term accretion rate, 1.23±1.8 m/yr, was observed at Playa Punta Borinquen, Aguadilla.
The average long-term rate of change for the Northwest region was positive, at 0.10±0.09 m/yr. The average rate of erosion was −0.18±0.02 m/yr, and the average rate of accretion was 0.31±0.05 m/yr. The maximum long-term erosion rate, −0.84±0.93 m/yr, was observed at Punta Borinquen, Aguadilla. The maximum accretion rate for both long term and short term, 1.23±1.8 m/yr, was observed at Playa Punta Borinquen, Aguadilla.
Vieques
The most commonly occurring shoreline type on the coast of Vieques (fig. 3B) is beach (41 percent), followed by vegetated (30 percent), rocky shorelines (29 percent includes bluffs, beach rock, and aeolianites), and human engineered structures and modifications (less than 1 percent).
The percentage coverage of available shorelines over time for the island of Vieques is shown in figure 21. For Vieques, there were a total of three shorelines available for the short-term analysis and only up to five available in the long-term analysis, with shoreline measurements ranging from the 1960s to 2018. Large areas of data gaps and locations with less than three shorelines resulted in fewer locations where short-term rates were possible and an increased likelihood that the long-term and short-term rates were calculated using a similar range and number of dates.
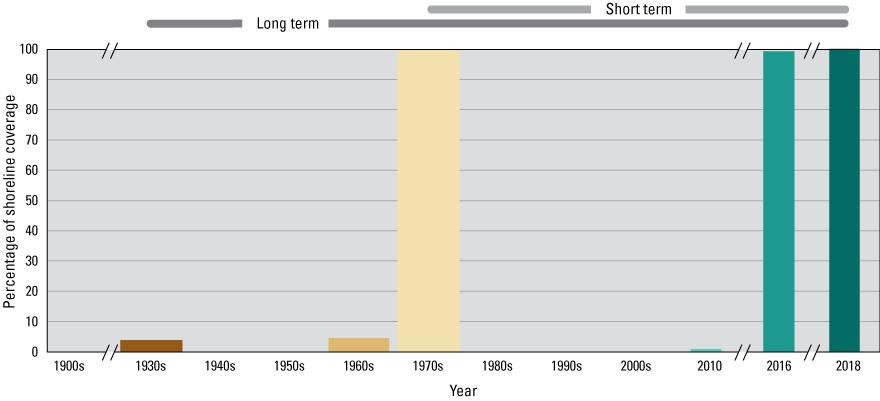
Bar graph showing the relative percentage coverage of shorelines over time for Vieques, Puerto Rico, from the 1930s to 2018 and the range of dates used to calculate long- and short-term rates of change.
For the coast of Vieques, long-term shoreline change was measured for 60 percent of the island shoreline, and short-term analysis was measured for approximately 45 percent of the shoreline. For Vieques, areas not included in analysis were primarily areas of rocky cliffs (north shore), mangrove shorelines (south coast), and a large area (western portion of the island) with fewer than three shorelines needed for short-term analysis.
Average and maximum values of long-term and short-term shoreline change are shown in figure 22. The distribution of erosion and accretion are similar for short- and long-term change. Locations of interest, as well as plots of long-term rates of change along the coast of Vieques are illustrated in figure 23. For this location, short-term rates are not plotted because they appear similar to the long-term rates and would be difficult to distinguish from the plot of long-term change. Unlike previous regions, this plot displays two graphs for long-term rates of change for each side of the island: north and south. The percentage of erosional transects decreased slightly from 49 percent (long term) to 44 percent (short term). This could be due to the PDB offset or to the decrease in sample size (number of transects) from the long-term (1,289) to short-term (968) shoreline analysis.
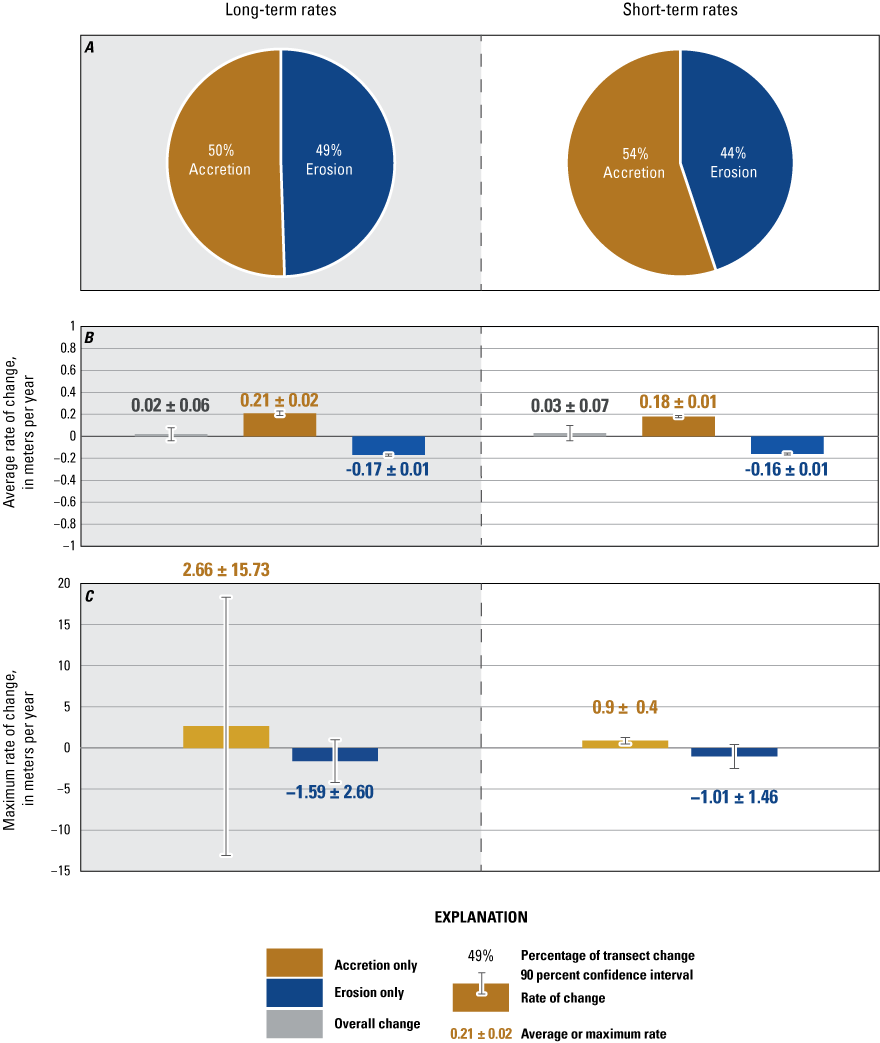
Summary of long-term (1930s–2018) and short-term (1970s–2018) shoreline change rates for Vieques: A, pie charts showing the percentage of accretionary and erosional transects, B, bar graphs showing the average long- and short-term rate of change, as well as the average accretion and erosion rates, with corresponding 90 percent confidence intervals and C, Maximum erosion and accretion.
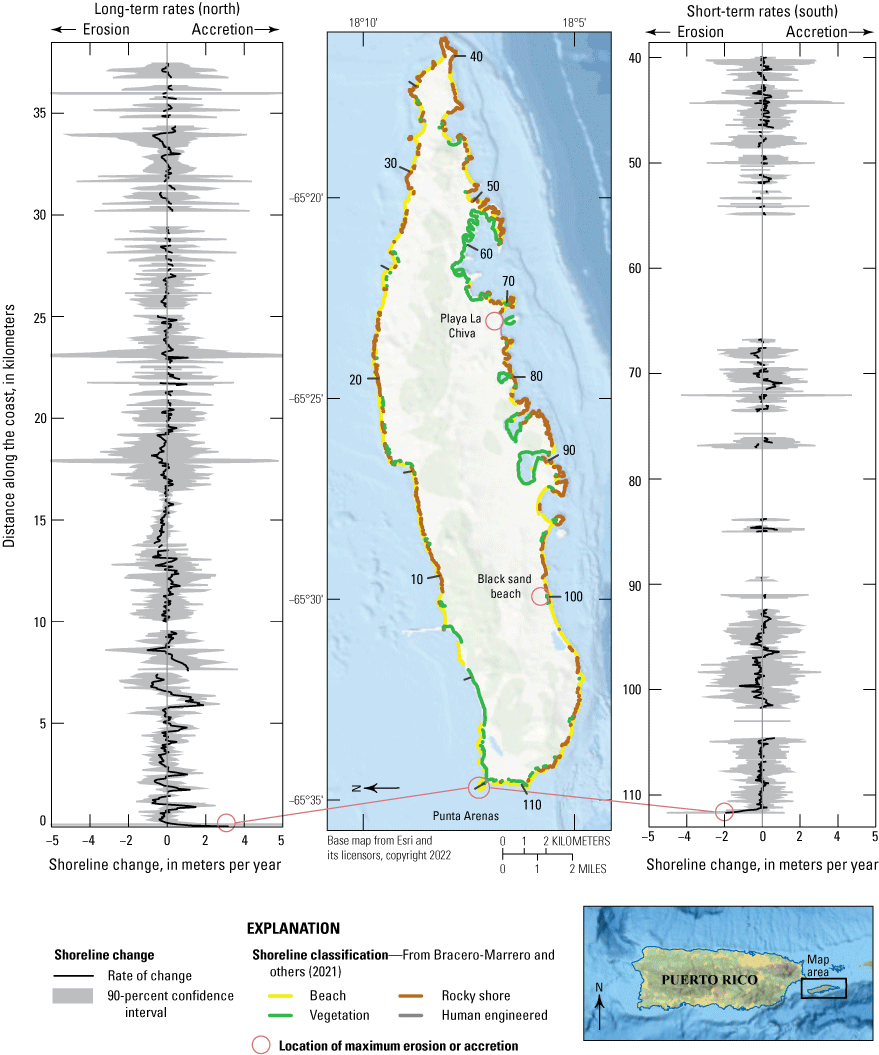
Long-term (1930s–2018) shoreline change rates along the coast of Vieques.
The average short-term rate of change for Vieques was positive, at 0.03±0.07 m/yr. The average erosion rate was −0.16±0.01 m/yr, and the average rate of accretion was 0.18±0.01 m/yr. The largest erosion rate, −1.01±1.46 m/yr was observed at Black sand beach, Vieques, and the maximum short-term accretion rate, 0.9±0.4 m/yr, was observed at Playa La Chiva, Vieques.
The average long-term rate of change for the Vieques was positive, at 0.02±0.06 m/yr. The average erosion rate was −0.17±0.01 m/yr, and the average accretion rate 0.21±0.02 m/yr. The maximum erosion rate, −1.59±2.60 m/yr, was observed at Punta Arenas south, Vieques. The maximum accretion rate, 2.66±15.73 m/yr, was observed on the northern side of Punta Arenas where the spit appeared to erode from the south and accrete on the northern side.
Culebra
The most commonly occurring shoreline type on the coast of Culebra (fig. 3B) is rocky shorelines (36 percent; includes bluffs, beach rock, and aeolianites), followed closely by vegetated (31 percent), beach (30 percent), and human engineered structures and modifications (2 percent).
The percentage coverage of available shorelines over time for the island of Culebra is shown in figure 24. There were only three shorelines available for short-term analysis and only up to four available for the long-term calculation from the 1960s to 2018. Large areas of data gaps and locations with less than three shorelines resulted in fewer locations where short-term rates were possible and an increased likelihood that the long-term and short-term rates were calculated using a similar range and number of dates.
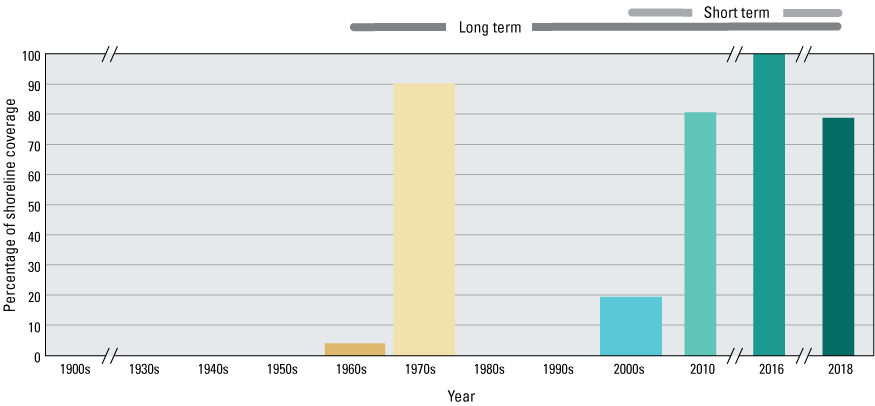
Bar graph showing the relative percentage coverage of shorelines over time for Culebra, Puerto Rico from the 1960s to 2018 and the range of dates used to calculate long- and short-term rates of change.
For Culebra, long-term shoreline change was measured for 60 percent of the island coastline. Short-term analysis was measured for approximately 50 percent of the island. The percentage of coastline suitable for shoreline analysis is influenced by the regional distribution of shoreline type and the number of available shoreline dates for the period. For Culebra, areas not included in analysis were primarily areas of rocky shorelines, developed and mangrove shorelines, and the small rocky islands surrounding Culebra.
Average and maximum values of long-term and short-term shoreline change are shown in figure 25. The location of maximum rates and other areas of interest are specified in figure 26, alongside plots of the short-term and long-term rates of change along the coast. For this plot, long-term and short-term rates of change are plotted together for each side of the island: north and south. The percentage of erosional transects decreased significantly over time from 37 percent (long term) to 9 percent (short term). This could be because of the PDB offset, the limited sample size, or the range of dates used for the short-term analysis. Culebra is the only location where the short-term rate used data from 2006 to 2018.
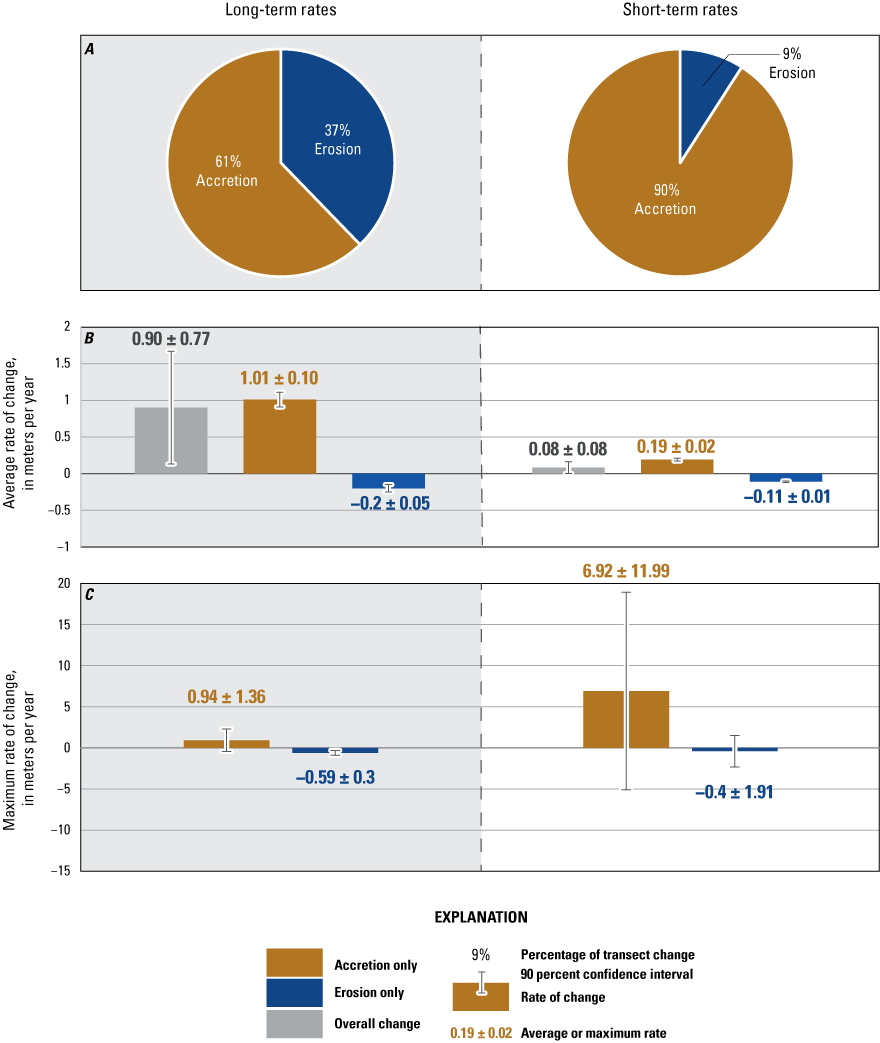
Summary of long-term (1960s–2018) and short-term (2000s–2018) shoreline change rates for Culebra: A, pie chart showing the percentage of accretionary and erosional transects, B, bar graphs showing the average long- and short-term rate of change, as well as the average accretion and erosion rates, with corresponding 90 percent confidence intervals and C, Maximum erosion and accretion.
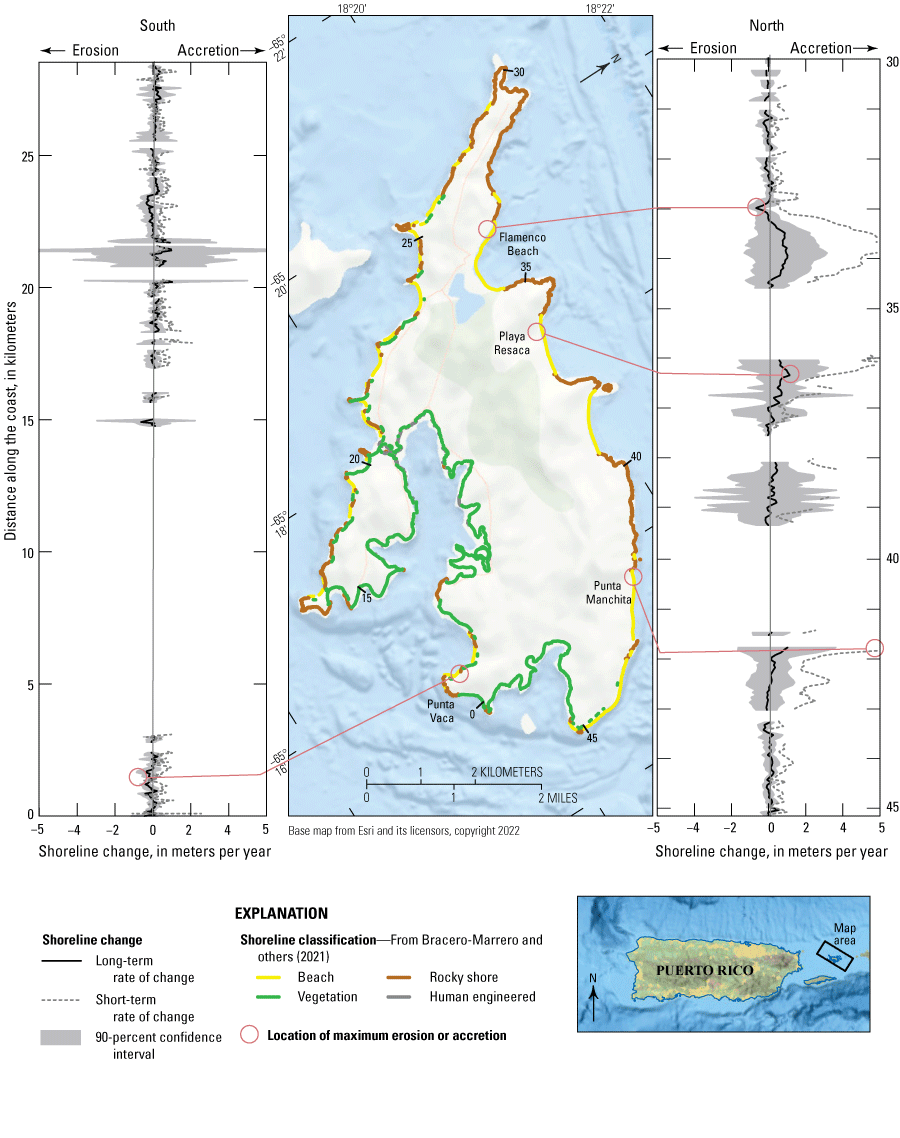
Long-term (1960s–2018) and short-term (2000s–2018) shoreline change rates along the coast of Culebra.
The average short-term rate of change for Culebra was positive, at 0.90±0.77 m/yr. The average erosion rate was −0.20±0.05 m/yr, and the average rate of accretion was 1.01±0.10 m/yr. The largest erosion rate, −0.40±1.91 m/yr, was observed at Punta Vaca, Culebra, and the maximum short-term accretion rate, 6.92±11.99 m/yr, was observed at Punta Manchita, Culebra.
The average long-term rate of change for Culebra was positive at 0.08±0.08 m/yr. The average rate of erosion was −0.11±0.01 m/yr, and the average accretion rate was 0.19±0.02 m/yr. The maximum erosion rate, −0.59±0.30 m/yr, was observed northwest of Flamenco Beach, Culebra. The maximum long-term accretion rate, 0.94±1.36 m/yr, was observed at Playa Resaca, Culebra.
Limitations of the Analysis
Considerations not reconciled in the analysis of this report include the proxy-datum bias (PDB), the generalized mean high-water (MHW) contour value, the nonstandard nature of the shoreline datasets and analysis, and base map reconciliation issues. Although these considerations were not included in this report, they might be beneficial for future analyses of coastal change.
Proxy-Datum Bias
Previous USGS national shoreline products have accounted for the observed unidirectional horizontal offset between the proxy-based HWL shorelines and datum-based MHW shorelines (Ruggiero and List, 2009). This is known as the PDB and, if needed, is generally applied as a correction during the shoreline rate calculation. The PDB calculation requires historical wave data (wave height and wavelength) and localized average slope data from available elevation surveys. At the time of this study, these data products were not available for Puerto Rico. In addition, scoping work done to determine the suitability of Puerto Rico for applying the PDB found that certain factors will complicate the MHW to HWL relationship, including offshore platforms, beach rock of varying elevation, bluffs and cliffs, variable coastline with small pocket beaches, and the location of MHW in the beach profile (generally low and near the waterline or in the water). These factors influence the horizontal distance between the MHW and HWL shorelines, making it difficult to apply a consistent bias value.
Although we were unable to calculate the PDB for Puerto Rico, in many locations, there appears to be a prominent visual offset that would most easily be explained as the PDB. The observed offset between the two different shoreline types is highlighted in figure 27. The 2016 and 2018 shorelines extracted from lidar are datum-based MHW shorelines and they appear seaward of the 1970 and 2010 proxy-based shorelines derived from aerial photograph interpretation of the HWL. We consider that this is due to an offset between the proxy-based and datum-based shoreline types and not a true pattern of erosion and accretion. The HWL is typically observed landward of the last high tide swash, and the MHW occurs on the beach face seaward of the high tide line. As the slope of the beach changes from gradual to steep (as seen in fig. 27 along the eastern and western sides of the Bahía Flamenco), the shorelines get closer together. In this example, the offset is most prominent in the middle of the lowest-sloping portion of Playa Flamenco.
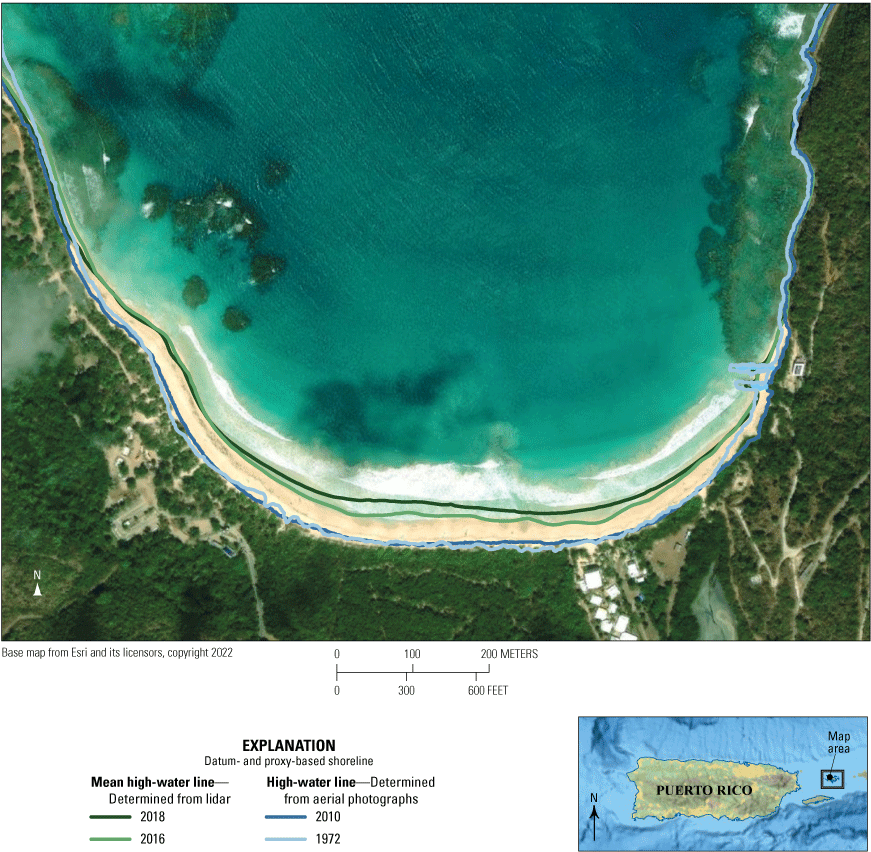
Example of offset between the mean high-water line (MHW; determined by light detection and ranging [lidar]) and high-water line (HWL; determined by aerial photographs) observed at Playa Flamenco on Culebra, Puerto Rico.
To account for the potential unidirectional offset (bias) in MHW and HWL shorelines that could not be corrected using a standard PDB, additional terms were included in the calculation of shoreline positional uncertainty. Any future updates to the Puerto Rico shoreline datasets would benefit from the creation and incorporation of the PDB feature to the shoreline rates calculation or extraction of all consistent, proxy-based shorelines that would not need to account for any horizontal offset between proxy-based shorelines.
Mean High-Water Contour Value
The MHW contour value was extracted using an averaged MHW value from 18 tide gages from Puerto Rico’s main island as well as Vieques and Culebra. Although this provides a good, generalized estimate of MHW for the islands, some of the precision in the MHW value is lost for specific areas. For instance, the North region has a higher-than-average MHW value, while the South region has a lower-than-average MHW value. Localized MHW values based on regions could be more appropriate for site-specific analyses and could be considered for future updates to Puerto Rico shoreline analyses. In addition, the location of the MHW was often towards the waterline or in the water, which makes it difficult to justify the comparison with the HWL shoreline, which was often much higher up on the beach. Consideration of a different datum-based elevation such as the Mean Higher High Water or an offset based on existing elevation could be explored.
Nonstandard Nature of Shoreline Analysis
Given some data limitations and cross-agency coordination of shoreline data from various timeframes, there were some challenges in synthesizing shoreline data for analysis. For example, historical shorelines from 1901 to 1987 from Thieler and Danforth (1993) were incorporated into a geospatial project for analysis with more recent shorelines. In some cases, not all source images (for example, aerial photographs) were available for quality control of the original historical shorelines. Because of this, some shorelines could only be referenced using current imagery and other verified shoreline positions.
Another challenge was aggregating datasets from different agencies. The data release that accompanies this report was created with the shorelines produced by the USGS and the University of Puerto Rico. The methods used to compile the data utilized subjective decisions made by each agency when extracting shoreline data (for example, aerial photograph interpretation of shoreline classification type, georeferencing of source imagery) and could yield slightly different positions of resulting shorelines. Because of this, all shoreline data were given a final quality control and peer review within the USGS to ensure the shorelines were as accurate as possible.
It is also important to note the coordinate system that the Puerto Rico shoreline data are projected in. Previous national shoreline assessments used the local Universal Transverse Mercator zone projection for analysis. In this analysis, the data are projected using the Puerto Rico State Plane Coordinate System. This is because Puerto Rico spans two Universal Transverse Mercator zones. Although the state plane coordinate system does distort distance the further from the projection’s standard parallels, the coordinate system covers a small area and the distortion is generally minimal.
Base Map Reconciliation
As noted in the “Nonstandard Nature of Shoreline Analysis” section of this report, the source imagery that served as the base maps for historical shoreline data extraction was georeferenced by different agencies at different times. Potential inaccuracies from the georeferenced source imagery, while accounted for in the uncertainty equation, could vary at different locations depending on its quality and spatial location. For instance, an average georeferencing error was estimated for the 1970s and 2010 shorelines, which in some cases can underestimate uncertainty of the shoreline position. The source imagery inaccuracies can also vary and different locations within the image. Locations in the source image where there are fewer and not as well-distributed control points could result in higher inaccuracy of the shoreline position.
Considerations for Future Assessments
An assessment of the horizontal offset between proxy-based and datum-based shorelines was not possible at the time of this analysis because of a lack of information or data used to calculate the PDB. The low-sloping sandy beaches of Puerto Rico are no exception. For this reason, developing the PDB would greatly benefit any future assessment.
Additional shoreline data would be useful for the short- and long-term analyses. If additional lidar shorelines can be added, the short-term rates of change could be expanded to include all locations regardless of the PDB because all locations would be the same shoreline proxy. For the long-term analysis, any additional historical source imagery and elevation data not covered in the current data releases would greatly improve the quality of the long-term rates.
Using shoreline classification data in Barreto and others (2021) as a baseline, a standardized classification field could be added to all shoreline change data, especially for all future hand-digitized shorelines. The ability to relate shoreline change to shoreline classification could allow for the exploration of other methods for a comprehensive analysis of shoreline change by different shoreline types.
Because the MHW value is averaged for all of Puerto Rico, it potentially overgeneralizes the MHW position in some areas, especially toward far northern and southern parts of the main island. Calculating localized MHW values and updating wave regime data may help capture more precise regional assessments of the island. Updated wave regime data could also provide update boundaries when deriving regional shoreline change statistics.
Summary
The U.S. Geological Survey (USGS) analyzes short- and long-term rates of shoreline change for Puerto Rico, including its islands Vieques and Culebra. In cooperation with the Coastal Research and Planning Institute of Puerto Rico (part of the Graduate School of Planning at the University of Puerto Rico), a database of historical shoreline positions was compiled using a variety of shoreline extraction methods. This update includes 29 shoreline dates from 1901 to 2018. These shorelines were compiled in ArcGIS and analyzed in the USGS Digital Shoreline Analysis System version 5.1 software to calculate rates of change. This effort represents an expansion of the USGS national-scale shoreline database to include Puerto Rico.
Selected References
Barreto, M., 2017, Assessment of beach morphology at Puerto Rico Island: University of Puerto Rico, 58 p., accessed November 29, 2023, at http://drna.pr.gov/wp-content/uploads/2017/05/Geomorphic-Assessment-of-Puerto-Rico-1977-to-2016.pdf.
Barreto, M., Méndez Tejeda, R., Cabrera, N., Bonano, V., Díaz, E., Pérez, K., and Castro, A., 2021, El estado de la erosión costera post-Huracán Maria en Puerto Rico: Revista Geográfica de Chile Terra Australis, v. 57, special issue 1, p. 29–40, accessed November 29, 2023, at https://doi.org/10.23854/07199562.2021571esp.Barreto29.
Barreto-Orta, M., 1997, Shoreline changes at Puerto Rico (1936–1993): Mayagüez, Puerto Rico, University of Puerto Rico, Ph.D. thesis, 278 p. [Also available at https://www.researchgate.net/publication/241392467_Shoreline_changes_in_Puerto_Rico_1936-1993.]
Barreto-Orta, M., Méndez-Tejeda, R., Rodríguez, E., Cabrera, N., Diaz, E., and Pérez, K., 2019, State of the beaches in Puerto Rico after Hurricane Maria (2017): Shore and Beach, v. 87, no. 1, p. 16–26. [Also available at https://www.researchgate.net/publication/332061474_The_state_of_the_beaches_at_Puerto_Rico_after_Maria.]
Bartlett, M.K., Henderson, R.E., Farris, A.S., and Himmelstoss, E.A., 2021, Massachusetts shoreline change project, 2021 update—A GIS compilation of shoreline change rates calculated using digital shoreline analysis system version 5.1, with supplementary intersects and baselines for Massachusetts: U.S. Geological Survey data release, accessed November 29, 2023, at https://doi.org/10.5066/P9YGIYFX.
Boak, E.H., and Turner, I.L., 2005, Shoreline definition and detection—A review: Journal of Coastal Research, v. 214, p. 688–703, accessed November 29, 2023, at https://doi.org/10.2112/03-0071.1.
Bracero-Marrero, L., Barreto-Orta, M., Hernández-Montcourt, N., Maldonado-González, R., Himmelstoss, E.A., and Heslin, J.L., 2021, A GIS compilation of vector shorelines and shoreline classification for Puerto Rico from 1970 and 2010: U.S. Geological Survey data release, accessed November 29, 2023, at https://doi.org/10.5066/P9SEUAHC.
Branoff, B.L., 2020, Mangrove disturbance and response following the 2017 hurricane season in Puerto Rico: Estuaries and Coasts, v. 43, no. 5, p. 1248–1262, accessed November 29, 2023, at https://doi.org/10.1007/s12237-019-00585-3.
Canals Silander, M., and García Moreno, C.G., 2019, On the spatial distribution of the wave energy resource in Puerto Rico and the United States Virgin Islands: Renewable Energy, v. 136, p. 442–451, accessed November 29, 2023, at https://doi.org/10.1016/j.renene.2018.12.120.
Farris, A.S., Weber, K.M., Doran, K.S., and List, J.H., 2018, Comparing methods used by the U.S. Geological Survey Coastal and Marine Geology Program for deriving shoreline position from lidar data: U.S. Geological Survey Open-File Report 2018–1121, 13 p., accessed November 29, 2023, at https://doi.org/10.3133/ofr20181121.
Fletcher, C.H., Romine, B.M., Genz, A.S., Barbee, M.M., Dyer, M., Anderson, T.R., Lim, S.C., Vitousek, S., Bochicchio, C., and Richmond, B.M., 2012, National assessment of shoreline change—Historical shoreline change in the Hawaiian islands: U.S. Geological Survey Open-File Report 2011–1051, 55 p., accessed November 29, 2023, at https://doi.org/10.3133/ofr20111051.
Garrett, C., and Toulany, B., 1981, Variability of the flow through the Strait of Belle Isle: Journal of Marine Research, v. 39, no. 1, p. 163–189. [Also available at https://elischolar.library.yale.edu/journal_of_marine_research/1538/.]
Gibbs, A.E., and Richmond, B.M., 2015, National assessment of shoreline change—Historical shoreline change along the North Coast of Alaska, U.S.–Canadian border to Icy Cape: U.S. Geological Survey Open-File Report 2015–1048, 96 p., accessed November 29, 2023, at https://doi.org/10.3133/ofr20151048.
Gibbs, A.E., and Richmond, B.M., 2017, National assessment of shoreline change—Summary statistics for updated vector shorelines and associated shoreline change data for the north coast of Alaska, U.S.–Canadian border to Icy Cape: U.S. Geological Survey Open-File Report 2017–1107, 21 p., accessed November 29, 2023, at https://doi.org/10.3133/ofr20171107.
Gibbs, A.E., Snyder, A.G., and Richmond, B.M., 2019, National assessment of shoreline change—Historical shoreline change along the north coast of Alaska, Icy Cape to Cape Prince of Wales: U.S. Geological Survey Open-File Report 2019–1146, 52 p., accessed November 29, 2023, at https://doi.org/10.3133/ofr20191146.
Hapke, C.J., and Reid, D., 2007, National assessment of shoreline change, part 4—Historical coastal cliff retreat along the California coast: U.S. Geological Survey Open-File Report 2007–1133, 51 p., accessed November 29, 2023, at https://doi.org/10.3133/ofr20071133.
Hapke, C.J., Himmelstoss, E.A., Kratzmann, M.G., List, J.H., and Thieler, E.R., 2011, National assessment of shoreline change—Historical shoreline change along the New England and mid-Atlantic coasts: U.S. Geological Survey Open-File Report 2010–1118, 57 p., accessed November 29, 2023, at https://doi.org/10.3133/ofr20101118.
Hapke, C.J., Reid, D., Richmond, B.M., Ruggiero, P., and List, J., 2006, National assessment of shoreline change, part 3—Historical shoreline change and associated coastal land loss along the sandy shorelines of the California coast: U.S. Geological Survey Open-File Report 2006–1219, 72 p., accessed November 29, 2023, at https://doi.org/10.3133/ofr20061219.
Henderson, R.E., Heslin, J.L., and Himmelstoss, E.A., 2021, Puerto Rico shoreline change—A GIS compilation of shorelines, baselines, intersects, and change rates calculated using the digital shoreline analysis system version 5.1: U.S. Geological Survey data release, accessed November 29, 2023, at https://doi.org/10.5066/P9FNRRN0.
Heslin, J.L., Henderson, R.E., and Himmelstoss, E.A., 2021a, A GIS compilation of vector shorelines for Puerto Rico from 2015 to 2018: U.S. Geological Survey data release, accessed November 29, 2023, at https://doi.org/10.5066/P9AZYW74.
Heslin, J.L., Henderson, R.E., and Himmelstoss, E.A., 2021b, Historical shorelines for Puerto Rico from 1901 to 1987: U.S. Geological Survey data release, accessed November 29, 2023, at https://doi.org/10.5066/P9CLXCEG.
Himmelstoss, E.A., Farris, A.S., Henderson, R.E., Kratzmann, M.G., Ergul, A., Zhang, O., Zichichi, J.L., and Thieler, E.R., 2018, Digital shoreline analysis system (version 5.1): U.S. Geological Survey software release, accessed November 29, 2023, at https://code.usgs.gov/cch/dsas.
Himmelstoss, E.A., Kratzmann, M.G., and Thieler, E.R., 2017, National assessment of shoreline change—A GIS compilation of updated vector shorelines and associated shoreline change data for the Gulf of Mexico coast: U.S. Geological Survey data release, accessed November 29, 2023, at https://doi.org/10.5066/F78P5XNK.
Kratzmann, M.G., 2022, U.S. Geological Survey national shoreline change—Summary statistics for updated vector shorelines (1800s–2010s) and associated shoreline change data for the Georgia and Florida coasts: U.S. Geological Survey Data Report 1156, 8 p., accessed November 29, 2023, at https://doi.org/10.3133/dr1156.
Kratzmann, M.G., Farris, A.S., Weber, K.M., Henderson, R.E., and Himmelstoss, E.A., 2021, USGS national assessment of shoreline change—A GIS compilation of updated vector shorelines (1800s–2010s) and associated shoreline change data for the Georgia and Florida coasts: U.S. Geological Survey data release, accessed November 29, 2023, at https://doi.org/10.5066/P9J3CVN4.
Kratzmann, M.G., Himmelstoss, E.A., and Thieler, E.R., 2017, National assessment of shoreline change—A GIS compilation of updated vector shorelines and associated shoreline change data for the southeast Atlantic coast: U.S. Geological Survey data release, accessed November 29, 2023, at https://doi.org/10.5066/F74X55X7.
Mendez-Tejeda, R., Pérez-Valentín, K.A., and Barreto-Orta, M., 2020, Impact of extreme weather events on the beaches of Puerto Rico—The case of Ocean Park, San Juan: American Journal of Marine Science, v. 8, no. 1, p. 1–5, accessed November 29, 2023, at http://pubs.sciepub.com/marine/8/1/1/index.html.
Morelock, J., 1978, Shoreline of Puerto Rico: Departamento de Recursos Naturales, prepared by the Puerto Rico Coastal Zone Management Program, San Juan, Puerto Rico, 45 p., accessed November 29, 2023, at http://edicionesdigitales.info/biblioteca/costapr.pdf. [Not available at original site at time of publication; also available at https://caribbeanclimatehub.org/wp-content/uploads/2019/08/ShorelineofPuertoRico_1978.pdf.]
Morelock, J., and Barreto, M., 2003, An update of coastal erosion in Puerto Rico: Shore and Beach, v. 71, no. 1, p. 7–12. [Also available at https://www.researchgate.net/publication/237551233_An_Update_of_Coastal_Erosion_in_Puerto_Rico.]
Morelock, J., Capella, J., Garcia, J.R., and Barreto, M., 2001, Puerto Rico—Seas at the millennium: University of Puerto Rico, article 15209027, 13 p., accessed November 29, 2023, at https://api.semanticscholar.org/CorpusID:15209027.
Morelock, J., Ramirez, W., and Barreto, M., 2010, Puerto Rico, chap. 5.4 of Bird, E.C.F., ed., Encyclopedia of the world’s coastal landforms: Dordrecht, Netherlands, Springer, p. 289–294, accessed November 29, 2023at https://doi.org/10.1007/978-1-4020-8639-7_48.]
Morton, R.A., and Miller, T.L., 2005, National assessment of shoreline change, part 2—Historical shoreline changes and associated coastal land loss along the U.S. southeast Atlantic coast: U.S. Geological Survey Open-File Report 2005–1401, 35 p., accessed November 29, 2023, at https://doi.org/10.3133/ofr20051401.
Morton, R.A., Miller, T.L., and Moore, L.J., 2004, National assessment of shoreline change, part 1—Historical shoreline changes and associated coastal land loss along the U.S. Gulf of Mexico: U.S. Geological Survey Open-File Report 2004–1043, 42 p., accessed November 29, 2023, at https://doi.org/10.3133/ofr20041043.
National Oceanic and Atmospheric Administration, 2020, VDatum, version 4.1.2: National Oceanic and Atmospheric Administration software release, accessed November 29, 2023, at https://vdatum.noaa.gov/welcome.html.
Pérez-Valentín, K., Barreto-Orta, M., Castro, A., Montañez-Acuña, A., and Cabrera-Valentín, N., 2021, Revealing geomorphic changes after the occurrence of a seismic event on the south coast of Puerto Rico (2020): Shore and Beach, v. 89, no. 1, p. 22–33, accessed November 29, 2023, at https://doi.org/10.34237/1008914.
Runkle, J., Kunkel, K.E., Stevens, L.E., Champion, S.M., Easterling, D.R., Terando, A., Sun, L., Stewart, B.C., Landers, G., and Rayne, S., 2022, Puerto Rico and the U.S. Virgin Islands—State climate summaries 2022: National Oceanic and Atmospheric Administration Technical Report NESDIS 150–PR, 5 p., accessed November 29, 2023, at https://statesummaries.ncics.org/chapter/pr/.
Ruggiero, P., Kratzmann, M.G., Himmelstoss, E.A., Reid, D., Allan, J., and Kaminsky, G., 2013, National assessment of shoreline change—Historical shoreline change along the Pacific Northwest coast: U.S. Geological Survey Open-File Report 2012–1007, 61 p., accessed November 29, 2023, at https://doi.org/10.3133/ofr20121007.
Ruggiero, P., and List, J.H., 2009, Improving accuracy and statistical reliability of shoreline position and change rate estimates: Journal of Coastal Research, v. 255, no. 5, p. 1069–1081, accessed November 29, 2023, at https://doi.org/10.2112/08-1051.1.
Storlazzi, C.D., Reguero, B.G., Viehman, T.S., Cumming, K.A., Cole, A.D., Shope, J.B., Groves, S.H., Gaido L., C., Nickel, B.A., and Beck, M.W., 2021, Rigorously valuing the impact of Hurricanes Irma and Maria on coastal hazard risks in Florida and Puerto Rico: U.S. Geological Survey Open-File Report 2021–1056, 29 p., accessed November 29, 2023, at https://doi.org/10.3133/ofr20211056.
Thieler, E.R., and Danforth, W.W., 1993, Historical shoreline changes in Puerto Rico, 1901–1987: U.S. Geological Survey Open-File Report 1993–574, 267 p., 37 sheets, accessed November 29, 2023, at https://doi.org/10.3133/ofr93574.
Thieler, E.R., Rodriguez, R.W., and Himmelstoss, E.A., 2007, Historical shoreline changes at Rincón, Puerto Rico, 1936–2006: U.S. Geological Survey Open-File Report 2007–1017, accessed November 29, 2023, at https://doi.org/10.3133/ofr20071017.
Viehman, T.S., Nemeth, M., Groves, S.H., Buckel, C.A., Griffin, S., Field, D., Moore, T.D., and Moore, J., 2020, Coral assessment and restoration in the U.S. Caribbean after 2017 hurricanes: National Oceanic and Atmospheric Administration Technical Memorandum NOS NCCOS 278, 64 p., accessed November 29, 2023, at https://doi.org/10.25923/7r0b-wc52. [National Centers for Environmental Information data archive, accession number 0221189, accessible at https://doi.org/10.25921/a1c4-bg06.]
Weber, K.M., List, J.H., and Morgan, K.L.M., 2005, An operational mean high water datum for determination of shoreline position from topographic lidar data: U.S. Geological Survey Open-File Report 2005–1027, [n.p.], accessed November 29, 2023, at https://doi.org/10.3133/ofr20051027.
Zimmerman, J.K., Willig, M.R., and Hernández-Delgado, E.A., 2020, Resistance, resilience, and vulnerability of social-ecological systems to hurricanes in Puerto Rico: Ecosphere, v. 11, no. 10, paper e03159, 27 p., accessed November 29, 2023, at https://doi.org/10.1002/ecs2.3159.
Appendix 1. Digital Shoreline Analysis System Summary Output for Puerto Rico, by Region
Table 1.1.
Summary statistics of the North region of Puerto Rico.[m/yr, meters per year; n, number of samples; CI, confidence interval; %, percent]
Table 1.2.
Summary statistics for the East region of Puerto Rico.[m/yr, meters per year; n, number of samples; CI, confidence interval; %, percent]
Table 1.3.
Summary statistics for the South region of Puerto Rico.[m/yr, meters per year; n, number of samples; CI, confidence interval; %, percent]
Table 1.4.
Summary statistics for the West region of Puerto Rico.[m/yr, meters per year; n, number of samples; CI, confidence interval; %, percent]
Table 1.5.
Summary statistics for the Northwest region of Puerto Rico.[m/yr, meters per year; n, number of samples; CI, confidence interval; %, percent
Table 1.6.
Summary statistics for the Vieques region of Puerto Rico.[m/yr, meters per year; n, number of samples; CI, confidence interval; %, percent
Table 1.7.
Summary statistics for the Culebra region of Puerto Rico.[m/yr, meters per year; n, number of samples; CI, confidence interval; %, percent]
Reference Cited
Himmelstoss, E.A., Henderson, R.E., Kratzmann, M.G., and Farris, A.S., 2021, Digital shoreline analysis system (DSAS) version 5.1 user guide: U.S. Geological Survey Open-File Report 2021–1091, 104 p., https://doi.org/10.3133/ofr20211091.
Datum
Vertical coordinate information is referenced to the Puerto Rico Vertical Datum of 2002 (PRVD02).
Horizontal coordinate information is referenced to the World Geodetic System (WGS 84).
Elevation, as used in this report, refers to distance above the vertical datum.
Spacing, as used in this report, refers to the distance (in meters) between DSAS transects along the baseline.
For additional information, contact
Director, Woods Hole Coastal and Marine Science Center
384 Woods Hole Road,
Woods Hole, MA 02543
Publishing support provided by the Pembroke and Baltimore Publishing Service Centers.
Disclaimers
Any use of trade, firm, or product names is for descriptive purposes only and does not imply endorsement by the U.S. Government.
Although this information product, for the most part, is in the public domain, it also may contain copyrighted materials as noted in the text. Permission to reproduce copyrighted items must be secured from the copyright owner.
Suggested Citation
Henderson, R.E., Heslin, J.L., Himmelstoss, E.A., and Barreto-Orta, M., 2024, National shoreline change—Summary statistics for vector shorelines from the early 1900s to the 2010s for Puerto Rico: U.S. Geological Survey Data Report 1191, 41 p., https://doi.org/10.3133/dr1191.
ISSN: 2771-9448 (online)
Study Area
| Publication type | Report |
|---|---|
| Publication Subtype | USGS Numbered Series |
| Title | National shoreline change—Summary statistics for vector shorelines from the early 1900s to the 2010s for Puerto Rico |
| Series title | Data Report |
| Series number | 1191 |
| DOI | 10.3133/dr1191 |
| Publication Date | April 12, 2024 |
| Year Published | 2024 |
| Language | English |
| Publisher | U.S. Geological Survey |
| Publisher location | Reston, VA |
| Contributing office(s) | Woods Hole Coastal and Marine Science Center |
| Description | Report: vii, 41 p.; Data Release |
| Country | United States |
| Other Geospatial | Puerto Rico |
| Online Only (Y/N) | Y |
| Additional Online Files (Y/N) | N |