

Calculation of a Suspended-Sediment Concentration-Turbidity Regression Model and Flood-Ebb Suspended-Sediment Concentration Differentials From Marshes Near Stone Harbor and Thompsons Beach, New Jersey, 2018–19 and 2022–23
Links
- Document: Report (3.17 MB pdf) , HTML , XML
- Data Releases:
- USGS data release - Time-series measurements of oceanographic and water quality data collected at Thompsons Beach and Stone Harbor, New Jersey, USA, September 2018 to September 2019 and March 2022 to May 2023
- USGS data release - Supplementary data in support of oceanographic and water quality times-series measurements made at Thompsons Beach and Stone Harbor, NJ from September 2018 to February 2023
- NGMDB Index Page: National Geologic Map Database Index Page (html)
- Download citation as: RIS | Dublin Core
Abstract
The U.S. Geological Survey collected water velocity and water quality data from salt marshes in Great Channel, southwest of Stone Harbor, New Jersey, and near Thompsons Beach, New Jersey, to evaluate restoration effectiveness after Hurricane Sandy and monitor postrestoration marsh health. Time series data of turbidity and water velocity were collected from 2018 to 2019 and 2022 to 2023 at both sites. Water samples were collected and analyzed for suspended-sediment concentration (SSC), which was used to derive a regression model to estimate a time series of SSC data from turbidity data. The SSC time series data were then combined with the water velocity data to calculate the flood-ebb SSC differential. This report presents the data collection methods, the repeated median regression model used to estimate SSC from turbidity, and the flood-ebb SSC differential calculations.
Introduction
Hurricane Sandy impacted salt marsh ecosystems along New Jersey’s 127 miles of coastline in 2012. Salt marshes are important habitats for fish and wildlife and provide protection from storm surge and flooding. Among the areas restored after Sandy were Seven Mile Beach, adjacent to Stone Harbor, N.J., which is a community built on a coastal barrier island bordering the Atlantic Ocean, and Thompsons Beach, N.J., which is along the shore of the Delaware Bay. Restoration efforts included the deposition of about 50,000 cubic yards of sand at Seven Mile Beach to enhance beach elevation and increase dune size, and the deposition of about 40,000 cubic yards of sand at Thompsons Beach to restore horseshoe crab and avian habitat, as well as to construct an intertidal oyster reef to stabilize shoreline erosion. Enlarging the beach area helps to protect the upland marsh from storm surge and wave erosion. Additionally, creeks in both marshes were dredged and about 7,000 cubic yards of sediment were dispersed onto half an acre of marsh near Stone Harbor and about 20,000 cubic yards of sediment were dispersed onto the marsh at Thompsons Beach to increase marsh elevation and resiliency to sea level rise and provide habitat for avian species.
Two salt marsh sites were selected for study, located near Stone Harbor in the mouth of Great Channel and near Thompsons Beach. These two areas are referred to as the Stone Harbor site and the Thompsons Beach site in this report. Studying the postrestoration conditions at the Stone Harbor and Thompsons Beach sites allows the evaluation of the effectiveness of restoration activities, which then can be used to inform future management decisions for coastal resiliency strategies. The U.S. Geological Survey, with funding from the National Fish and Wildlife Foundation through the Hurricane Sandy Coastal Resiliency Program, made in-place time series observations of turbidity and water velocity from 2018 to 2019 and 2022 to 2023. Additionally, water samples were collected periodically and analyzed for suspended-sediment concentration (SSC) while concurrent turbidity readings were taken with a handheld turbidity probe.
In this report, a repeated median regression model relating SSC to turbidity was developed and used to convert turbidity data measured in nephelometric turbidity units (NTU) to SSC data in milligrams per liter (mg/L) using the water sample data. This report also presents calculations for the flood-ebb SSC differential, which is an important marsh vulnerability metric indicating sediment transport direction. Flood and ebb tide periods were determined using the time series of water velocity data, and the differential was calculated from the mean flood and mean ebb SSC. Collected data are available in De Meo and others (2024) and Bales and others (2024). In future investigations, the time series of SSC data can be used to calculate ecological metrics such as marsh accretion and erosion and sediment flux, which may help natural resource managers and stakeholders make informed decisions related to coastline restoration and resiliency.
Sensor Deployment and Water Sample Collection
Multiparameter YSI EXO2 sensors (Xylem, Inc., Yellow Springs, Ohio) used to measure turbidity were deployed in a marsh channel at both the Stone Harbor and Thompsons Beach sites from September 18, 2018–September 25, 2019, and March 22, 2022–February 14, 2023 (fig. 1 and table 1). The turbidity sensor calibrations were checked before and after deployment with a two-point calibration at 0 NTU (deionized water) and 126 NTU (YSI 6073G turbidity standard). The sensors were mounted on platforms between 0.12 and 0.35 meter above the sediment bed and collected continuous turbidity measurements at 15-minute intervals for about 1 year for each of the two deployments. The sensors contain integrated wipers that wiped the optical lens before sampling to prevent biofouling. During the year, the sensors were recovered three times to replace the batteries and then redeployed.
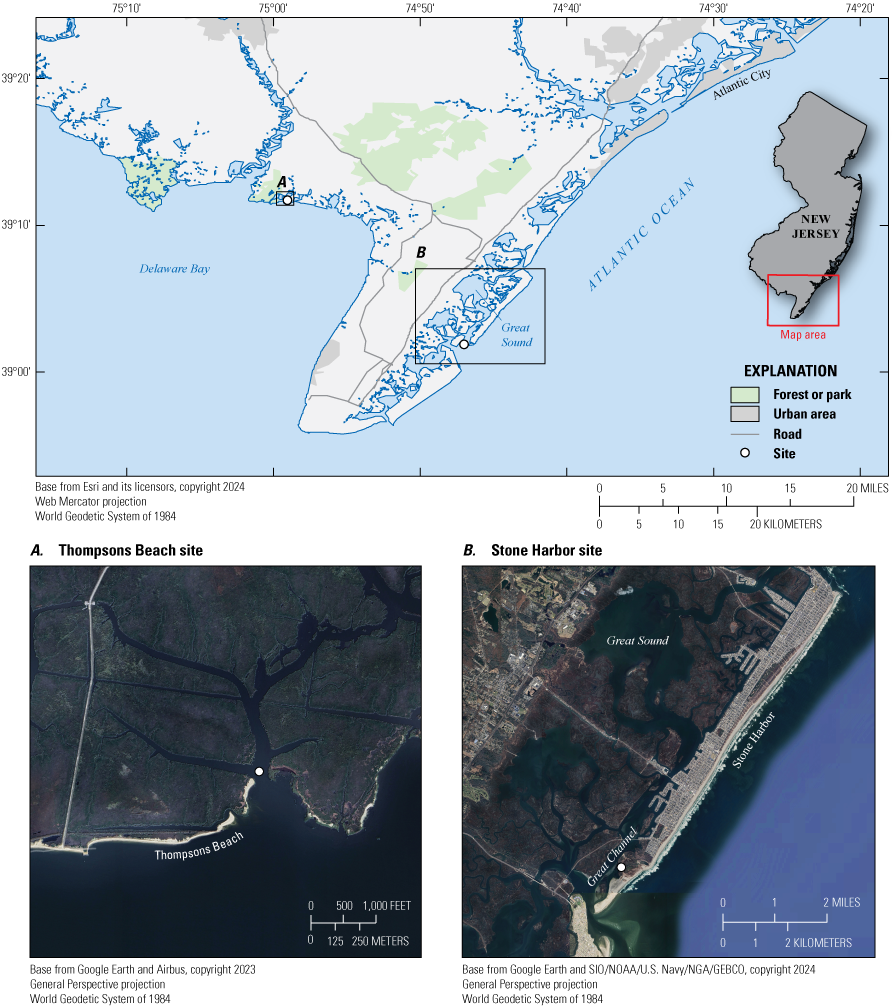
Map showing the locations of the turbidity and velocity sensor deployments at two sites in New Jersey. A, Thompsons Beach site; B, Stone Harbor site.
Additionally, a SonTek IQ acoustic Doppler current profiler (Xylem, Inc., Yellow Springs, Ohio) was first deployed at the Stone Harbor site on October 10, 2018, to measure water velocity. The current profiler was deployed on a platform roughly 0.05 meter above the seabed; however, it was consistently buried by sand so the sensor was reinstalled with a plastic riser to raise it an additional 0.10 meter above the seabed on April 25, 2019. During the year, the current profiler was visited periodically to download the data and to replace the battery on two occasions. The first current profiler deployment ended on September 25, 2019. The current profiler was deployed again from March 22, 2022–February 14, 2023, between 0.12–0.62 meter above the seabed on a platform attached to a fence post to prevent burial.
At the Thompsons Beach site, a Nortek Aquadopp acoustic Doppler current profiler (Nortek Group, Rud, Norway) was used to measure water velocity. A compass calibration was performed in the field prior to its deployment. The current profiler was deployed from September 19, 2018–September 24, 2019, and March 22, 2022–May 16, 2023, approximately 0.16 meter above the seabed. The sensor was recovered to replace the battery twice during each deployment.
Water samples to be analyzed for SSC were collected periodically at both sites by using a Van Dorn sampler, which is a 1-liter horizontal point sampler that collects a water sample at a specific depth (Buchanan and others, 1996). One water sample for SSC at the Stone Harbor site was collected by hand because the water level was too shallow for the Van Dorn sampler. Following the method in Shreve and Downs (2005), the water samples were refrigerated in the dark after collection and filtered within 120 days. Turbidity readings were taken concurrently with the water samples using a handheld YSI EXO2 sensor that was lowered over the side of the boat. Additional water samples were collected within a distance of about 3 miles from each site, on September 19, 2018, at the Thompsons Beach site, and on March 23, 2022, at the Stone Harbor site, to collect SSC samples of various concentrations for the regression model (see De Meo and others [2024] for the exact coordinates of each sample).
Laboratory Determination of Suspended-Sediment Concentration
Water samples were filtered and analyzed for SSC at the U.S. Geological Survey Woods Hole Coastal and Marine Science Center Sediment Analysis Laboratory in Woods Hole, Massachusetts. All steps followed the methods in Fishman and Friedman (1989). Glass-fiber filters with a 47-millimeter diameter and 1.5-micrometer pore size that had been pre-weighed and pre-treated in a muffle furnace at 550 degrees Celsius were used for filtering (Environmental Express ProWeigh filters). The full volume of each water sample was filtered to avoid subsampling errors. If the volume of solids from a sample was too large to be filtered by a single filter, two or more filters were used. The filter with retained residue was rinsed with deionized water to wash out dissolved salts, dried at 105 degrees Celsius, and weighed. SSC values were then calculated from the sediment masses. The SSC values were released in De Meo and others (2024).
Calculation of Suspended-Sediment Concentrations From Turbidity Values
Turbidity values were recorded simultaneously on the handheld EXO2 as SSC water samples were collected during each site visit. Later, the handheld EXO2 turbidity values were downloaded, and turbidity values during the water sampling periods were extracted. Ten seconds of turbidity readings from the time of the SSC water sample were averaged to make one turbidity value. If there were no turbidity data available from the handheld EXO2 for a collected water sample then turbidity data were taken from the deployed EXO2 at the site, provided the water sample was collected in close proximity to the deployed sensor. The deployed EXO2 sensors log one data point every 15 minutes, and the closest data point to the time of the SSC sample was used. Table 2 shows the paired SSC and turbidity values for each sample collected.
The turbidity data from the handheld EXO2 underwent a quality control process. Turbidity data were checked for excessively high values; if any value within the 10-second collection interval was over 100 percent higher than the median of the interval values then it was censored, and if 6 or more values in the interval were censored then the average turbidity was discarded. Turbidity values were checked for unacceptable standard deviation; if the standard deviation of a turbidity value divided by the 10-second interval mean turbidity value was greater than 0.5 then it was censored. If a turbidity value from the handheld EXO2 probe was not available and there was a deployed EXO2 in close proximity to the water sample location, a value from the deployed EXO2 turbidity data was used (table 2, flag 2). Occasionally, deployed turbidity values were not available because of sampling errors (table 2, flag 3). The deployed EXO2 turbidity values also underwent quality control; if the standard deviation of a turbidity value divided by the mean of the closest three turbidity values was greater than 0.5 then it was censored (table 2, flag 4).
Table 2.
Suspended-sediment concentrations from water samples and site turbidity values collected September 2018–September 2019 and March 2022–December 2022, Stone Harbor and Thompsons Beach sites, New Jersey.[Data from Bales and others (2024) and De Meo and others (2024). Time is given in Coordinated Universal Time (UTC) in the following format: hour:minute:second. Turbidity values were primarily collected from a handheld YSI EXO2 probe, and secondarily collected from a deployed EXO2 probe at each site. Flag values are defined as follows: 1, good turbidity data from the handheld EXO2 probe; 2, deployed EXO2 turbidity sensor values are used; 3, no deployed EXO2 sensor values are available; and 4, deployed EXO2 sensor values are excluded from the dataset because the standard deviation of the turbidity value divided by the mean turbidity value is greater than 0.5. m, meter; SSC, suspended-sediment concentration from water samples; mg/L, milligrams per liter; NTU, nephelometric turbidity unit; NA, not applicable]
Suspended-sediment concentrations were estimated from turbidity by a linear regression using a robust, nonparametric repeated median method (Siegel, 1982). The repeated median method was selected because it is less sensitive to the effects of outliers than traditional linear regression methods. The repeated median method calculates the slope of the measured SSC in comparison to sensor turbidity by determining the medians of all possible point-to-point slopes and then taking the median of those median slopes. The intercept was calculated as the median of all possible intercepts using the final slope calculation.
The nonparametric prediction interval, calculated as in Helsel and others (2020), is an error range containing one standard deviation (68 percent) of the measured SSC to sensor turbidity dataset. The nonparametric prediction interval is not symmetric because it results from the distribution of the dataset. The interval is calculated based on the residuals for each point, sorted from least to greatest. The 95-percent confidence interval of the slope was calculated as in Helsel and others (2020) by sorting all point-to-point slopes in ascending order. The ranks of the upper and lower intervals were then calculated and rounded to the nearest integer, and the slope associated with each rank was identified. See Buchanan and Lionberger (2007) for more detailed information about the nonparametric prediction interval and confidence interval calculations that were used in this study.
Figure 2 displays the repeated median regression, the nonparametric prediction interval, and the confidence interval. The following is the model equation generated from the repeated median regression:
whereSSC
is suspended-sediment concentration in mg/L, and
NTU
is sensor turbidity in nephelometric turbidity units.
The model equation (eq. 1) was generated with 132 data points. The nonparametric prediction interval ranged from −10 to 20, and the 95-percent confidence bounds on the slope calculation were from 1.487 to 1.717. This equation is used in the next section to derive a time series of SSC from the time series of deployed turbidity sensor data (Bales and others 2024) to calculate metrics of sediment transport.
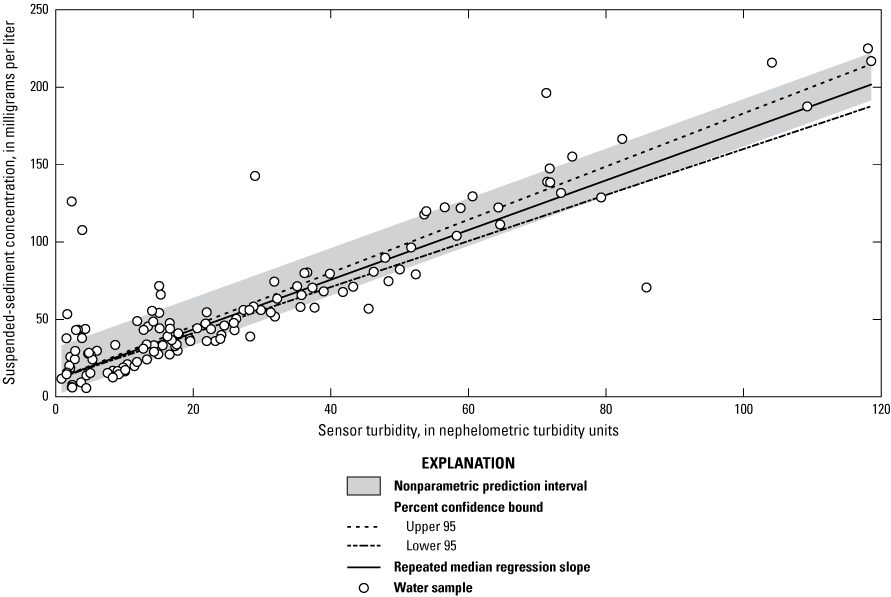
Graph showing the laboratory-determined suspended-sediment concentration and sensor turbidity of water samples, nonparametric prediction interval with upper and lower 95 percent confidence bounds, and the repeated median regression slope.
Flood-Ebb Suspended-Sediment Concentration Differential
The flood-ebb SSC differential (∆C) can be used as a marsh vulnerability metric, representing sediment-flux trajectories and marsh stability (Ganju and others, 2015; Nowacki and Ganju, 2019). A positive flood-ebb SSC differential indicates sediment import whereas a negative differential indicates sediment export. In order to calculate the flood-ebb SSC differentials, the time series of collected turbidity (NTU) values (Bales and others, 2024) for each site were converted to SSC using equation 1 that was generated from the repeated median regression illustrated in figure 2. The SSC values were then paired by time with corresponding water velocity data (Bales and others, 2024) that was measured by a SonTek IQ at the Stone Harbor site and a Nortek Aquadopp at the Thompsons Beach site.
The IQ current profiler, designed for channelized flow such as bidirectional channels or pipes, outputs velocity data in X and Z coordinates. At the Stone Harbor site, the IQ was originally positioned so that the X axis was along the marsh channel, with positive X velocities representing ebb tide. To be consistent with published flood-ebb conventions when calculating a marsh sediment budget, the water velocities from the IQ were reversed so that flood tide velocities were positive and ebb tide velocities were negative. The Aquadopp current profiler deployed at the Thompsons Beach site outputs east and north velocities. The velocities were averaged across all vertical bins and rotated into the principal flow axis of the marsh channel, with the positive direction being into the marsh.
The along-channel, depth-averaged velocities from the IQ and Aquadopp were used to determine times of flood tide (velocities >0 meter per second) and ebb tide (velocities <0 meter per second) at each site. The periods of flood and ebb velocities were then used to separate SSC values into flood SSC and ebb SSC shown in figure 3. The flood and ebb SSC temporal coverage was limited by the availability of concurrent velocity and turbidity data. While the IQ and Aquadopp were deployed simultaneously with the turbidity sensors, there are periods of missing velocity and turbidity data because of occasional technical difficulties or environmental interference, such as the deposition of plant material or sand on the optical lenses and acoustic transducers. These periods of missing data resulted in an incomplete time series of flood and ebb velocity and turbidity, and therefore SSC, at both sites.
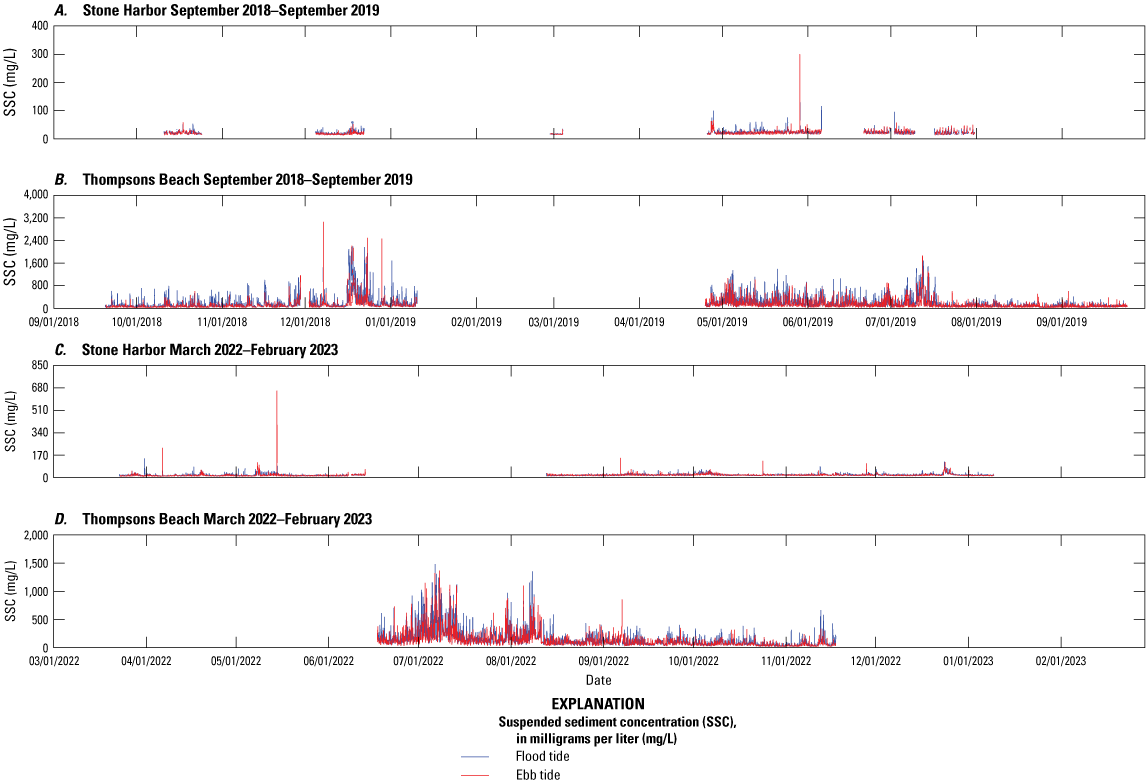
Graph showing flood and ebb tide suspended-sediment concentration (SSC), in milligrams per liter (mg/L), at sites near Stone Harbor and Thompsons Beach, New Jersey, during September 2018–September 2019 and March 2022–February 2023. The time series data are incomplete because of sensor burial by sand, obstruction from plant material, or removal during quality control procedures.
The means of the available flood SSC and ebb SSC were determined for the Stone Harbor and Thompsons Beach sites over the time periods of September 2018 to September 2019 and March 2022 to February 2023. The flood-ebb SSC differential over each time period at each site was then calculated as the following:
where∆C
is the flood-ebb suspended-sediment concentration differential in mg/L,
⟨Flood SSC⟩
is the mean flood suspended-sediment concentration in mg/L, and
⟨Ebb SSC⟩
is the mean ebb suspended-sediment concentration in mg/L.
Summary
The U.S. Geological Survey collected time series of turbidity and velocity data at two marshes that were restored after Hurricane Sandy: in Great Channel near Stone Harbor, New Jersey, and in Delaware Bay near Thompsons Beach, N.J. The data range from September 2018 to September 2019 and March 2022 to February 2023, although the time series are incomplete because the sensors were sometimes buried with sand or obscured by plant material. Periodically throughout the study periods at both sites, turbidity readings and water samples for suspended-sediment concentration (SSC) were collected. These data were used to derive a repeated median regression model to convert turbidity time series data to SSC time series data. The velocity data were used to determine flood and ebb periods at each site, and the mean flood and ebb SSC values were used to calculate the flood-ebb SSC differentials for both study periods at the Stone Harbor and Thompsons Beach sites. In future investigations, the time series of SSC data can be used to calculate ecological metrics such as marsh accretion and erosion and sediment flux to assess marsh stability near Stone Harbor and Thompsons Beach. These metrics may help natural resource managers and stakeholders make informed decisions related to coastline restoration and resiliency.
Acknowledgments
Special thanks are given to the following U.S. Geological Survey personnel: Jonathan Borden, Marinna Martini, Alex Olson, Eric Moore, Alex Nichols, and Michael Casso for their participation in field work, and Brian Buczkowski for determining suspended-sediment concentrations.
References Cited
Bales, R.D., Suttles, S.E., De Meo, O.A., Ganju, N.K., and Marsjanik, E.D., 2024, Time-series measurements of oceanographic and water quality data collected at Thompsons Beach and Stone Harbor, New Jersey, USA, September 2018 to September 2019 and March 2022 to May 2023: U.S. Geological Survey data release, https://doi.org/10.5066/P9Z0Z8DM.
Buchanan, P.A., and Lionberger, M.A., 2007, Summary of suspended-sediment concentration data, San Francisco Bay, California, water year 2005: U.S. Geological Survey Data Series 282, 46 p., accessed November 2023, at https://doi.org/10.3133/ds282.
Buchanan, P.A., Schoellhamer, D.H., and Sheipline, R.C., 1996, Summary of suspended-solids concentration data, San Francisco Bay, California, water year 1994: U.S. Geological Survey Open-File Report 95–776, 48 p., accessed November 2023, at https://doi.org/10.3133/ofr95776.
De Meo, O.A., Bales, R.D., Suttles, S.E., Marsjanik, E.D., and Ganju, N.K., 2024, Supplementary data in support of oceanographic and water quality times-series measurements made at Thompsons Beach and Stone Harbor, NJ from September 2018 to February 2023: U.S. Geological Survey data release, https://doi.org/10.5066/P9CS5U6N.
Fishman, M.J., and Friedman, L.C., 1989, Methods for determination of inorganic substances in water and fluvial sediments: U.S. Geological Survey Techniques of Water-Resources Investigations, book 5, chap A1, 545 p., accessed March 2024, at https://doi.org/10.3133/twri05A1. [Supersedes U.S. Geological Survey Open-File Report 85–495.]
Ganju, N.K., Kirwan, M.L., Dickhudt, P.J., Guntenspergen, G.R., Cahoon, D.R., and Kroeger, K.D., 2015, Sediment transport-based metrics of wetland stability: Geophysical Research Letters, v. 42, no. 19, p. 7992–8000, accessed January 2024, at https://doi.org/10.1002/2015GL065980.
Helsel, D.R., Hirsch, R.M., Ryberg, K.R., Archfield, S.A., and Gilroy, E.J., 2020, Statistical methods in water resources: U.S. Geological Survey Techniques and Methods book 4, chap A3, 458 p., accessed April 2023, at https://doi.org/10.3133/tm4A3. [Supersedes U.S. Geological Survey Techniques of Water-Resources Investigations book 4, chap A3, version 1.1.]
Nowacki, D.J., and Ganju, N.K., 2019, Simple metrics predict salt-marsh sediment fluxes: Geophysical Research Letters, v. 46, no. 21, p. 12,250–12,257, accessed January 2024, at https://doi.org/10.1029/2019GL083819.
Siegel, A.F., 1982, Robust regression using repeated medians: Biometrika, v. 69, no. 1, p. 242–244, accessed April 2023, at https://doi.org/10.1093/biomet/69.1.242.
Shreve, E.A., and Downs, A.C., 2005, Quality-assurance plan for the analysis of fluvial sediment by the U.S. Geological Survey Kentucky Water Science Center sediment laboratory: U.S. Geological Survey Open-File Report 2005–1230, 28 p., accessed April 2023, at https://doi.org/10.3133/ofr20051230.
Conversion Factors
Datums
Horizontal coordinate information is referenced to the North American Datum of 1983 (NAD 83) or World Geodetic System of 1984 (WGS 84).
Depth is referenced to the sea surface at time of sampling.
Supplemental Information
Concentration of suspended sediment is given in milligrams per liter (mg/L).
Flood-ebb suspended-sediment concentration differential is given in milligrams per liter (mg/L).
For more information, contact:
Director, Woods Hole Coastal and Marine Science Center
U.S. Geological Survey
384 Woods Hole Road
Quissett Campus
Woods Hole, MA 02543–1598
508–548–8700 or 508–457–2200
WHSC_science_director@usgs.gov
or visit our website at
https://www.usgs.gov/centers/whcmsc
Publishing support provided by the Pembroke Publishing Service Center
Disclaimers
Any use of trade, firm, or product names is for descriptive purposes only and does not imply endorsement by the U.S. Government.
Although this information product, for the most part, is in the public domain, it also may contain copyrighted materials as noted in the text. Permission to reproduce copyrighted items must be secured from the copyright owner.
Suggested Citation
De Meo, O.A., Bales, R.D., Ganju, N.K., Marsjanik, E.D., and Suttles, S.E., 2024, Calculation of a suspended-sediment concentration-turbidity regression model and flood-ebb suspended-sediment concentration differentials from marshes near Stone Harbor and Thompsons Beach, New Jersey, 2018–19 and 2022–23: U.S. Geological Survey Data Report 1193, 12 p., https://doi.org/10.3133/dr1193.
ISSN: 2771-9448 (online)
Study Area
| Publication type | Report |
|---|---|
| Publication Subtype | USGS Numbered Series |
| Title | Calculation of a suspended-sediment concentration-turbidity regression model and flood-ebb suspended-sediment concentration differentials from marshes near Stone Harbor and Thompsons Beach, New Jersey, 2018–19 and 2022–23 |
| Series title | Data Report |
| Series number | 1193 |
| DOI | 10.3133/dr1193 |
| Publication Date | April 22, 2024 |
| Year Published | 2024 |
| Language | English |
| Publisher | U.S. Geological Survey |
| Publisher location | Reston, VA |
| Contributing office(s) | Woods Hole Coastal and Marine Science Center |
| Description | Report: iv, 12 p.; 2 Data Releases |
| Country | United States |
| State | New Jersey |
| Online Only (Y/N) | Y |
| Additional Online Files (Y/N) | N |