

Pesticide Concentrations of Surface Water and Suspended Sediment in Yolo By-Pass and Cache Slough Complex, California, 2019–2021
Links
- Document: Report (5 MB pdf) , HTML , XML
- NGMDB Index Page: National Geologic Map Database Index Page (html)
- Download citation as: RIS | Dublin Core
Abstract
Managed flow pulses in the north Sacramento-San Joaquin Delta are an adaptive management tool used in efforts to enhance food availability in delta smelt (Hypomesus transpacificus) habitat as part of the North Delta Food Subsidies Action. The California Department of Water Resources (DWR) monitors non-managed seasonal and local flow pulses and managed flow pulses from agricultural drainage or main stem Sacramento River water redirected through Yolo By-Pass. Augmented flow pulses are hypothesized to improve net positive flow during summer and fall in Yolo By-Pass and enhance plankton availability in delta smelt habitat in Cache Slough complex. However, flow pulses may also result in unintended negative effects of increased pesticides that are transported through Yolo By-Pass. Here, we evaluate pesticides in surface water and suspended sediment correlated with flow pulses in Yolo By-Pass during the 2019–21 calendar years.
Surface-water and suspended-sediment samples were collected by DWR personnel. Water samples were analyzed at the U.S. Geological Survey Organic Chemistry Research Laboratory in Sacramento, California, for a suite of as many as 178 current-use pesticides and pesticide degradates using gas chromatography with mass spectrometry (GC/MS), gas chromatography with tandem mass spectrometry, and liquid chromatography with tandem mass spectrometry. Suspended sediments filtered from water samples were analyzed for a suite of as many as 173 current-use pesticides and pesticide degradates.
There were 52 different current-use pesticides and pesticide degradates detected in water samples collected throughout the study. Concentrations ranged from below method detection limits to 4,070 nanograms per liter. Five different compounds in water samples were detected with concentrations above U.S. Environmental Protection Agency aquatic life benchmarks. In suspended-sediment samples collected throughout the study, eight different current-use pesticides and pesticide degradates were detected.
Total pesticide concentrations were highest at surface-water sites in the northern end of Yolo By-Pass and decreased farther downstream during the same sampling events. Total pesticide concentrations generally were higher for most surface-water sites immediately before or during the managed flow pulse in 2019 versus after the flow pulse. Finally, mean total pesticide concentrations for each surface-water site generally were higher during all of 2019 than 2021, regardless of sampling period.
Introduction
The Sacramento-San Joaquin Delta (hereafter referred to as “the Delta”) is a critical habitat for local wildlife and key fish species. Sacramento River winter-run Chinook salmon (Oncorhynchus tshawytscha) are listed as endangered Federally (U.S. Fish and Wildlife Service, 2023) and by the State of California (California Natural Diversity Database, 2024). Central Valley spring-run Chinook salmon (Oncorhynchus tshawytscha) are listed as threatened Federally (U.S. Fish and Wildlife Service, 2023) and by the State of California (California Natural Diversity Database, 2024). Delta smelt (Hypomesus transpacificus) are listed as threatened Federally (U.S. Fish and Wildlife Service, 2023) and as endangered by the State of California (California Natural Diversity Database, 2024). Chinook salmon and delta smelt are native fish species that are important to the Delta food web, which has been dramatically affected by anthropogenic alterations, such as water diversions, channel modifications, and land-use changes (U.S. Fish and Wildlife Service, 2023; Brown and others, 20241). These alterations have resulted in habitat losses, sediment load changes, nutrient loading, and contaminant presence in the Delta (Brown and others, 2024). In addition, phytoplankton declines have contributed to the Federal and State listings of delta smelt (Sommer and others, 2001).
Cache Slough complex and Yolo By-Pass (fig. 1), which includes the agricultural lands that are seasonally wetted, are regions of particular interest for the conservation of listed species because they are richer in phytoplankton than most other parts of the Delta (Frantzich and others 2018, 2021). Cache Slough complex is in the northwest section of the Delta and consists of Cache Slough, Lindsey Slough (fig. 1), Liberty Island (not shown), Sacramento River Deep Water Ship Channel (fig. 1), and lower Yolo By-Pass (Orlando and others, 2020). Cache Slough complex provides key habitats for the production of phytoplankton, zooplankton, and juvenile fish (Sommer and others, 2001; Nobriga and others, 2005). Yolo By-Pass and Cache Slough complex are important sources of phytoplankton biomass for the food web farther downstream in the Delta.
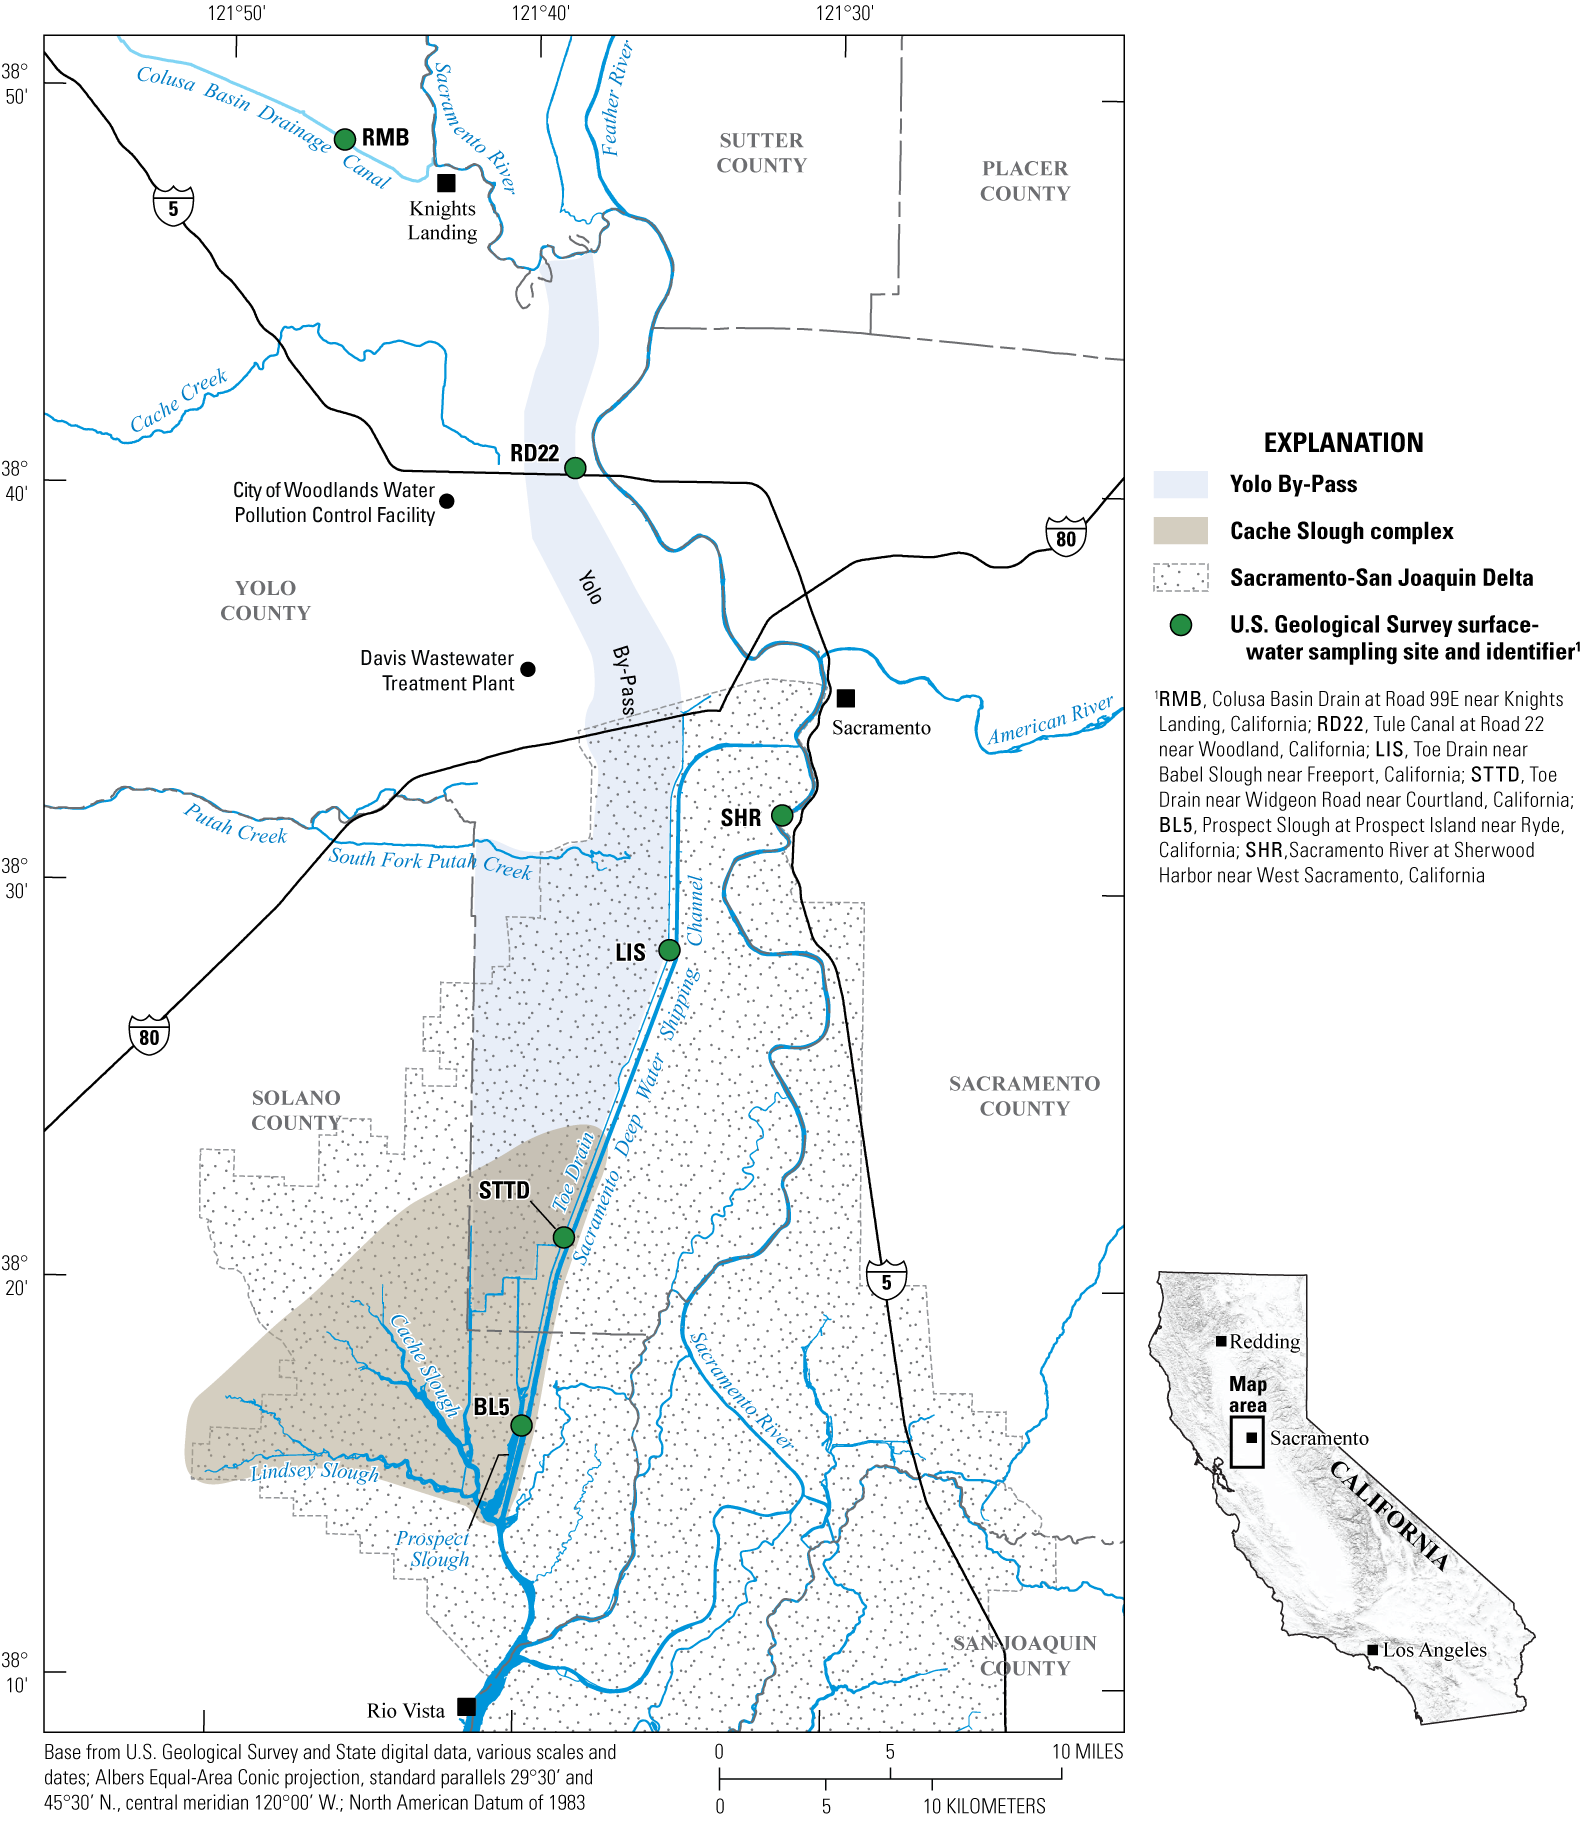
Locations of surface-water sampling sites throughout Yolo By-Pass and Cache Slough complex, Sacramento-San Joaquin Delta, California. Surface-water site information can be accessed from the U.S. Geological Survey (USGS) National Water Information System (U.S. Geological Survey, 2023) using USGS site information provided in table 1.
Table 1.
Surface-water sampling sites in Yolo By-Pass and Cache Slough Complex (National Water Quality Monitoring Council, 2023; U.S. Geological Survey, 2023).[DWR, California Department of Water Resources; USGS, U.S. Geological Survey; CA, California]
The California Department of Water Resources (DWR) began the North Delta Food Subsidies (NDFS) Action in collaboration with multiple stakeholders to generate managed summer and fall flow pulses in Yolo By-Pass that stimulate phytoplankton and zooplankton growth and transport in Yolo By-Pass and Cache Slough complex and provide a food subsidy to areas farther downstream in the Delta (Davis and others, 2019). The U.S. Geological Survey (USGS) participates in this ongoing project to provide data that describe how these flow pulses affect pesticide concentrations in Yolo By-Pass and Cache Slough complex.
In July 2016 and September 2018, project collaborators produced a managed flow pulse into Yolo By-Pass with the goal of stimulating phytoplankton growth and thus improving the Delta food web and habitat for delta smelt. In 2016, Sacramento River (fig. 1) water primarily was used for the managed flow pulse in Yolo By-Pass. This managed flow pulse was correlated with an increase in phytoplankton downstream in Cache Slough complex and in the Sacramento River at Rio Vista (Frantzich and others 2021; fig. 1). In 2018, agricultural tailwater primarily was used for the managed flow pulse. Phytoplankton did not increase after this managed flow pulse, but zooplankton increased in upper Yolo By-Pass (Davis and others, 2019). These varied results demonstrated the need for further research into the effects of different managed pulse-flow designs.
Herbicides, fungicides, and insecticides are present in Yolo By-Pass and Cache Slough complex throughout the year. The concentrations of these pesticide compounds vary depending on flows, application timing, and quantities applied (Smalling and others, 2005, 2007; Weston and others, 2014; Orlando and Drexler, 2017). Previous work by the USGS indicated that pesticide concentrations generally were greater in Yolo By-Pass and Cache Slough complex just before or during flow pulses generated using agricultural tailwater compared to flow pulses sourced from the Sacramento River or during ambient conditions (Orlando and others, 2020).
Purpose and Scope
The U.S. Geological Survey collaborated with the California Department of Water Resources to observe correlations among flow pulses and occurrences and concentrations of pesticides in Cache Slough complex and Yolo By-Pass. The purpose of this report is to describe the methods involved in collecting and analyzing surface-water samples in support of the NDFS study, in cooperation with the DWR. Samples were analyzed for a suite of as many as 178 current-use pesticides and their degradates from as many as 6 surface-water sites within and near Yolo By-Pass in 2019, 2020, and 2021. The purpose of this project is to observe and better understand the presence of pesticides in surface waters of Yolo By-Pass before, during, and after flow pulses. The presence of some current-use pesticides in the study area can inhibit the development and growth of phytoplankton (Peterson and others, 1994).
Study Area
Yolo By-Pass is used to manage water for flood control, riparian corridors, and agricultural land in areas surrounding the Delta. Wetlands associated with Yolo By-Pass are important habitats for many species. Yolo By-Pass is seasonally wetted from October to June by waters from the Sacramento River and Feather River overtopping the Fremont and Sacramento Weirs (Sommer and others, 2001; not shown). Other inlets to Yolo By-Pass include Cache Creek, Willow Slough (not shown), and South Fork Putah Creek (fig. 1). Water from these inputs supplies a channel along the eastern edge of Yolo By-Pass called “Tule Canal” (not shown) in the northern section of Yolo By-Pass and the Toe Drain (fig. 1) to the south. During the drier months, the wetted area of Yolo By-Pass is confined to the perennial Toe Drain, which flows south to Cache Slough complex (Frantzich and others, 2021). Agricultural tailwater enters Yolo By-Pass through the Colusa Basin Drainage Canal (a man-made structure built in the 1920s to drain runoff from private and public lands; fig. 1) and directly from agriculture in lands surrounding Yolo By-Pass (Orlando and others, 2020; fig. 1).
Water flows from north to south through Yolo By-Pass and terminates into Prospect Slough in the Cache Slough complex. Urban runoff or wastewater that sources into Yolo By-Pass include the Davis Wastewater Treatment Plant (fig. 1), which releases water into Willow Slough Bypass (not shown), and the City of Woodland Water Pollution Control Facility (fig. 1) that discharges water into Tule Canal about 8 kilometers (km) east of the facility just upstream from surface-water sampling site RD22 (City of Woodland, 2022; fig. 1). During times of low flow, water is tidally pumped from the Sacramento River and the Delta into the lower parts of the Toe Drain and Cache Slough complex.
The most northern surface-water site sampled during the study, Colusa Basin Drain at Road 99E near Knights Landing, California (RMB; fig. 1), is on the Colusa Basin Drainage Canal approximately 4.8 km upstream from the Knights Landing Ridge Cut (not shown), which conveys water from Colusa Basin Drainage Canal to Yolo By-Pass (Gahan and others, 2016). Tule Canal at Road 22 near Woodland, California (RD22; fig. 1), is a surface-water site on Tule Canal at the Road 22 overpass. Toe Drain near Babel Slough near Freeport, California (LIS; fig. 1), is approximately 11.02 km downstream from the Interstate 80 overpass. Toe Drain near Widgeon Road near Courtland, California (STTD; fig. 1), is another 14.48 km downstream from LIS. The southernmost surface-water site is Prospect Slough at Prospect Island near Ryde, California (BL5; fig. 1), which is just outside Liberty Island, about 1.33 km downstream from the confluence of the Toe Drain and Prospect Slough. Sacramento River at Sherwood Harbor near West Sacramento, California (SHR; fig. 1), is a surface-water site outside Yolo By-Pass on the Sacramento River approximately 8.56 km downstream from the confluence of the Sacramento and American Rivers (fig. 1), and this surface-water site is sampled by the DWR to provide a comparison for samples collected in Yolo By-Pass. Overall, there were as many as six surface-water sampling sites sampled in an event during this study (table 1).
Yolo By-Pass Pesticide Use
Pesticides from urban and agricultural runoff are sourced from areas internal and external to Yolo By-Pass. The California Department of Pesticide Regulation requires all agricultural and professional pesticide applications to be reported (California Department of Pesticide Regulation, 2022). Pesticides applied for private home use are not reported. During summer and fall 2019, 8.58×10⁵ kilograms (kg) of synthetic pesticides (excluding natural pesticides like sulfur, kaolin, or mineral oil) were applied to the Yolo By-Pass drainage basin, and 1.73×10⁶ kg of synthetic pesticides were applied to areas of the Sacramento River drainage basin upstream from surface-water site SHR. During the summer and fall 2020, 7.91×10⁵ kg and 1.69×10⁶ kg of synthetic pesticides were applied to the Yolo By-Pass and Sacramento River drainage basins, respectively. Pesticide applications to rice crops account for the largest share of pesticide applications during summer and fall. In 2019, 47.7 percent of the pesticides applied to areas in the Yolo By-Pass drainage basin were applied to rice crops; 32.0 percent of pesticides were applied to rice crops in the Sacramento River drainage basin. For summer and fall 2020, the percentage of pesticide applied to rice crops dropped to 44.2 in the Yolo By-Pass drainage basin but increased to 36.4 percent in the Sacramento River drainage basin.
Hydrologic Conditions
In 2021, hydrologic conditions were exceptionally dry in Yolo By-Pass, with a daily mean discharge near zero. In drier years, like 2013, 2015, and 2020, local discharge and short periods of positive flow into Yolo By-Pass may have affected pesticide detections. Streamflow within Yolo By-Pass was measured at USGS site 11453000 (fig. 2; U.S. Geological Survey, 2023), which is on the Tule Canal along the eastern border of Yolo By-Pass and is collocated with DWR surface-water site RD22 (California Department of Water Resources, 2023). Figure 2 shows a spike in mean daily discharge in Yolo By-Pass caused by managed flow pulses of agricultural water between August 27, 2019, to September 20, 2019. Peak flow at site 11453000 reached 773 cubic feet per second (ft3/s) during this event on September 6, 2019, at 4:00 p.m. Due to persistent drought conditions in 2020 and 2021, there were no managed flow pulses. Moreover, fallowing of the agricultural land between the Colusa Basin Drainage Canal and the Sacramento River in summer 2021 resulted in no flow at surface-water site RMB before August 10, 2021.
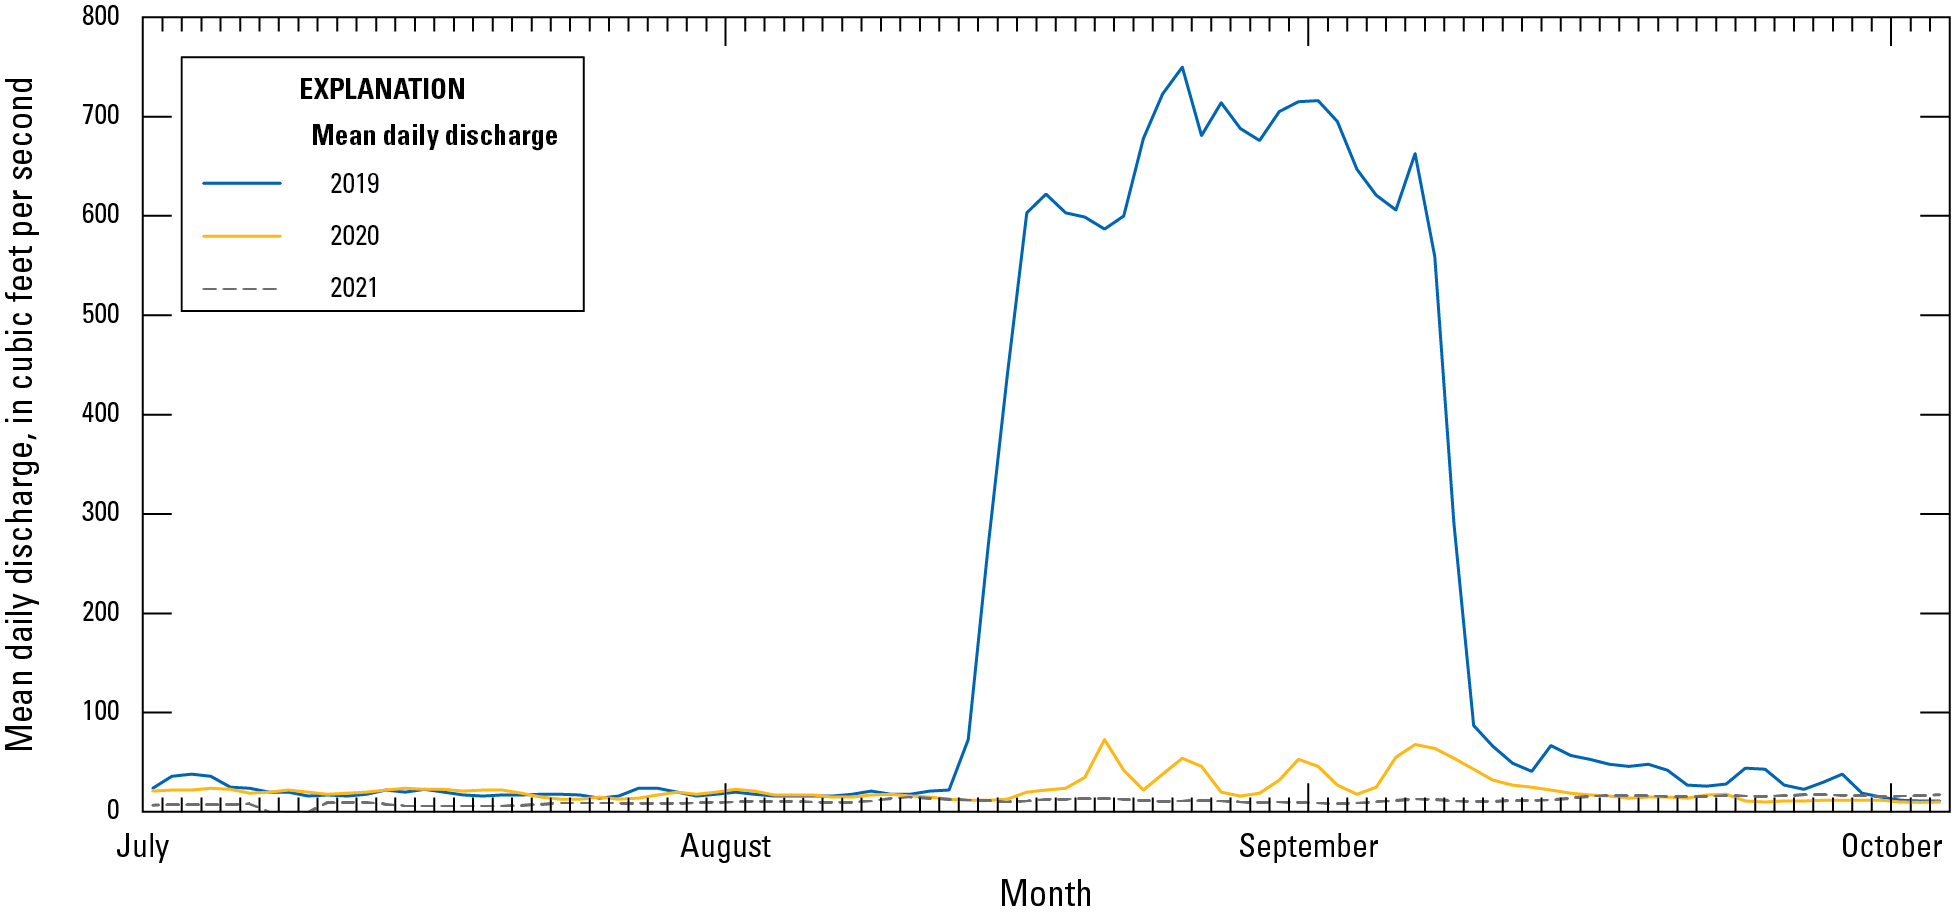
Daily mean discharge at U.S Geological Survey site 11453000 (Yolo By-Pass near Woodland, California; U.S. Geological Survey, 2023) for summer and fall 2019, 2020, and 2021.
Methods
Laboratory methods included liquid chromatography with tandem mass spectrometry (LC/MS/MS), gas chromatography with mass spectrometry (GC/MS), and gas chromatography with tandem mass spectrometry (GC/MS/MS). Samples were collected by hand from either a bank or boat.
Sample Collection
Surface-water samples were collected by DWR personnel at six surface-water sites in 2019 and at five surface-water sites in 2020 and 2021 (table 1). There were six sampling events in 2019 and 2021, and events were designed so that two events each would take place before, during, and after pulse-flow events in Yolo By-Pass (managed flow pulse in 2019; unmanaged flow pulse in 2021). In 2020, only six samples during one sampling event were collected because wildfire smoke and Covid-19 pandemic restrictions on field work prevented DWR personnel from collecting more samples throughout the year.
Samples were collected from the stream bank using a pole sampler at surface-water sites RMB, RD22, and LIS (fig. 1). Samples were collected from the center of the channel by hand-dipping a bottle from a boat at surface-water sites STTD, BL5, and SHR. In 2019 and 2020, 2 liters (L) of water (two 1-L baked, amber glass bottles which were filled in succession) were collected at each surface-water site for analysis. In 2021, samples consisted of a single 1-L baked, amber glass bottle filled at each surface-water site. All water samples were stored on wet ice and transported to the U.S. Geological Survey Organic Chemistry Research Laboratory in Sacramento, California, within 24 hours of collection. At each sampling event, standard water-quality parameters (water temperature, specific conductance, pH, dissolved oxygen concentration, and turbidity) were measured (table 2).
Table 2.
Water-quality parameters measured in water samples collected at surface-water sites in Yolo By-Pass and Cache Slough complex, 2019, 2020, and 2021 (U.S. Geological Survey, 2023).[Additional site information is provided in table 1. Abbreviations: mm/dd/yyyy, month/day/year; hh:mm, hour:minute; °C, degrees Celsius; μS/cm, microsiemens per centimeter at 25 degrees Celsius; mg/L, milligrams per liter; FNU, formazin nephelometric unit]
Pesticide Extraction and Analysis
Water samples were filtered and extracted at the Organic Chemistry Research Laboratory within 24 hours of sample collection. All water samples were filtered using pre-weighed, baked, 0.7-micrometer (μm) glass-fiber filters. Filter papers were dried at room temperature and then stored in the dark at −20 degrees Celsius (°C) until extraction.
The 2019 and 2020 water and suspended sediment samples were analyzed following the procedures described in Hladik and others (2008, 2009), Hladik and Calhoun (2012), and Hladik and McWayne (2012).
Surface-water samples collected in 2021 were analyzed for 178 compounds using methods described in Gross and others (2021). Suspended sediment samples were analyzed for 173 compounds using the same methods. The water extraction procedure was the same as the LC/MS/MS extraction procedure used for 2019 and 2020 samples; however, only 1 L of water was necessary for analysis by LC/MS/MS and GC/MS/MS. The procedure for extracting suspended-sediment samples also remained the same among all years. Many analytes that were previously analyzed by GC/MS were transitioned to LC/MS/MS; analytes that could not be analyzed by LC/MS/MS were analyzed by GC/MS/MS. Filtered water and suspended-sediment samples were spiked with 50 microliters (µL) of a recovery surrogate solution consisting of 1 nanogram per microliter (ng/µL) atrazine-13C3, fipronil-13C4,15N2, imidacloprid-d4, metolachlor-13C6, monuron, cis-permethrin-13C6, p,p′-DDE-13C12, tebuconazole-13C3, and trifluralin-d14. Filtered water and suspended-sediment fractions also were spiked with 20 µL of the same internal standard solution consisting of 2.5 ng/µL of acenaphthene-d10, bifenthrin-d5, clothianidin-d3, myclobutanil-d4, and oxyfluorfen-d5.
Analytical Methods
Water-sample extracts analyzed by LC/MS/MS in 2019 and 2020 were completed on an Agilent (Agilent Technologies, Santa Clara, Calif.) 1100 high-performance liquid chromatography (HPLC) system coupled to a 6430 tandem mass spectrometry (MS) system with a Zorbax Eclipse XDB-C18 column (2.1 by 150 by 3.5 millimeters [mm]). Full method details are reported in Hladik and Calhoun (2012). Surface-water-sample extracts and suspended sediments from 2019 and 2020 were analyzed by GC/MS, an Agilent 7890A gas chromatograph with an Agilent 5975C Inert XL electron ionization (EI) mass-selective detector system using a DB-5MS analytical column (30 meters [m] by 0.25 mm by 0.25 μm) for separation with helium as the carrier gas. Full method details are reported in Hladik and others (2008, 2009).
After August 2021, all sample extracts were analyzed using LC/MS/MS followed by GC/MS/MS. LC/MS/MS analyses were completed using Agilent Technologies (Santa Clara, Calif.) 1260 infinity bio-inert high-performance liquid chromatograph coupled to a 6430 triple quadrupole mass spectrometer. The column used for separation was an Agilent Technologies Zorbax Eclipse XDB-C18 column (2.1 mm×150 mm, 3.5 µm) preceded by a Zorbax Eclipse XDB-C8 guard cartridge (2.1 mm×12.5 mm, 5 µm). For electrospray ionization (ESI)(+) analysis, the mobile phase consisted of 0.1 percent formic acid in water and acetonitrile. For negative ESI analysis, the mobile phase consisted of 0.1 percent formic acid in water and methanol. The sample volume injected for analysis was 10 µL, and the rate of sample injection through the column was 0.6 milliliters per minute (mL/min). Data were collected in the multiple reaction monitoring mode.
A Trace 1310 gas chromatograph coupled to a TSQ 9000 triple quadrupole mass spectrometer (Thermo Scientific, Waltham, Massachusetts) was used to complete GC/MS/MS analyses. The column used for separation was a DB-5MS analytical column (30 m×0.25 mm×0.25 μm, Agilent Technologies, Santa Clara, Calif.) with helium as the carrier gas at a 1.2 mL/min flow rate. Sample injection volume was 1 µL. A programmable temperature vaporizing inlet and an advanced electron ionization source was equipped to the instrument. The oven was brought to a temperature of 65 °C and held for 2 minutes. The temperature was then increased at a rate of 25 degrees Celsius per minute (°C/min) until 150 °C was reached and held for 1 minute. Another increase in temperature followed at a rate of 25 °C/min until 215 °C was reached and held for 2 minutes. Another increase in temperature was started at a rate of 5 °C/min until 280 °C was reached followed by a final increase at a rate of 10 °C/min until 300 °C was reached and held for 5 minutes. The mass transfer line and ion source were held at 250 °C and 320 °C, respectfully. Finally, data were collected in selected reaction monitoring mode. Full details regarding analyses using this method are reported in Gross and others (2021). Method detection limits for pesticide concentrations in water and sediment samples are in table 3.
Table 3.
Method detection limits for pesticides dissolved in water and on suspended sediments measured by the U.S. Geological Survey Organic Chemistry Research Laboratory (Gross and others 2021; U.S. Geological Survey, 2023) 2019–21.[Pesticide type: Ins, insecticide; Ins Deg, insecticide degradate; Herb, herbicide; Herb Deg, herbicide degradate; Fun, fungicide; Fun Deg, fungicide degradate; Ins GR, insect growth regulator; Syn, synergist; Plant GR, plant growth regulator; NS, nitrogen stabilizer; Def, defoliant. Abbreviations: NWIS, National Water Information System; CAS, Chemical Abstracts Service; MDL, method detection limit; ng/L, nanograms per liter; LC/MS/MS, liquid chromatography with tandem mass spectrometry; GC/MS, gas chromatography with mass spectrometry; GC/MS/MS, gas chromatography with tandem mass spectrometry; NA, not analyzed; DCPA, Dacthal; DCPMU, 3-(3,4-dichlorophenyl)-1-methylurea; DCPU, 3,4-dichlorophenylurea; EPTC, Eptam]
Results for water samples were validated using a variety of quality-control samples, including field replicates, trip blanks, laboratory spikes, and laboratory-spike replicates. During the study, five pesticide field-replicate samples were analyzed to test the reproducibility of results based on field-sampling methods. Results from the environmental and field-replicate pairs satisfied the project quality assurance requirement of less than 25-percent relative percent difference (RPD) between environmental samples and their field-replicate pairs. All pesticides detected in replicate samples also were detected in corresponding environmental samples. Suspended sediments also were analyzed in the 4 field replicate samples, and there were 12 detections of pesticides in the sample pairs. Results satisfied the project quality assurance requirement of less than 25-percent RPD between environmental samples and their field-replicate pairs, and all pesticides detected in replicate samples also were detected in corresponding environmental samples.
Four pesticide trip blanks consisting of laboratory water taken into the field and exposed to the atmosphere during sample collection at one surface-water site were processed to verify the cleanliness of pesticide sample collection and processing protocols. Filters from the three pesticide field blanks also were saved and analyzed as suspended-sediment field blanks. Pesticides were not detected in any pesticide field blanks.
Five pesticide matrix-spike samples and five corresponding pesticide matrix-spike replicate samples were collected to assess pesticide recovery, degradation, sorption, and potential interferences caused by the sampling matrix. Filters from the three pesticide matrix spike samples and their corresponding matrix spike replicate samples also were saved and analyzed. All matrix-spike samples met the project quality-assurance objectives of 70–130 percent recovery of pesticide matrix-spike compounds and less than 25-percent RPD between matrix spike and matrix-spike replicate pairs.
Pesticide Presence in Yolo By-Pass and Cache Slough Complex
During the 3 years of this study, a total of 52 different pesticides or pesticide degradates were detected in water samples: 17 herbicides, 15 fungicides, 19 insecticides, and 1 synergist. Azoxystrobin, 3,4-Dichloroaniline (3,4-DCA), and methoxyfenozide were detected in all water samples, and the most frequently detected pesticides are shown in table 4. The number of compounds detected in each water sample ranged from 4 to 25. The insecticides bifenthrin, fipronil, dichlorvos, imidacloprid, and naled were detected with concentrations above the U.S. Environmental Protection Agency (EPA) aquatic life benchmarks throughout this 3-year study (U.S. Environmental Protection Agency, 2022). Of these five compounds, dichlorvos was detected the most often, appearing in five water samples and having the highest concentration of these compounds (89.3 nanograms per liter [ng/L]). Three water samples from surface-water site RMB contained dichlorvos at a concentration above its acute invertebrate toxicity benchmark of 33.4 ng/L. Dichlorvos was only detected in the 2021 sample year. Bifenthrin concentrations above EPA aquatic life benchmarks were detected in one water sample in 2019 and in three suspended sediment samples during the 3-year study, once in 2019 and twice in 2021. Measured bifenthrin concentrations in water were above the chronic freshwater vertebrate (4 ng/L) and acute invertebrate (0.2 ng/L) toxicity benchmarks. Concentrations of bifenthrin in suspended sediment also were above acute and chronic toxicity benchmarks for invertebrates. Fipronil was detected in four water samples (three collected in 2019 and one collected in 2020) above its chronic invertebrate toxicity benchmark (11 ng/L) during the 3-year study. All samples exceeding benchmark levels were collected at surface-water site RD22 (table 1; fig. 1). Fipronil was not detected in any suspended-sediment samples. Imidacloprid was detected above its chronic invertebrate toxicity benchmark of 10 ng/L in two water samples collected from surface-water site RD22 during 2021. Naled was only included as an analyte for 2021 and was detected in two water samples collected from RMB. The concentration of naled in one of these water samples exceeded the chronic invertebrate toxicity benchmark of 10 ng/L, and the concentration of naled in the other water sample also exceeded the acute toxicity benchmark of 57.5 ng/L (U.S. Geological Survey, 2023).
Table 4.
Detection frequencies and maximum concentrations of dissolved pesticides and pesticide degradates detected in water samples collected from Yolo By-Pass and Cache Slough complex in 2019, 2020, and 2021 (U.S. Geological Survey, 2023).[U.S. Geological Survey National Water Information System parameter codes for each pesticide and pesticide degradate are provided in table 3. Pesticide type: Herb, Herbicide; Fun, Fungicide; Ins, Insecticide; Syn, Synergist. Abbreviations: %, percent; ng/L, nanograms per liter; NA, not analyzed; —, concentration below reporting limit; DCPMU, 3-(3,4-dichlorophenyl)-1-methylurea; DCPU, 3,4-dichlorophenylurea]
A total of eight different pesticides (three herbicides, two fungicides, two insecticides, and one synergist) were detected in the suspended-sediment samples collected during the 3-year study (table 5). Concentrations ranged from below reporting levels to 33.2 ng/L. Azoxystrobin was the most frequently detected pesticide in suspended sediment; however, there were few pesticide detections in sediment overall. Of the 23 pesticide detections in sediment during the study, 15 were in samples collected from surface-water site RMB, and RMB generally had higher suspended-sediment concentrations compared to other surface-water sites (U.S. Geological Survey, 2023). Concentrations of pesticides in suspended sediments are provided in ng/L to facilitate the approximation of a whole-water pesticide concentration by summing the dissolved and suspended-sediment concentrations of pesticides.
Table 5.
Detection frequencies and maximum concentration of pesticides detected in suspended sediment collected from Yolo By-Pass and Cache Slough complex in 2019, 2020, and 2021 (U.S. Geological Survey, 2023).[U.S. Geological Survey National Water Information System parameter codes for each pesticide and pesticide degradate are provided in table 3. Pesticide type: Fun, Fungicide; Ins, Insecticide; Herb, Herbicide; Syn, Synergist. Abbreviations: %, percent; ng/L, nanograms per liter; —, concentration below reporting limit; NA, not analyzed]
Generally, pesticide concentrations were higher at more northern surface-water sites within Yolo By-Pass and decreased toward the southern surface-water sites. Temporally, pesticide concentrations were generally higher before and during managed flow pulses in 2019. Overall, pesticide concentrations were higher in 2019 compared to 2021. Total pesticide concentrations decreased through time in 2019 but remained relatively stable in 2021. Surface-water sites RMB and RD22, the most northern surface-water sites, also had the most detections that surpassed the EPA aquatic life benchmarks for acute and chronic toxicity to either freshwater vertebrate or invertebrates (U.S. Environmental Protection Agency, 2022). Average total pesticide concentrations in water samples were lower in 2021 when there was no flow pulse than in 2019 when there was a managed flow pulse (fig. 3). Decreased pesticide applications and decreased agricultural drainage due to drought conditions and farmland fallowing in 2021 may have contributed to lower mean pesticide concentrations in 2021 (California Department of Pesticide Regulation, 2023). Finally, total pesticide concentrations in 2019 decreased after the managed flow pulse (fig. 4). Total concentrations by surface-water site are compared to daily mean discharge from USGS site 11453000 for 2021 (fig. 5).
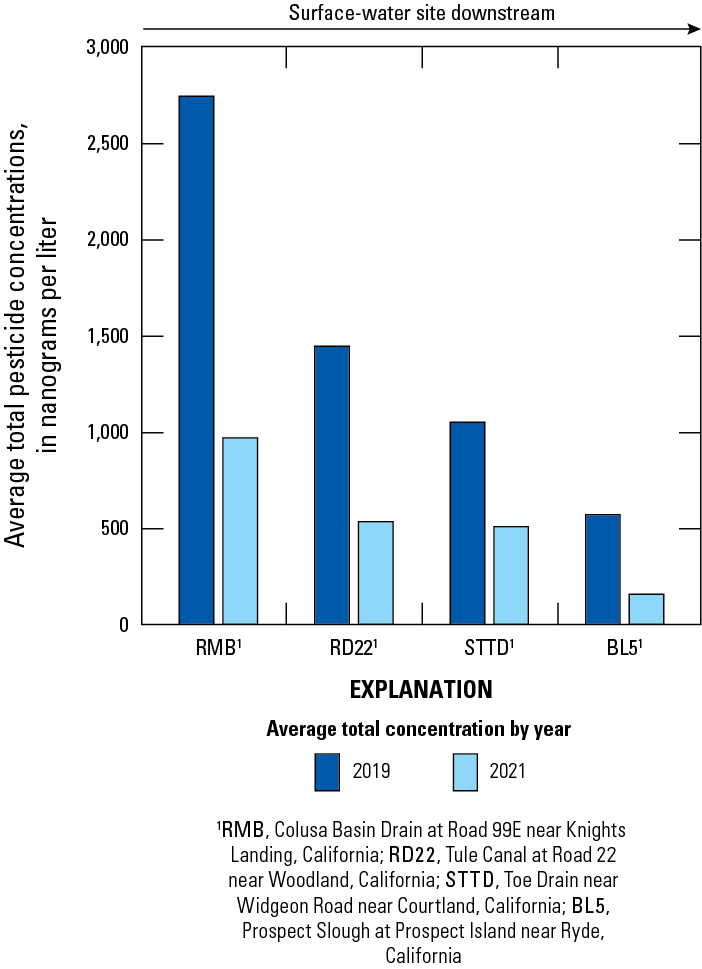
Average total pesticide concentrations by surface-water site (surface-water site names and locations defined in table 1 and fig. 1, respectively) for 2019 and 2021 (U.S. Geological Survey, 2023).
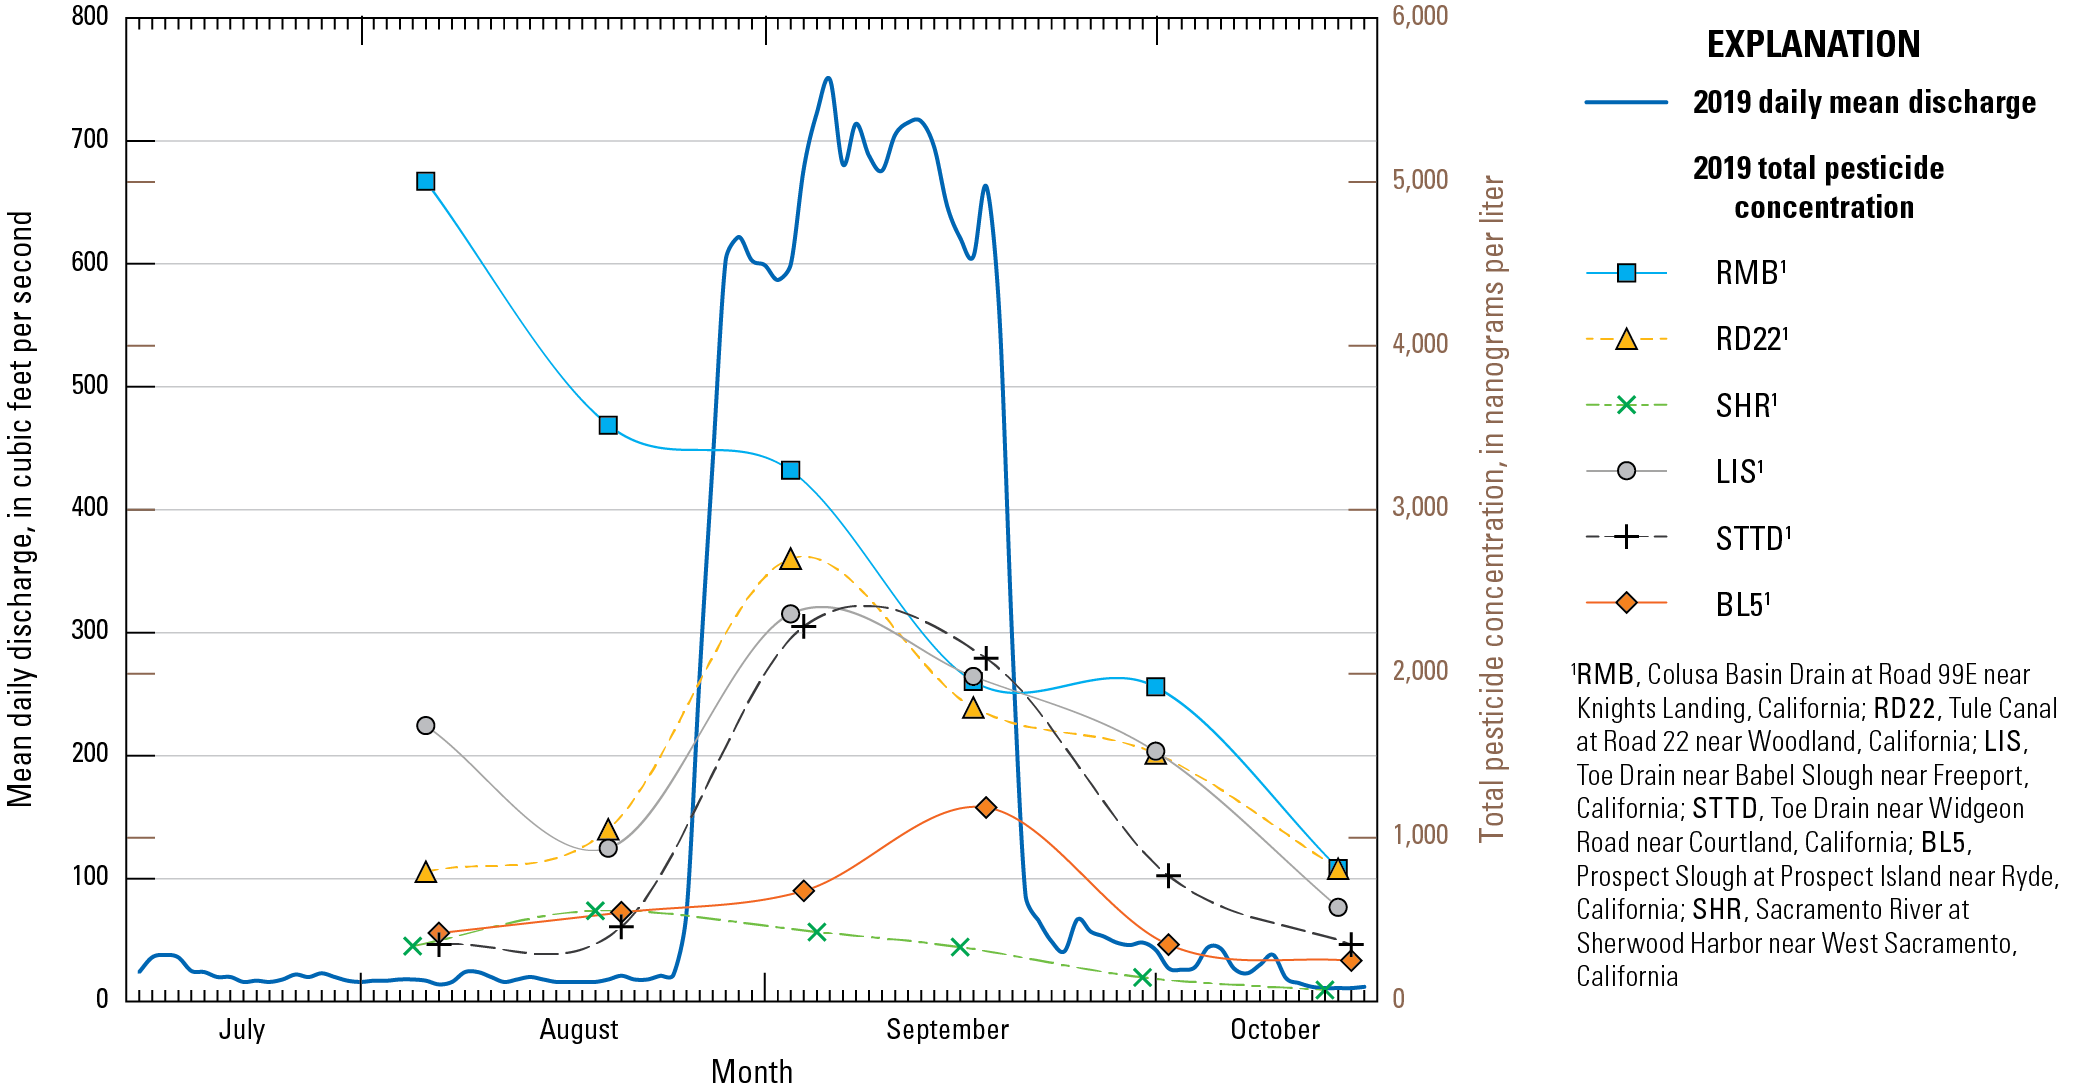
Total pesticide concentration by surface-water site versus daily mean discharge at U.S. Geological Survey site 11453000 for 2019 (surface-water site names and locations defined in table 1 and fig. 1, respectively; U.S. Geological Survey, 2023).
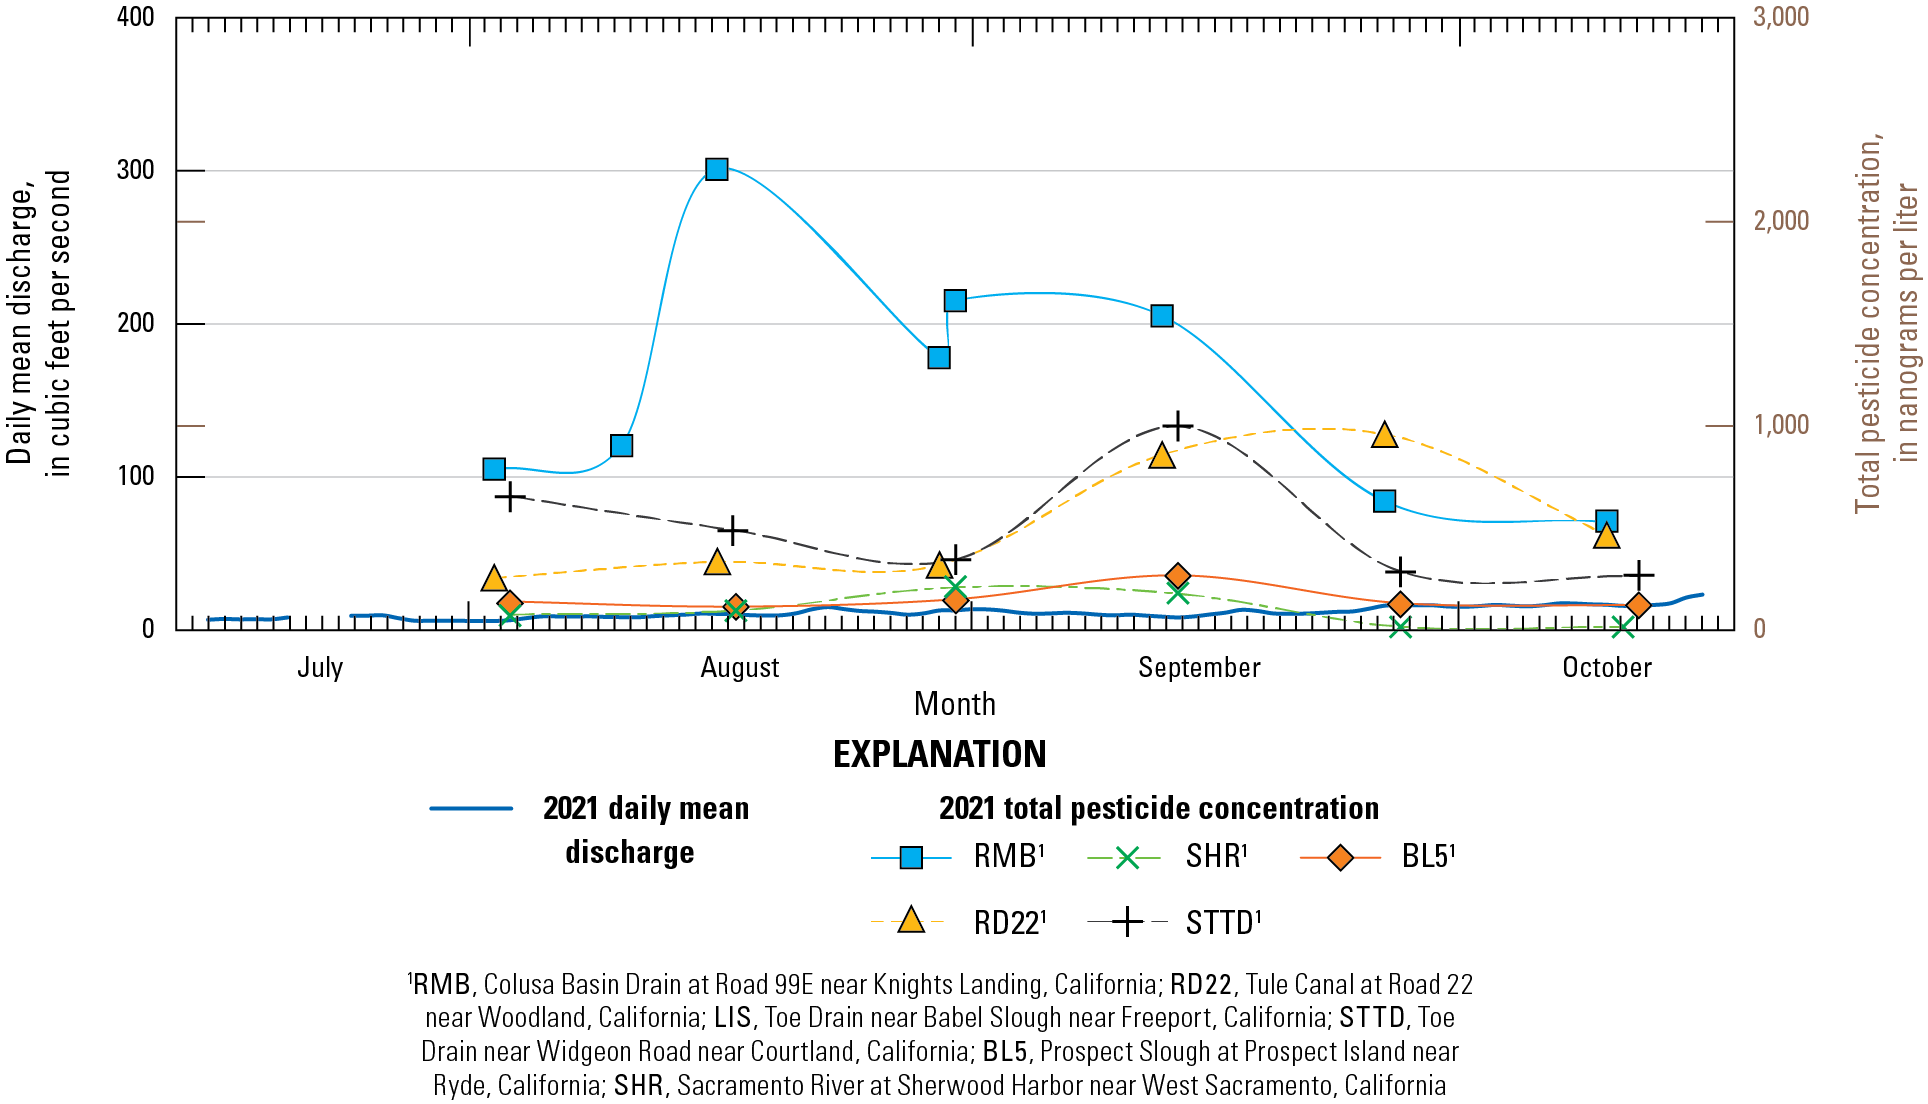
Total pesticide concentration by surface-water site versus daily mean discharge at U.S. Geological Survey site 11453000 for 2021 (surface-water site names and locations defined in table 1 and fig. 1, respectively; U.S. Geological Survey, 2023).
Summary
The Sacramento-San Joaquin Delta provides habitat for several threatened or endangered fish species; Cache Slough complex and Yolo By-Pass are key to the production of phytoplankton as a food source for those species. Current-use pesticides have been known to inhibit phytoplankton and zooplankton growth and have been detected in surface water and suspended sediment throughout the study area. All samples collected during this study contained mixtures of multiple pesticides. Of the 73 water samples analyzed, 16 (22 percent) contained at least 1 pesticide with a concentration above an aquatic life benchmark established by the U.S. Environmental Protection Agency (EPA). Overall, 53 different current-use pesticides and pesticide degradates were detected with concentrations ranging from below the method detection limits to 4,070 nanograms per liter. Of these detections, five were in concentrations above the EPA aquatic life benchmarks.
Total pesticide concentrations were higher at surface-water sites in the northern end of Yolo By-Pass and decreased at surface-water sites farther downstream. Total pesticide concentrations were higher at most surface-water sites before or during the managed flow pulse in 2019 compared to after the flow pulse. Finally, total mean pesticide concentrations for each surface-water site generally were higher during the flow pulse year of 2019 than during 2021 when there was no flow pulse. Conditions in 2021 were critically dry, with daily mean discharge in Yolo By-Pass near zero. Historically, drier years like 2013, 2015, and 2020 still demonstrated local discharge and a short period of net positive flow in Yolo By-Pass that may have affected pesticide detections. Additional evaluations of managed flow-pulse effects on pesticides and non-managed pulses in the By-Pass are warranted. Monitoring of the presence of current-use pesticides in conjunction with the California Department of Water Resources (DWR) managed flow pulses in Yolo By-Pass and Cache Slough complex is planned to continue for several more years. The continued collection of these data will provide the DWR and other agencies insight on the effects of managed flow pulses.
References Cited
Brown, L.R., Ayers, D.E., Bergamaschi, B., Burau, J.R., Dailey, E.T., Downing, B., Downing-Kunz, M., Feyrer, F.V., Huntsman, B.M., Kraus, T., Morgan, T., Lacy, J.R., Parchaso, F., Ruhl, C.A., Stumpner, E., Stumpner, P., Thompson, J., and Young, M.J., 2024, Physics to fish—Understanding the factors that create and sustain native fish habitat in the San Francisco Estuary: U.S. Geological Survey Open-File Report 2023–1087, 150 p. [Available at https://doi.org/10.3133/ofr20231087.]
California Department of Pesticide Regulation, 2022, Pesticide use data for 2019 and 2020: California Department of Pesticide Regulation, data available upon request from California Department of Pesticide Regulation, accessed January 25, 2022, at https://www.cdpr.ca.gov/docs/pur/purmain.htm.
California Department of Pesticide Regulation, 2023, Pesticide use annual report 2021 data summary: California Department of Pesticide Regulation, accessed July 6, 2023, at https://www.cdpr.ca.gov/docs/pur/pur21rep/pur_2021_data_summary.pdf.
California Department of Water Resources, 2023, Water data library station map: California Department of Water Resources, accessed June 2023 at https://wdl.water.ca.gov/WaterDataLibrary/StationDetails.aspx?Station=A0D84061386&source=map.
California Natural Diversity Database, 2024, State and Federally listed endangered and threatened animals of California: Sacramento, Calif., California Department of Fish and Wildlife, accessed February 29, 2024, at https://nrm.dfg.ca.gov/FileHandler.ashx?DocumentID=109405&inline.
City of Woodland, 2022, Water pollution control facility—Wastewater treatment at Woodland’s water pollution control facility: City of Woodland Water Pollution Control Facility web page, accessed January 4, 2022, at https://www.cityofwoodland.org/741/Water-Pollution-Control-Facility.
Davis, B., Martinez, J., Frantzich, J., and Sommer, T., 2019, 2019 Food web study fact sheet: North Delta Flow Action, 2 p., accessed May 19, 2023, at https://www.baydeltalive.com/assets/5c92b61032e1bfd2c6a30d4ee74773aa/application/pdf/North_Delta_Food_Web_Study_Fact_Sheet_06272019.pdf.
Frantzich, J., Davis, B.E., MacWilliams, M., Bever, A., and Sommer, T., 2021, Use of a managed flow pulse as food web support for estuarine habitat: San Francisco Estuary and Watershed Science, v. 19, no. 3, 28 p., accessed December 9, 2021, at https://doi.org/10.15447/sfews.2021v19iss3art3.
Frantzich, J., Sommer, T., and Schreier, B., 2018, Physical and biological responses to flow in a tidal freshwater slough complex: San Francisco Estuary and Watershed Science, v. 16, no. 1, art. 3, accessed December 10, 2021, at https://escholarship.org/content/qt6s50h3fb/qt6s50h3fb.pdf.
Gahan, K., Healy, M., McKibbin, C., Kubo, H., and Purdy, C., 2016, Colusa Basin drain and Wallace Weir fish trapping and relocation efforts, November 2013–June 2014: California Department of Fish and Wildlife North Central Region, 37 p., accessed January 11, 2022, at https://nrm.dfg.ca.gov/FileHandler.ashx?DocumentID=137557.
Gross, M.S., Sanders, C.J., De Parsia, M.D., and Hladik, M.L., 2021, A multiresidue method for the analysis of pesticides in water using solid-phase extraction with gas and liquid chromatography-tandem mass spectrometry (ver. 2.0, April 2023): U.S. Geological Survey data release, accessed February 2, 2022, at https://doi.org/10.5066/P9J8E544.
Hladik, M.L., and Calhoun, D.L., 2012, Analysis of the herbicide diuron, three diuron degradates, and six neonicotinoid insecticides in water—Method details and application to two Georgia streams: U.S. Geological Survey Scientific Investigations Report 2012–5206, 10 p. [Available at https://doi.org/10.3133/sir20125206.]
Hladik, M.L., and McWayne, M.M., 2012, Methods of analysis—Determination of pesticides in sediment using gas chromatography/mass spectrometry: U.S. Geological Survey Techniques and Methods, book 5, chap. C2, 19 p., accessed January 12, 2022, at https://pubs.usgs.gov/tm/tm5c3.
Hladik, M.L., Smalling, K.L., and Kuivila, K.M., 2008, A multi-residue method for the analysis of pesticides and pesticide degradates in water using HLB solid phase extraction and gas chromatography-ion trap mass spectrometry: Bulletin of Environmental Contamination and Toxicology, v. 80, no. 2, p. 139–144, accessed January 28, 2022, at https://doi.org/10.1007/s00128-007-9332-2.
Hladik, M.L., Smalling, K.L., and Kuivila, K.M., 2009, Methods of analysis—Determination of pyrethroid insecticides in water and sediment using gas chromatography/mass spectrometry: U.S. Geological Survey Techniques and Methods, book 5, chap. C2, 18 p., accessed January 28, 2022, at https://pubs.er.usgs.gov/publication/tm5C2.
National Water Quality Monitoring Council, 2023, Water Quality Portal Data Sites for CEDEN: National Water Quality Monitoring Council web page, accessed September 19, 2023, at https://www.waterqualitydata.us/provider/STORET/CEDEN/.
Nobriga, M.L., Feyrer, F., Baxter, R.D., and Chotkowski, M., 2005, Fish community ecology in an altered river delta—Spatial patterns in species composition, life history strategies, and biomass: Estuaries, v. 28, no. 5, p. 776–785, accessed August 10, 2022, at https://link.springer.com/article/10.1007/BF02732915.
Orlando, J.L., and Drexler, J.Z., 2017, Factors affecting marsh vegetation at the Liberty Island Conservation Bank in the Cache Slough region of the Sacramento-San Joaquin Delta, California: U.S. Geological Survey Open-File Report 2017–1077, 25 p., accessed January 28, 2022, at https://pubs.er.usgs.gov/publication/ofr20171077.
Orlando, J.L., De Parsia, M., Sanders, C., Hladik, M., and Frantzich, J., 2020, Pesticide concentrations associated with augmented flow pulses in the Yolo By-Pass and Cache Slough Complex, California: U.S. Geological Survey Open-File Report 2020–1076, 101 p., accessed January 11, 2022, at https://doi.org/10.3133/ofr20201076.
Peterson, H.G., Boutin, C., Martin, P.A., Freemark, K.E., Ruecker, N.J., and Moody, M.J., 1994, Aquatic phyto-toxicity of 23 pesticides applied at expected environmental concentrations: Aquatic Toxicology, v. 28, nos. 3–4, p. 275–292, accessed January 26, 2022, at https://doi.org/10.1016/0166-445X(94)90038-8.
Smalling, K.L., Orlando, J.L., and Kuivila, K.M., 2005, Analysis of pesticides in surface water and sediment from Yolo By-Pass, California, 2004–2005: U.S. Geological Survey Scientific Investigations Report 2005–5220, 20 p., accessed February 9, 2022, at https://pubs.er.usgs.gov/publication/sir20055220.
Smalling, K.L., Orlando, J., and Kuivila, K.M., 2007, Occurrence of pesticides in water, sediment, and soil from the Yolo By-Pass, California: San Francisco Estuary and Watershed Science, v. 5, no. 1, 17 p., accessed February 9, 2022, at https://escholarship.org/uc/item/9716926g.
Sommer, T., Harrell, B., Nobriga, M., Brown, R., Moyle, P., Kimmerer, W., and Schemel, L., 2001, California’s Yolo By-Pass—Evidence that flood control can be compatible with fisheries, wetlands, wildlife, and agriculture: Bethesda, Md., Fisheries, v. 26, no. 8, p. 6–16, accessed January 14, 2022, at https://doi.org/10.1577/1548-8446(2001)026<0006:CYB>2.0.CO;2.
U.S. Environmental Protection Agency, 2022, Aquatic life benchmarks and ecological risk assessments for registered pesticides: U.S. Environmental Protection Agency, Office of Pesticide Programs, accessed June 15, 2022, at https://www.epa.gov/pesticide-science-and-assessing-pesticide-risks/aquatic-life-benchmarks-and-ecological-risk.
U.S. Fish and Wildlife Service, 2023, Environmental conservation online system: U.S. Fish and Wildlife Service web page, accessed May 19, 2023, at https://ecos.fws.gov/ecp/.
U.S. Geological Survey, 2023, USGS water data for the Nation: U.S. Geological Survey National Water Information System, accessed May 15, 2023, at https://doi.org/10.5066/F7P55KJN.
Weston, D.P., Asbell, A.M., Lesmeister, S.A., Teh, S.J., and Lydy, M.J., 2014, Urban and agricultural pesticide inputs to a critical habitat for the threatened delta smelt (Hypomesus transpacificus): Environmental Toxicology and Chemistry, v. 33, no. 4, p. 920–929, accessed June 17, 2022, at https://setac.onlinelibrary.wiley.com/doi/10.1002/etc.2512.
Conversion Factors
International System of Units to U.S. customary units
Temperature in degrees Celsius (°C) may be converted to degrees Fahrenheit (°F) as follows:
°F = (1.8 × °C) + 32.
Supplemental Information
Specific conductance is given in microsiemens per centimeter at 25 degrees Celsius (µS/cm at 25 °C).
Concentrations of chemical constituents in water are given in either milligrams per liter (mg/L) or nanograms per liter (ng/L). One milligram per liter is equivalent to 1 part per million (ppm); 1 nanogram per liter is equivalent to 1 part per trillion (ppt). Concentrations of pesticide compounds in suspended sediments filtered from 1-liter water samples are provided in ng/L to facilitate the approximation of a whole-water concentration by summing the dissolved and suspended-sediment concentrations of pesticide compounds. Constituents of recovery surrogates are in concentrations of 1 nanogram per microliter; 1 nanogram per microliter is equivalent to 1 part per million (ppm). Samples are pumped from the liquid chromatography tandem mass spectrometry (LC/MS/MS) pump into the high-performance liquid chromatography column at a rate of 0.6 milliliters per minute (mL/min). The temperature in the oven of the Trace 1310 gas chromatograph is increased at a rate of 25 degrees Celsius per minute (°C/min) until a temperature of 150 degrees Celsius is achieved.
For more information concerning the research in this report, contact the
Director, California Water Science Center
U.S. Geological Survey
6000 J Street, Placer Hall
Sacramento, California 95819
https://www.usgs.gov/centers/california-water-science-center
Publishing support provided by the Science Publishing Network,
Sacramento Publishing Service Center
Disclaimers
Any use of trade, firm, or product names is for descriptive purposes only and does not imply endorsement by the U.S. Government.
Although this information product, for the most part, is in the public domain, it also may contain copyrighted materials as noted in the text. Permission to reproduce copyrighted items must be secured from the copyright owner.
Suggested Citation
Uychutin, M., Orlando, J.L., Hladik, M.L., Sanders, C.J., Gross, M.S., De Parsia, M.D., LaBarbera, E.M., Twardochleb, L., and Davis, B.E., 2024, Pesticide concentrations of surface water and suspended sediment in Yolo By-Pass and Cache Slough Complex, California, 2019–2021: U.S. Geological Survey Data Report 1195, 24 p., https://doi.org/10.3133/dr1195.
ISSN: 2771-9448 (online)
Study Area
| Publication type | Report |
|---|---|
| Publication Subtype | USGS Numbered Series |
| Title | Pesticide concentrations of surface water and suspended sediment in Yolo By-Pass and Cache Slough Complex, California, 2019–2021 |
| Series title | Data Report |
| Series number | 1195 |
| DOI | 10.3133/dr1195 |
| Publication Date | July 09, 2024 |
| Year Published | 2024 |
| Language | English |
| Publisher | U.S. Geological Survey |
| Publisher location | Reston, VA |
| Contributing office(s) | California Water Science Center |
| Description | v, 24 p. |
| Country | United States |
| State | California |
| Other Geospatial | Yolo By-Pass and Cache Slough Complex |
| Online Only (Y/N) | Y |