

Distribution, Abundance, and Habitat Characteristics of Coastal Cactus Wrens (Campylorhynchus brunneicapillus) in San Diego County, California—2023 Data Summary
Links
- Document: Report (2.5 MB pdf) , HTML , XML
- Data Release: USGS Data Release - Surveys and monitoring of Coastal Cactus Wren in southern San Deigo County (ver. 4.0, February 2024)
- Download citation as: RIS | Dublin Core
Acknowledgments
This study was funded by the San Diego Association of Governments.
We thank the biologists who assisted in data collection for this project: Lisa Allen, Annabelle Bernabe, Ynez Diaz, Alexandra Houston, Scarlett Howell, and Shannon Mendia of the U.S. Geological Survey. We also thank the land managers, property owners, and other stakeholders who facilitated access to the survey plots.
Executive Summary
We surveyed for coastal Cactus Wren (Campylorhynchus brunneicapillus) in 507 established plots in San Diego County in 2023, encompassing 4 genetic clusters (Otay, Lake Jennings, Sweetwater/Encanto, and San Pasqual). Two surveys were completed at each plot between March 1 and July 31. Cactus Wrens were detected in 181 plots (36 percent of plots). Cactus Wrens were detected in 26 percent of plots that have been consistently surveyed since 2020, indicating lower plot occupancy than in 2022 (31 percent), 2021 (34 percent), and 2020 (35 percent). There were 158 Cactus Wren territories detected across all survey plots in 2023. In plots that have been consistently surveyed since 2020, we documented 85 territories, which is a decrease from 94 territories in 2022, 113 territories in 2021, and 109 territories in 2020. The number of territories declined from 2022 to 2023 in the Lake Jennings, Sweetwater/Encanto, and San Pasqual genetic clusters but remained virtually the same in the Otay genetic cluster. At least 80 percent of Cactus Wren territories were occupied by pairs, and 125 fledglings were observed in 2023.
We observed 14 banded Cactus Wrens in 2023, 9 of which we could identify individually by color band combination. Adults of known age ranged from 4 to 7 years old. All individually identifiable adult Cactus Wrens occupied the same territory in 2023 that they occupied in 2022, and we detected no movement of banded Cactus Wrens between genetic clusters.
Vegetation at Cactus Wren survey plots was dominated by coastal sage scrub shrubs, such as California sagebrush (Artemisia californica), California buckwheat (Eriogonum fasciculatum), lemonade berry (Rhus integrifolia), jojoba (Simmondsia chinensis), and San Diego viguiera (Bahiopsis laciniata). No definitive signs of fungal pathogens were observed on cactus within and around survey plots. Blue elderberry (Sambucus mexicana) was detected at 41 percent of plots, and Cactus Wrens occupied proportionally more plots with elderberry than plots without elderberry. Very little dead or unhealthy cactus was observed within all survey plots, and Cactus Wren occupancy did not differ between plots with high or low amounts of dead or unhealthy cactus. Almost 90 percent of plots had more than 5 percent of cactus crowded or overtopped by vines and shrubs, and Cactus Wren occupancy did not differ between plots with high or low amounts of cactus crowded or overtopped by vines and shrubs. Non-native annual cover was more prevalent in survey plots in 2023 than in 2022. Cactus Wrens did not select or avoid plots with more non-native cover.
Introduction
The coastal Cactus Wren (Campylorhynchus brunneicapillus, also referred to as wren in this report) is a fragmentation-sensitive resident species in southern California that requires thickets of cholla (Cylindropuntia spp.) or prickly pear cactus (Opuntia spp.) for nesting. Limited naturally by the patchy distribution of this habitat, wren populations have become further fragmented in recent decades by urbanization, habitat degradation, and stochastic events, such as wildfire (Solek and Szijj, 2004; Hamilton and others, 2020). As a result, wren populations have been diminished in size and distribution and occur largely as islands in a matrix of generally unsuitable habitat.
Among the possible consequences of habitat fragmentation on wren viability is genetic isolation, which can lead to loss of genetic variability and ability to adapt to changing environments (Barr and others, 2015). Although wrens, like other birds, are mobile and can presumably fly long distances between patches (Barr and others 2012, 2013; Preston and Kamada, 2012; Kamada and Preston, 2013), movement of wrens between habitat patches in southern California seems to be rare (Lynn and others, 2022). Juvenile dispersal, whereby young birds leave their natal territories and establish breeding territories of their own, is the primary process by which genetic connectivity is achieved. Few juveniles have been documented dispersing among cactus sites in San Diego County (Lynn and others, 2022).
In addition to isolation, population declines in part of the range have raised concerns regarding the capacity for long-term persistence of wrens in San Diego County. Coastal Cactus Wren populations have declined in southern California during the last 3 decades (Preston and Kamada, 2012); however, in San Diego County, particularly steep declines have been documented in the southern part of the county near Otay Valley. Wren territories on conserved lands in this region, which numbered 53 in 1992, declined to 14 in 2014 (The Nature Conservancy and San Diego Management and Monitoring Program, 2015). Although the wren population in Otay Valley increased to 43 territories by 2021 (Lynn and Kus, 2022), this population decreased to 36 territories in 2022 (Lynn and Kus, 2023) and remains below the minimum effective population size of 50–100 individuals needed to prevent inbreeding depression (Frankham and others, 2014; Vandergast and others, 2022).
Although associated with long-term declines, neither fire nor development seem to be the primary factor responsible for the more recent and localized Otay wren population decline. Recent multiple years of drought could have affected wren abundance by reducing arthropod food resources, which could lower fecundity and survival (Preston and Kamada, 2012; Lynn and others, 2022). Annual precipitation has been less than 75 percent (less than 18.0 centimeters [cm]) of the 1920–2023 average (24.0 cm) in half of the last 23 years (2000–23); precipitation was less than 50 percent (less than 12.0 cm) of average in 7 of those years (5 years between 2000 and 2010; 2 years between 2011 and 2022; National Centers for Environmental Information, 2023). In 2014, an extreme drought year, productivity was exceptionally low, with only 3 fledglings observed during surveys of a population occupying 14 territories in the Otay region (The Nature Conservancy and San Diego Management and Monitoring Program, 2015). Between 2015 and 2019, when the Cactus Wren population in the Otay region was monitored more intensely, the number of fledglings per pair was lowest in 2018, which was another extreme drought year (Lynn and others, 2022). In 2022, a less extreme drought year, more fledglings (33) were observed during surveys at 36 territories in the Otay region (Lynn and Kus, 2023).
Cactus Wrens are restricted to cactus scrub habitat, which is a rare vegetation community in San Diego County. Cactus scrub habitat is vulnerable to degradation by invasion of non-native annual plants and grasses and is slow to recover from wildfire (Mitrovich and Hamilton, 2007; Hamilton, 2009). Dense non-native annual plants and grass within cactus scrub likely reduce the suitability of these areas for wrens, which primarily glean arthropod prey from bare ground and litter at the base of cactus and shrubs (Lynn and others, 2022).
It has been suggested by researchers that blue elderberry (Sambucus mexicana; also referred to as elderberry in this report) is an important resource for Cactus Wrens. Elderberry was observed in many wren territories in Orange County, and researchers there suggested that it provided territorial advertising perches for adults, escape cover for fledglings, a food source from berries, and also could be an important host for prey arthropods (K. Preston, U.S. Geological Survey, oral commun., 2015; Hamilton and others, 2020). This pattern occurred in San Diego County as well, where wrens were more likely to occupy plots with elderberry than plots without elderberry (Lynn and Kus, 2021, 2022, 2023; Winchell and others, 2021). Arthropod abundance also was higher in elderberry than in other species in cactus scrub habitat in southern San Diego County (Lynn and others, 2022).
The Cactus Wren was selected as one of several indicator species by the San Diego Management and Monitoring Program to evaluate the state of the regional preserve system in San Diego County (Preston and others, 2022). The wren serves as an indicator for cactus scrub, a rare vegetation community, and is also a species of very high conservation priority within the regional preserve system. The goals of the 2023 Cactus Wren effort were to perform surveys to assess the population status and to provide data to address two metrics used to evaluate the condition of the population in western San Diego County. Metrics for evaluating the overall status of the species include the proportion of cactus plots occupied by wrens and the quality of the cactus habitat. In addition, we collected data to better understand demographics within the wren population in western San Diego County, including resighting banded birds to determine age and movement of individuals, determining breeding status of wrens by observing paired behavior and documenting active nests and fledglings observed during surveys, and summarizing habitat attributes in occupied and unoccupied cactus wren survey plots. Data presented in this report can be found in a data release (Kus and Lynn, 2022 at https://doi.org/10.5066/F76H4FK5). This report is the annual update to surveys that have been performed since 2015 (2015 and 2017–22; Lynn and Kus, 2021, 2022, 2023; Kus and Lynn, 2022; Lynn and others, 2022). The study background, objectives, and methods were originally presented in Lynn and Kus (2021) and are updated in this report.
Study Area and Methods
Survey plots were established throughout San Diego County by the U.S. Fish and Wildlife Service in 2011. We selected a subset of these plots that included four genetic clusters: (1) Otay, (2) Lake Jennings (also called “San Diego” genetic cluster in the data release [Kus and Lynn, 2022]), (3) Sweetwater/Encanto, and (4) San Pasqual (Barr and others, 2015; fig. 1). Plots in the Otay, Lake Jennings, and Sweetwater/Encanto genetic clusters were surveyed initially in 2015 and have been surveyed annually from 2017 to 2023. Plots in the San Pasqual genetic cluster were surveyed in 2019, 2022, and 2023. In 2022 and 2023, we surveyed 18 new plots in the northern part of the Lake Jennings genetic cluster to potentially detect northward movement of wrens.
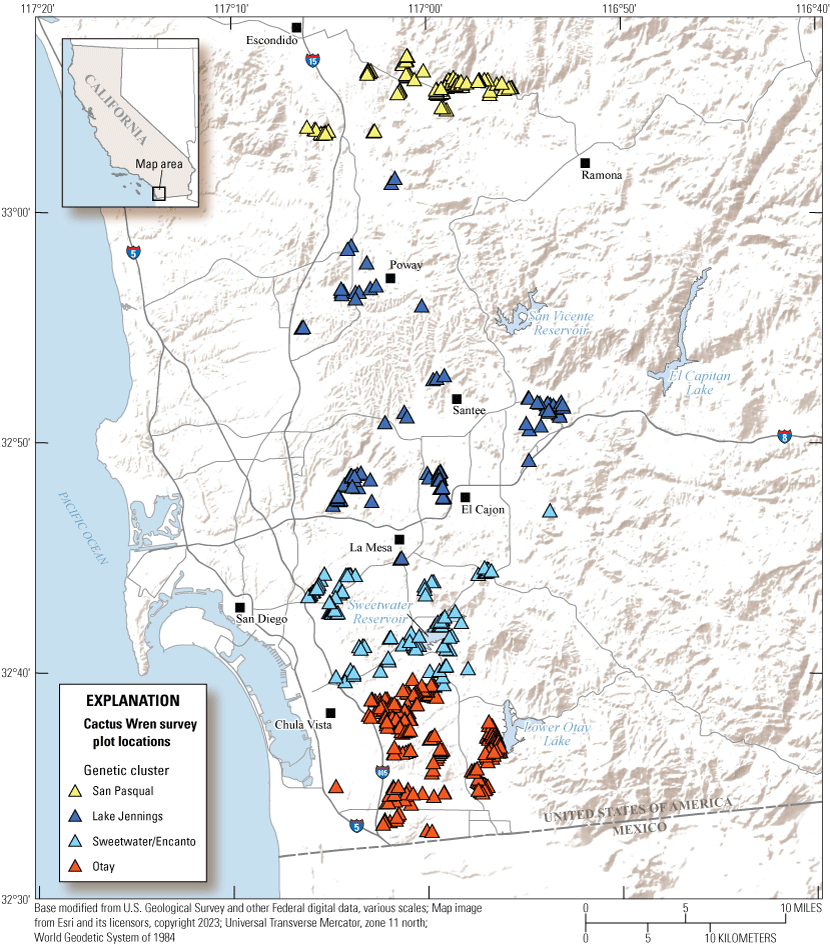
Cactus Wren survey plot locations by genetic cluster in San Diego County, California, 2023.
Each survey plot was visited twice during a survey year: once between March 1 and May 31 and once between June 1 and July 31. Upon arrival, plots were scanned for wrens and wren nests and if wrens were not immediately detected, a wren song was broadcasted for 15–30 seconds to elicit a response. If wrens were not detected, plots were then carefully traversed for up to 20 minutes, looking for wrens or wren nests and periodically broadcasting the wren song. In addition to recording presence or absence of wrens, observers attempted to count all wrens within the plot, determine their age, resight leg bands to record unique colored leg band combinations from birds banded in previous studies (Lynn and others, 2022), and record the presence of active nests. A Global Positioning System point (World Geographic System of 1984) was collected where wren and wren nests were located.
Cactus Wren territories often included all or parts of multiple survey plots; therefore, occupancy of survey plots alone likely overestimated the actual number of wrens in the survey areas. To arrive at a more standard population count, surveyors observed the behavior of wrens during surveys to determine the actual number of wrens using a block of survey plots. Population parameters, including number of wrens, age, breeding status (whether or not the wrens were paired), evidence of breeding (nests or fledglings observed), and color-band status were compiled by territory rather than by survey plot. Because Cactus Wrens do not show obvious sex- or age-distinguishing characteristics when observed under normal field conditions, sex and age typically were determined by specific behavioral cues or morphology when captured during previous years. Sex-related behavioral cues include position during copulation or incubation (females only). When in the hand, sex can be determined by the presence of a brood patch (females only) or cloacal protuberance (males only). If no sex-related behavioral cues were observed, we assigned an adult as “male” if it sang or called more frequently or was more visually obvious (potentially advertising territory boundaries), although females also can exhibit these behaviors. Juvenile behavior that helped distinguish age included begging from adults, rudimentary vocalizations, and sibling group behavior. Young juveniles had shorter bills and tails and a more diffuse throat patch than adults and generally appeared bright and clean compared to adults with worn and brownish plumage.
Cactus Wren Age and Movement
In 2023, we attempted to resight all wrens at survey plots to identify individuals based on color-band combinations. When bands were missing or observations were unclear, we returned on non-survey days to obtain photographs using a Canon 7D Mark II digital single lens reflex camera with a Canon 100–400 millimeters F/4.5–5.6 zoom lens. Photographs were useful in determining fine color differences (faded bands) or reading numbers on metal bands. Color-band resighting data were used to determine age and document movement from banding sites.
Vegetation Characteristics
General vegetation type (Holland, 1986, modified by Sawyer and others, 2009) for each plot was assigned by overlaying San Diego vegetation type maps (Landrum, 2018) and survey plots in ArcMAP (Environmental Systems Research Institute, 2020). The dominant general vegetation type for each plot was selected based on the maximum area of that vegetation type mapped within the plot. When the mapped general vegetation type was inaccurate based on examination of aerial photos (mapping polygons lacked precision or vegetation had changed post-mapping), surveyors selected the most appropriate general vegetation type as determined on the ground during surveys. Much of the vegetation in the map published by Landrum (2018) was classified into coarse hierarchical levels so we grouped finer scale vegetation types from ground surveys into the coarser classification levels of Landrum (2018). Final classification levels were (1) scrub, containing Diegan coastal sage scrub and maritime succulent scrub; (2) chaparral, containing southern mixed chaparral; (3) valley and foothill grassland, containing non-native grassland; (4) disturbed habitat; and (5) urban/developed. Surveyors also looked for signs of fungal pathogens on cactus (for example, Fusarium brachygibbosum and Cladosporium cladosporioides). During the first of the two annual surveys, observers noted habitat characteristics at each plot. These data included (1) dominant or co-dominant tree or shrub species, (2) presence or absence of elderberry, (3) the percentage of cactus that was dead, (4) the percentage of cactus that was unhealthy, (5) the percentage of cactus overtopped or crowded by vines or shrubs, and (6) the percentage of the plot that was covered by non-native annual plant species. Vegetation characteristics (numbers 3‒6) were visually estimated by the surveyor and assigned to one of seven categories: (1) 0-percent cover, (2) greater than 0 but less than 1-percent cover, (3) 1‒5-percent cover, (4) greater than 5 percent and up to 25-percent cover, (5) greater than 25 percent and up to 50-percent cover, (6) greater than 50 percent and up to 75-percent cover, and (7) greater than 75-percent cover.
After examining the distribution of percentage cover for each of the vegetation characteristics, we lumped together category numbers 1‒3 (0‒5-percent cover) and category numbers 4‒7 (greater than 5-percent cover). We used chi-square analyses to determine if wrens were detected in different proportions between plots with 0‒5 percent cover or greater than 5-percent cover of each vegetation characteristic. We also used chi-square analyses to determine if wrens occupied the same proportion of plots that contained elderberry as those that did not contain elderberry. Given the sensitive status of coastal Cactus Wrens, we assigned statistical significance as P≤0.10 to avoid overlooking potentially meaningful relationships relevant to management of the species in San Diego County.
Results
We surveyed 507 plots for Cactus Wrens in 2023 (table 1). Wrens were detected at 36 percent of all plots (181/507), 19 percent of Otay plots (39/209), 22 percent of Lake Jennings plots (19/87), 41 percent of Sweetwater/Encanto plots (41/100), and 74 percent of San Pasqual plots (82/111; table 1). We observed 158 wren territories throughout all survey plots (table 2). We determined that wrens in 126 territories (80 percent) were paired and we could not determine the breeding status of birds in the remaining 32 territories. We detected active brood nests or fledglings at 77 territories, and we observed 125 fledglings during the surveys.
Table 1.
Number of plots surveyed and number occupied by Cactus Wrens by genetic cluster.[Survey 1, April 1 through May 31, 2023; Survey 2, June 1 through July 31, 2023]
Cactus Wren Age and Movement
During surveys in 2023, we were able to observe 268 adult wrens well enough to determine banding status, although not all banded wrens were observed well enough to conclusively identify the individual. Banding status was determined for 154 males (95 percent of all males) and 114 females (90 percent of all females). We detected 14 banded adult wrens in 2023 (table 3). Two males and three females could not be identified because resights were inconclusive. Three wrens were missing at least one color band, and two wrens had been banded with only a single silver federal band and were not recaptured to read the band number to identify the individual. Therefore, we were able to identify nine wrens with unique color-band combinations in 2023. Three of the females with missing bands continued to occupy the same territories that they occupied in 2022; hence, we included them in movement summaries. Adult birds ranged from 4 to 7 years old.
Table 3.
Age, location, and number of banded Cactus Wrens by genetic cluster in 2023.[yrs, years; —, none; ≥, greater than or equal to]
Resighting banded birds allowed us to identify individuals that either remained in the same territory they used in the previous year or moved to a different location. We identified 10 adults (6 males and 4 females) at territories in 2022 that were detected again in 2023. All 10 of these birds remained in the same breeding territory in 2023 that they occupied in 2022 (within 100 meters). We did not detect adult movement between genetic clusters from 2022 to 2023.
Vegetation Characteristics
Vegetation characteristics were recorded at all 507 Cactus Wren survey plots in 2023. The prevalent general vegetation type was scrub (table 4), most of which was Diegan coastal sage scrub. Valley and foothill grassland was dominant at 7 percent of plots. Land cover heavily affected by human presence (disturbed habitat and urban/developed) predominated at 3 percent of survey plots. Chaparral dominated 2 percent or fewer of survey plots.
Table 4.
Dominant vegetation cover types at Cactus Wren survey plots, San Diego County, California, 2023.[Vegetation cover type codes developed by Holland (1986) and modified by Sawyer and others (2009). Proportion of plots of that vegetation type within the cluster are in parentheses. Abbreviations: —, not present; <, less than]
Common coastal sage scrub species were the dominant shrub species at most of the plots, including California sagebrush (Artemisia californica), California buckwheat (Eriogonum fasciculatum), lemonade berry (Rhus integrifolia), San Diego viguiera (Bahiopsis laciniata), and jojoba (Simmondsia chinensis; table 5). No definitive signs of fungal pathogens were observed on cactus within and around survey plots.
Table 5.
Shrub species that were dominant or co-dominant at Cactus Wren survey plots in 2023, San Diego County, California.[Proportion of plots containing that plant species within the genetic cluster are in parentheses. A plot may have more than one co-dominant plant species so proportions do not add to 1. Abbreviations: —, not present; <, less than]
Data on elderberry presence were collected at 504 of the 507 survey plots. Of the 504 plots, 209 (41 percent) contained elderberry. Wrens occupied a significantly higher proportion of plots that contained elderberry (56 percent; 117/209) than plots that did not contain elderberry (21 percent; 63/295; chi-square=63.9, P<0.01).
At most of the wren survey plots (92 percent) in 2023, 5 percent or less of cactus was dead (table 6). Between 5 and 25 percent of cactus was dead in 6 percent of plots, and more than 25 percent of cactus was dead in 2 percent of plots. There was no difference in wren occupancy of plots with 5 percent or less dead cactus (35 percent; 162/466) than plots with more than 5 percent dead cactus (48 percent; 19/40; chi-square=2.6, P=0.11; fig. 2).
Table 6.
Proportion of cactus that was dead at Cactus Wren survey plots in 2023, San Diego County, California.[<, less than; >, greater than]
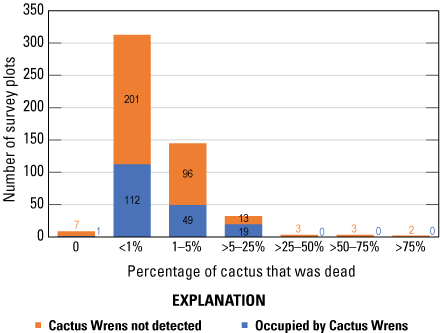
Number of survey plots that were occupied by Cactus Wrens by the percentage of cactus present that was dead, San Diego County, California, 2023. Abbreviations: <, less than; %, percent; >, greater than.
At most of the wren plots (88 percent), 5 percent or less of cactus showed signs of stress (table 7). Between 5 and 25 percent of cactus was unhealthy at 11 percent of plots. One percent of the plots contained more than 25 percent of cactus that was unhealthy. There was no significant difference in wren occupancy of plots with 5 percent or less unhealthy cactus (35 percent; 155/444) than plots with more than 5 percent unhealthy cactus (43 percent; 26/61; chi-square=1.4, P=0.24; fig. 3).
Table 7.
Proportion of cactus that was unhealthy at Cactus Wren survey plots in 2023, San Diego County, California.[<, less than; >, greater than]
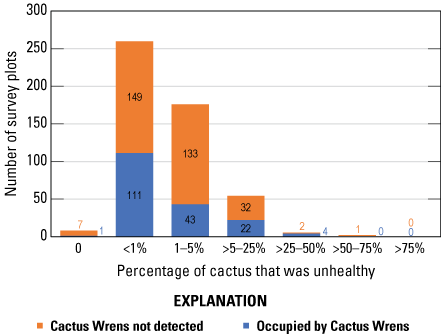
Number of survey plots that were occupied by Cactus Wrens by the percentage of cactus present that was unhealthy, San Diego County, California, 2023. Abbreviations: <, less than; %, percent; >, greater than.
Shrubs and vines crowded or overtopped 5 percent or less of cactus at 12 percent of plots (table 8). Between 5 and 25 percent of cactus was overtopped by shrubs and vines at 27 percent of plots. At 61 percent of plots, shrubs and vines crowded or overtopped at least 25 percent of cactus. There was no significant difference in wren occupancy of plots with 5 percent or less cactus that was overtopped by shrubs and vines (42 percent; 25/60) and plots with more than 5 percent overtopped cactus (35 percent; 155/444; chi-square=1.1, P=0.31; fig. 4).
Table 8.
Proportion of cactus that was crowded or overtopped by shrubs and vines at Cactus Wren survey plots in 2023, San Diego County, California.[<, less than; >, greater than]
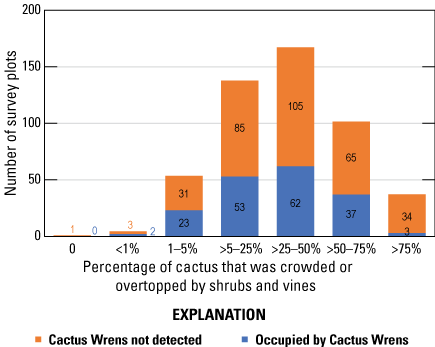
Number of survey plots that were occupied by Cactus Wrens by the percentage of cactus present that was crowded or overtopped by shrubs or vines, San Diego County, California, 2023. Abbreviations: < less than; %, percent; >, greater than.
Non-native annual grasses and forbs covered 5 percent or less of the wren survey plots at 18 percent of plots (table 9). Between 5 and 25 percent of the plot was covered by non-native annual grasses and forbs at 43 percent of plots. There was more than 25-percent non-native annual cover at 40 percent of the plots. There was no significant difference in wren occupancy of plots with 5 percent or less non-native annual cover (42 percent; 38/90) than plots with greater than 5-percent non-native cover (34 percent; 143/417; chi-square=2.0, P=0.15; fig. 5).
Table 9.
Proportion of non-native annual cover at Cactus Wren survey plots in 2023, San Diego County, California.[<, less than; >, greater than]
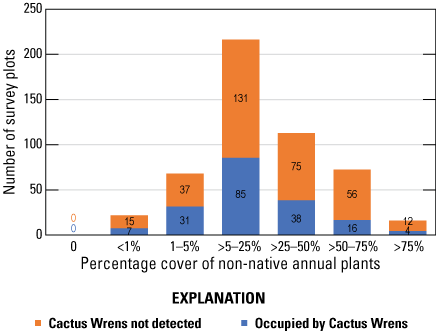
Number of survey plots that were occupied by Cactus Wrens by the percentage cover of non-native annual plants, San Diego County, California, 2023. Abbreviations: <, less than; %, percent; >, greater than.
Summary
Cactus Wrens were detected in 36 percent of all survey plots in 2023, a decrease from the 42 percent of plots that were occupied in 2022. Excluding plots that were not surveyed in 2020 and 2021 (San Pasqual genetic cluster and other plots that were not surveyed consistently), 26 percent of plots were occupied in 2023, a drop from 31 percent occupied in 2022, 35 percent occupied in 2021, and 35 percent of plots occupied in 2020 (Lynn and Kus, 2021, 2022, 2023). The number of wren territories in plots that were surveyed consistently from 2020 through 2023 decreased 10 percent from 2022 to 2023 (from 94 to 85 territories, respectively), following a decrease of 17 percent from 2021 to 2022, and a 4 percent increase from 2020 to 2021. The decrease in number of territories from 2022 to 2023 occurred in 3 of the 4 genetic clusters. Cactus Wren territories increased in the Otay genetic cluster by 6 percent and decreased in Lake Jennings, Sweetwater/Encanto, and San Pasqual by 30 percent, 13 percent, and 31 percent, respectively.
We did not detect any movement of wrens between genetic clusters from 2022 to 2023. We have not detected movement of wrens between genetic clusters since 2020.
Although most of the wren plots did not contain elderberry, wrens were more likely to occupy plots with elderberry than plots without elderberry in our study area, which is consistent with occupancy and elderberry-containing plots in 2020, 2021, and 2022. Wren habitat mostly was characterized by typical coastal sage scrub plant species but with a strong component of taller woody shrubs, such as lemonade berry and laurel sumac. The cactus in most survey plots was healthy and, unlike in 2020, 2021, and 2022, wrens did not preferentially select survey plots with less dead cactus. At 88 percent of survey plots, more than 5 percent of cactus was crowded or overtopped by vines and shrubs; however, unlike in 2020 and 2022, but like in 2021, wrens did not preferentially select plots with less shrub and vine crowding and overtopping. Non-native annual cover was more prevalent in survey plots in 2023 than in 2022 (82 percent versus 52 percent of plots with more than 5 percent annual cover, respectively), and once again, wrens did not preferentially occupy survey plots with less non-native annual cover in 2023.
References Cited
Barr, K.R., Vandergast, A.G., and Kus, B.E., 2012, Genetic connectivity in the Coastal Cactus Wren: U.S. Geological Survey Data Summary report prepared for the San Diego Management and Monitoring Program, 30 p., accessed September 1, 2023, at https://sdmmp.com/download.php?cid=CiteID_1603251358357780.
Barr, K.R., Vandergast, A.G., and Kus, B.E., 2013, Genetic structure in the Cactus Wren in coastal southern California: U.S. Geological Survey Data Summary report prepared for the California Department of Fish and Wildlife, 27 p., accessed October 13, 2023, at nrm.dfg.ca.gov/FileHandler.ashx?DocumentID=65007.
Barr, K.R., Kus, B.E., Preston, K.L., Howell, S., Perkins, E., and Vandergast, A.G., 2015, Habitat fragmentation in coastal southern California disrupts genetic connectivity in the Cactus Wren (Campylorhynchus brunneicapillus): Molecular Ecology, v. 24, no. 10, p. 2349–2363, accessed October 13, 2023, at https://doi.org/10.1111/mec.13176.
Frankham, R., Bradshaw, C.J.A., and Brook, B.W., 2014, Genetics in conservation management—Revised recommendations for the 50/500 rules, Red List criteria and population viability analyses: Biological Conservation, v. 170, p. 56–63, accessed September 1, 2023, at https://doi.org/10.1016/j.biocon.2013.12.036.
Hamilton, R.A., 2009, 2008 Surveys—Cactus Wrens and California Gnatcatchers San Dieguito River Valley, San Diego County: Long Beach, Calif., prepared for the Conservation Biology Institute, 112 p., accessed September 1, 2023, at https://sdmmp.com/view_article.php?cid=CiteID_1603251358355960.
Hamilton, R.A., Proudfoot, G.A., Sherry, D.A., and Johnson, S.L., 2020, Cactus Wren (Campylorhynchus brunneicapillus) (ver. 1.0, March 4, 2020), in Poole, A.F., ed., Birds of the world: Ithaca, N.Y., Cornell Lab of Ornithology, accessed September 1, 2023, at https://doi.org/10.2173/bow.cacwre.01.
Holland, R.F., 1986, Preliminary descriptions of the terrestrial natural communities of California: Sacramento, Calif., State of California, The Resources Agency, Department of Fish and Game, 156 p., accessed October 13, 2023, at https://nrmsecure.dfg.ca.gov/FileHandler.ashx?DocumentID=75893.
Kamada, D., and Preston, K., 2013, Nature reserve of Orange County—Coastal Cactus Wren dispersal and survival surveys, genetics & parasite sampling, and arthropod foraging ecology in 2012: Annual report prepared in fulfillment of reporting requirements for the memorandum of understanding between Dana Kamada and the California Department of Fish and Wildlife, 92 p., accessed September 1, 2023, at https://sdmmp.com/upload/SDMMP_Repository/0/25hms3p4y9qxw7rv18gdkzncbft0j6.pdf.
Kus, B.E., and Lynn, S., 2022, Surveys and monitoring of Coastal Cactus Wren in southern San Diego County (ver. 4.0, February 2024): U.S. Geological Survey data release, accessed February 13, 2024, at https://doi.org/10.5066/F76H4FK5.
Landrum, P., 2018, Vegetation (County): San Diego Association of Governments/SanGIS Regional GIS Data Warehouse Open Data Portal, accessed September 1, 2023, at https://sdgis-sandag.opendata.arcgis.com/datasets/SANDAG::vegetation-county/explore?location=32.955610%2C-116.751224%2C9.54.
Lynn, S., and Kus, B.E., 2021, Distribution and demography of coastal Cactus Wrens (Campylorhynchus brunneicapillus) in southern San Diego County, California—2020 data summary: U.S. Geological Survey Data Series 1138, 12 p., accessed September 1, 2023, at https://doi.org/10.3133/ds1138.
Lynn, S., and Kus, B.E., 2022, Distribution and demography of coastal Cactus Wrens (Campylorhynchus brunneicapillus) in southern San Diego County, California—2021 data summary: U.S. Geological Survey Data Report 1159, 14 p., accessed September 1, 2023, at https://doi.org/10.3133/dr1159.
Lynn, S., and Kus, B.E., 2023, Distribution and demography of coastal Cactus Wrens (Campylorhynchus brunneicapillus) in southern San Diego County, California—2022 data summary: U.S. Geological Survey Data Report 1174, 14 p., accessed September 1, 2023, at https://doi.org/10.3133/dr1174.
Lynn, S., Houston, A., and Kus, B.E., 2022, Distribution and demography of Coastal Cactus Wrens in Southern California, 2015–19: U.S. Geological Survey Open-File Report 2022–1044, 44 p., accessed September 1, 2023, at https://doi.org/10.3133/ofr20221044.
Mitrovich, M.J., and Hamilton, R.A., 2007, Status of the Cactus Wren (Campylorhynchus brunneicapillus) within the coastal subregion of Orange County, California: Prepared for Nature Reserve of Orange County, 18 p., accessed September 1, 2023, at https://sdmmp.com/view_article.php?cid=CiteID_1603251358359050.
National Centers for Environmental Information, 2023, Global summary of the month (GSOM), version 1: National Centers for Environmental Information, National Oceanic and Atmospheric Administration, accessed August 30, 2023, at https://www.ncei.noaa.gov/access/search/data-search/global-summary-of-the-month?dataTypes=PRCP&bbox=32.718,-117.161,32.564,-117.007.
Preston, K., and Kamada, D., 2012, Nature reserve of Orange County—Monitoring Coastal Cactus Wren reproduction, dispersal, and survival, 2009–2011: San Diego, Calif., Final report prepared for California Department of Fish and Game, 92 p., accessed September 1, 2023, at https://nrm.dfg.ca.gov/FileHandler.ashx?DocumentID=46786&inline.
Preston, K.L., Perkins, E.E., Brown, C.W., McCutcheon, S.J., Bernabe, A.E., Luciani, E., Kus, B.E., and Wynn, S., 2022, State of the regional preserve system in western San Diego County: San Diego, Calif., Report prepared for the San Diego Association of Governments Environmental Mitigation Program by the U.S. Geological Survey, 425 p. + an appendix, accessed September 1, 2023, at https://www.sdmmp.com/view_article.php?cid=SDMMP_CID_71_63979fd98137e#.
Sawyer, J.O., Keeler-Wolf, T., and Evens, J.M., 2009, A manual of California vegetation (2d ed.): Sacramento, Calif., California Native Plant Society, 1300 p., accessed October 19, 2023, at https://vegetation.cnps.org/.
Solek, C., and Szijj, L.J., 2004, Cactus Wren (Campylorhynchus brunneicapillus), in Szijj, L.J., ed., The coastal shrub and chaparral bird conservation plan—A strategy for protecting and managing coastal scrub and chaparral habitats and associated birds in California: Berkeley, Calif., California Partners in Flight, accessed October 13, 2023, at https://sdmmp.com/view_article.php?cid=SDMMP_CID_230_5efa5152de1df.
The Nature Conservancy and San Diego Management and Monitoring Program, 2015, South San Diego County Coastal Cactus Wren (Campylorhynchus brunneicapillus) habitat conservation and management plan: The Nature Conservancy and San Diego Management and Monitoring Program, prepared for the San Diego Association of Governments, 37 p. + appendixes, accessed September 1, 2023, at https://sdmmp.com/upload/projects/20160330_2357_194.pdf.
Vandergast, A.G., Kus, B.E., Smith, J.G., and Mitelberg, A., 2022, Recent declines in genetic diversity with limited dispersal among coastal Cactus Wren populations in San Diego County, California: Conservation Science and Practice, v. 4, no. 9, article no. 12780, p. 1–16, accessed October 13, 2023, at https://doi.org/10.1111/csp2.12780.
Winchell, C.S., Huyvaert, K.P., Doherty, P.F., Taylor, J.M., and Grant, T.J., 2021, Ecological correlates to habitat use in the Cactus Wren (Campylorhynchus brunneicapillus): The Wilson Journal of Ornithology, v. 133, no. 3, p. 408–416, accessed October 19, 2023, at https://meridian.allenpress.com/wjo/article/133/3/408/477359/Ecological-correlates-to-habitat-use-in-the-Cactus. https://www.researchgate.net/publication/359418075_Ecological_correlates_to_habitat_use_in_the_Cactus_Wren_Campylorhynchus_brunneicapillus.
Datum
Horizontal coordinate information is referenced to the World Geographic System of 1984 (WGS 84).
For more information concerning the research in this report, contact the
Director, Western Ecological Research Center
U.S. Geological Survey
3020 State University Drive East
Sacramento, California 95819
https://www.usgs.gov/centers/werc
Publishing support provided by the Science Publishing Network,
Sacramento Publishing Service Center
Disclaimers
Any use of trade, firm, or product names is for descriptive purposes only and does not imply endorsement by the U.S. Government.
Although this information product, for the most part, is in the public domain, it also may contain copyrighted materials as noted in the text. Permission to reproduce copyrighted items must be secured from the copyright owner.
Suggested Citation
Lynn, S., and Kus, B.E., 2024, Distribution, abundance, and habitat characteristics of Coastal Cactus Wrens (Campylorhynchus brunneicapillus) in San Diego County, California—2023 data summary: U.S. Geological Survey Data Report 1196, 14 p., https://doi.org/10.3133/dr1196.
ISSN: 2771-9448 (online)
Study Area
| Publication type | Report |
|---|---|
| Publication Subtype | USGS Numbered Series |
| Title | Distribution, abundance, and habitat characteristics of Coastal Cactus Wrens (Campylorhynchus brunneicapillus) in San Diego County, California—2023 Data Summary |
| Series title | Data Report |
| Series number | 1196 |
| DOI | 10.3133/dr1196 |
| Publication Date | June 18, 2024 |
| Year Published | 2024 |
| Language | English |
| Publisher | U.S. Geological Survey |
| Publisher location | Reston, VA |
| Contributing office(s) | Western Ecological Research Center |
| Description | Report: vi, 14 p.; Data Release |
| Country | United States |
| State | California |
| County | San Diego County |
| Online Only (Y/N) | Y |