Hydrodynamic Model of the Colorado River, Glen Canyon Dam to Lees Ferry in Glen Canyon National Recreation Area, Arizona
Links
- Document: Report (2.6 MB pdf) , HTML , XML
- Data Release: USGS Data Release - Hydrodynamic model of the Colorado River, Glen Canyon Dam to Lees Ferry in Glen Canyon National Recreation Area, Arizona—Tables of model results and accuracy assessment
- NGMDB Index Page: National Geologic Map Database Index Page (html)
- Download citation as: RIS | Dublin Core
Acknowledgments
Funding support for this work was provided to the Bureau of Reclamation through the Glen Canyon Dam Adaptive Management Program.
Abstract
The U.S. Geological Survey constructed a two-dimensional hydrodynamic model that was applied to a 15.8-mile tailwater reach of the Colorado River in Glen Canyon that begins 0.25 mile downstream from Glen Canyon Dam and extends to Lees Ferry in Glen Canyon National Recreation Area, Arizona. The model used the Flow and Sediment Transport with Morphological Evolution of Channels (FaSTMECH) solver in the International River Interface Cooperative (iRIC) modeling interface. The model grid was developed from a full channel digital elevation model derived by combining bathymetric and topographic data collected from March 2013 to February 2016. The model was used to predict water-surface elevations, depths, depth-averaged flow velocities, and bed shear stresses for discharges ranging from 1,000 to 70,000 cubic feet per second. Modeled water-surface elevations matched well with measured values at cross sections throughout the reach, with a mean absolute error of 0.14 meter over the range of typical discharge releases from Glen Canyon Dam. The mean error on discharge, a measure of how well the model solution converged, averaged 0.6 percent and did not exceed 2 percent over the range of discharges modeled. These results indicate that model predictions of hydraulic parameters are reasonably accurate and suitable for use for a variety of purposes, such as ecological and geomorphic modeling.
Introduction
This report and the accompanying data release (Wright and others, 2024) describe the results of the application of a two-dimensional (2D) model for the 15.8-mile tailwater reach of the Colorado River in Glen Canyon that begins 0.25 mile downstream from Glen Canyon Dam and extends to Lees Ferry (fig. 1) in the Glen Canyon National Recreation Area, Arizona. The model grid was developed by the U.S. Geological Survey (USGS) from a full channel digital elevation model (DEM) derived by combining bathymetric and topographic data collected from March 2013 to February 2016 (Kaplinski and others, 2022a, b).
Numerical hydrodynamic models are a common tool used to understand and predict water and sediment movement in rivers. Various types of models have been developed that incorporate a range of simplifying assumptions to facilitate computational efficiency. The two most common types of models applied to large river systems (10s to 100s of kilometers) are one-dimensional (1D) and 2D models. 1D models are computationally efficient and useful for very long reaches, by assuming unidirectional flow in the downstream direction along the centerline of a river or channel. Because flow is assumed only in the downstream direction, channel geometry can be specified using widely spaced cross-section measurements. 2D models are more computationally intensive because they solve for flow velocities in two directions, typically downstream and cross-stream (lateral), using a grid-based approach derived from the complete channel topography. 2D models can thus simulate complex interactions of the flow with the terrain, such as flow around bends and over bars where lateral velocities can be of the same order as downstream velocities. The choice of model depends on several factors including available topographic and bathymetric data, computational resources, and the level of detail required for a particular application.
There are no perennial streams that enter the tailwater reach, and flow contributions from springs and seeps are small, so river flows throughout the reach are almost completely determined by releases from Glen Canyon Dam. Glen Canyon Dam operations and sediment trapping in the upstream reservoir have transformed the tailwater reach by scouring and narrowing the sand-bedded river into a stable gravel bed that is rarely mobilized (Grams and others, 2007). Because the boundary conditions (flow releases at Glen Canyon Dam and water-surface elevations at Lees Ferry) and channel bathymetry are well constrained, the tailwater reach is well suited for 2D hydrodynamic modeling. The results produced by the model can serve as a useful resource for researchers interested in water-surface elevations, shoreline extents, water depths, velocities, and other hydraulic characteristics across a range of discharges within the study reach.
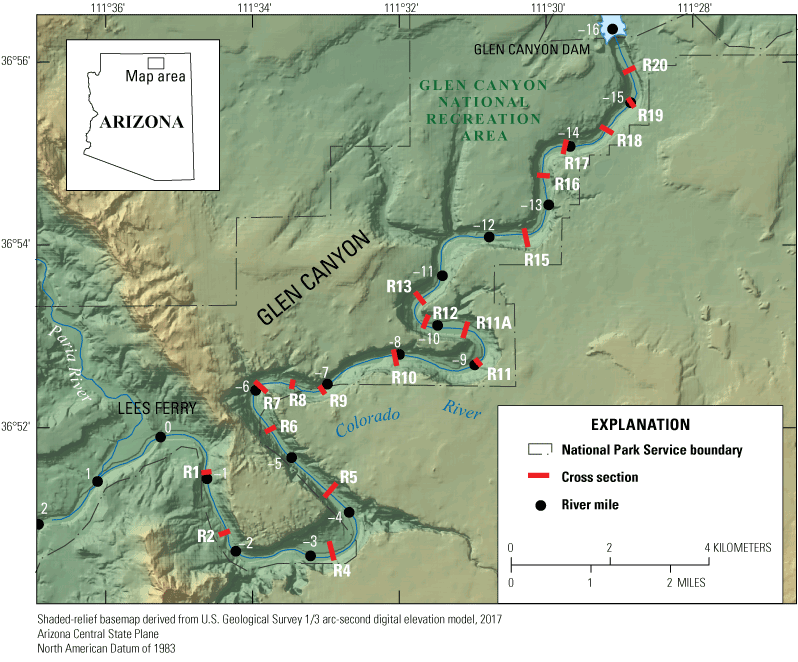
Map showing the location of the study reach within Glen Canyon National Recreation Area, Arizona. The model of the 15.8-mile tailwater reach begins 0.25 mile downstream from Glen Canyon Dam and extends to Lees Ferry. River mileage from Gushue (2019) and cross-section locations from Grams and others (2007). Shaded-relief basemap derived from 1/3 arc-second digital elevation model (U.S. Geological Survey, 2017).
Model Development
The Flow and Sediment Transport with Morphologic Evolution of Channels (FaSTMECH) solver was used for this study. FaSTMECH is a 2D hydrodynamic model contained within the International River Interface Cooperative (iRIC) streamflow modeling package (Nelson and others, 2016). The model grid was developed from a full channel DEM derived by combining bathymetric and topographic data collected from March 2013 to February 2016 (Kaplinski and others, 2022a, b). Subaqueous channel bathymetry was mapped using multibeam and single-beam echosounders; subaerial topography was mapped up to elevations higher than historical flow levels (approximately 300,000 cubic feet per second [ft3/s]) with a combination of photogrammetry from aerial photography and ground-based total-station surveys. The 1-meter (m) resolution DEM was used to map elevations to the model grid, which consisted of computational elements approximately 5×5 m in size. FaSTMECH computational grids use a curvilinear orthogonal coordinate system that follows a user-defined channel centerline. An example of the model grid is shown in figure 2.
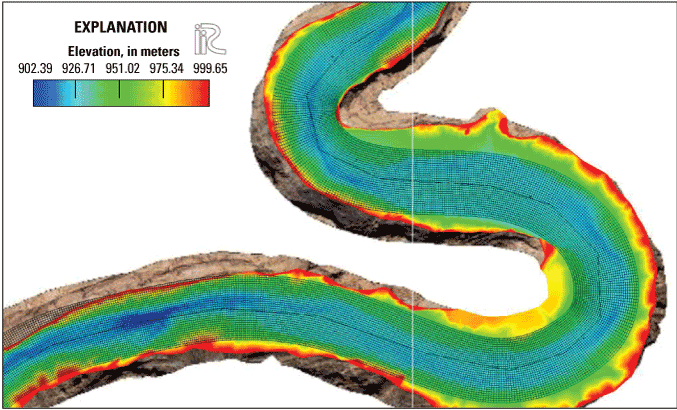
Example of the Flow and Sediment Transport with Morphologic Evolution of Channels (FaSTMECH) model grid showing a bend in the Colorado River within the study reach, Glen Canyon, Arizona. FaSTMECH is a two-dimensional hydrodynamic model contained within the International River Interface Cooperative (iRIC) streamflow modeling package (Nelson and others, 2016). The model grid was developed from a full channel digital elevation model derived by combining bathymetric and topographic data collected from March 2013 to February 2016 (Kaplinski and others, 2022a, b). Elevation in meters above NAD83 (2011) ellipsoid.
The model was run for a range of discharges ranging from 1,000 to 70,000 ft3/s. Boundary conditions for all model runs consisted of: (1) a steady discharge at the upstream boundary (0.25 mile downstream from Glen Canyon Dam) and (2) a constant water-surface elevation at the downstream boundary (Lees Ferry). The water-surface elevations at Lees Ferry for a given discharge were computed from the stage-discharge relation of the USGS Colorado River at Lees Ferry gage 09380000 (U.S. Geological Survey, 2022).
Model calibration was achieved through the specification of two parameters that influence the flow solution: (1) bed roughness and (2) lateral eddy viscosity. Bed roughness controls the relationship between depth and velocity; lateral eddy viscosity is used to specify the amount of turbulent mixing across the channel. For bed roughness, the log-law resistance formulation was used which requires specification of the bed roughness height (z0) in all grid elements. Good agreement between predicted and measured water-surface elevations (described in the “Model Accuracy” section) was achieved using z0=0.01 m and a lateral eddy viscosity equal to 0.1 meters per square second (m/s2) across the entire model domain and for all discharges. Using these parameters, the model was run for upstream discharges ranging from 1,000 to 40,000 ft3/s (in 1,000-ft3/s increments) and from 40,000 to 70,000 ft3/s (in 5,000-ft3/s increments). The results for each model run are stored in tables that list, for each grid cell, the predicted water-surface elevation, depth, bed elevation, and velocity and shear stress solutions (see Wright and others, 2024).
Model Accuracy
FaSTMECH uses an iterative solution technique that tracks convergence based on the mean error in discharge, which is a measure of how well the model has conserved water volume over the entire domain. The mean error in discharge was below 2 percent for all model runs, and below 1 percent for 39 of the 44 runs. The runs that exceeded 1 percent error were all for discharges less than 10,000 ft3/s, most likely because lower discharges include more complex flow patterns around bars along the shoreline that become completely submerged at higher discharges (in other words, at higher discharges the flow is more unidirectional).
Predicted water-surface elevations at five discharges (5,000; 10,000; 20,000; 30,000; and 45,000 ft3/s) were compared to measured water-surface elevations and elevations derived from stage-discharge relationships to evaluate the accuracy of the model. Grams and others (2007) developed stage-discharge relationships, or rating curves, at 19 historical cross sections established by the Bureau of Reclamation that span the length of study reach (fig. 1). The stage-discharge data available for Glen Canyon span a period of approximately 50 years. During this period, the elevation of the bed changed considerably, with the majority of erosion occurring immediately following dam construction in the early 1960s (Grams and others, 2007). Because the model is based on more recent terrain surveying, only water-surface elevation data from after 1983 were used to fit rating curves (stage-discharge curves) to compare with model predictions.
Comparisons between modeled and measured water-surface elevations are shown in figures 3, 4, and 5. Figure 3 presents a series of panels comparing measured points and modeled stage-discharge curves at each of the cross sections shown in figure 1. These panels indicate good agreement between the model and post-1983 measurements. Figure 4 shows modeled and measured water-surface elevation profiles for five discharges that span the typical range of releases from Glen Canyon Dam (5,000; 10,000; 20,000; 30,000; and 45,000 ft3/s), as well as the bed thalweg elevation profile. Measured water surface values for each specific discharge were derived from the rating curve (stage-discharge curve) developed for each cross section. The figure panels demonstrate that the modeled profiles track the measured profiles well over the range of discharges. Table 1 contains information on the model residuals for each of the discharges, shown as mean (signed) values, mean absolute values, and maximum absolute values. The means were computed from all cross sections over the reach (n=19) for each discharge. The mean residuals ranged from −0.03 to −0.12 m and the mean absolute residuals ranged from 0.08 to 0.18 m, indicating good agreement. Maximum absolute residuals were below 0.5 m for all cross sections for all discharges. Figure 5 shows modeled versus measured water-surface elevations from all cross sections for all five discharges, including the line of perfect agreement and the ±0.5-m error bars.
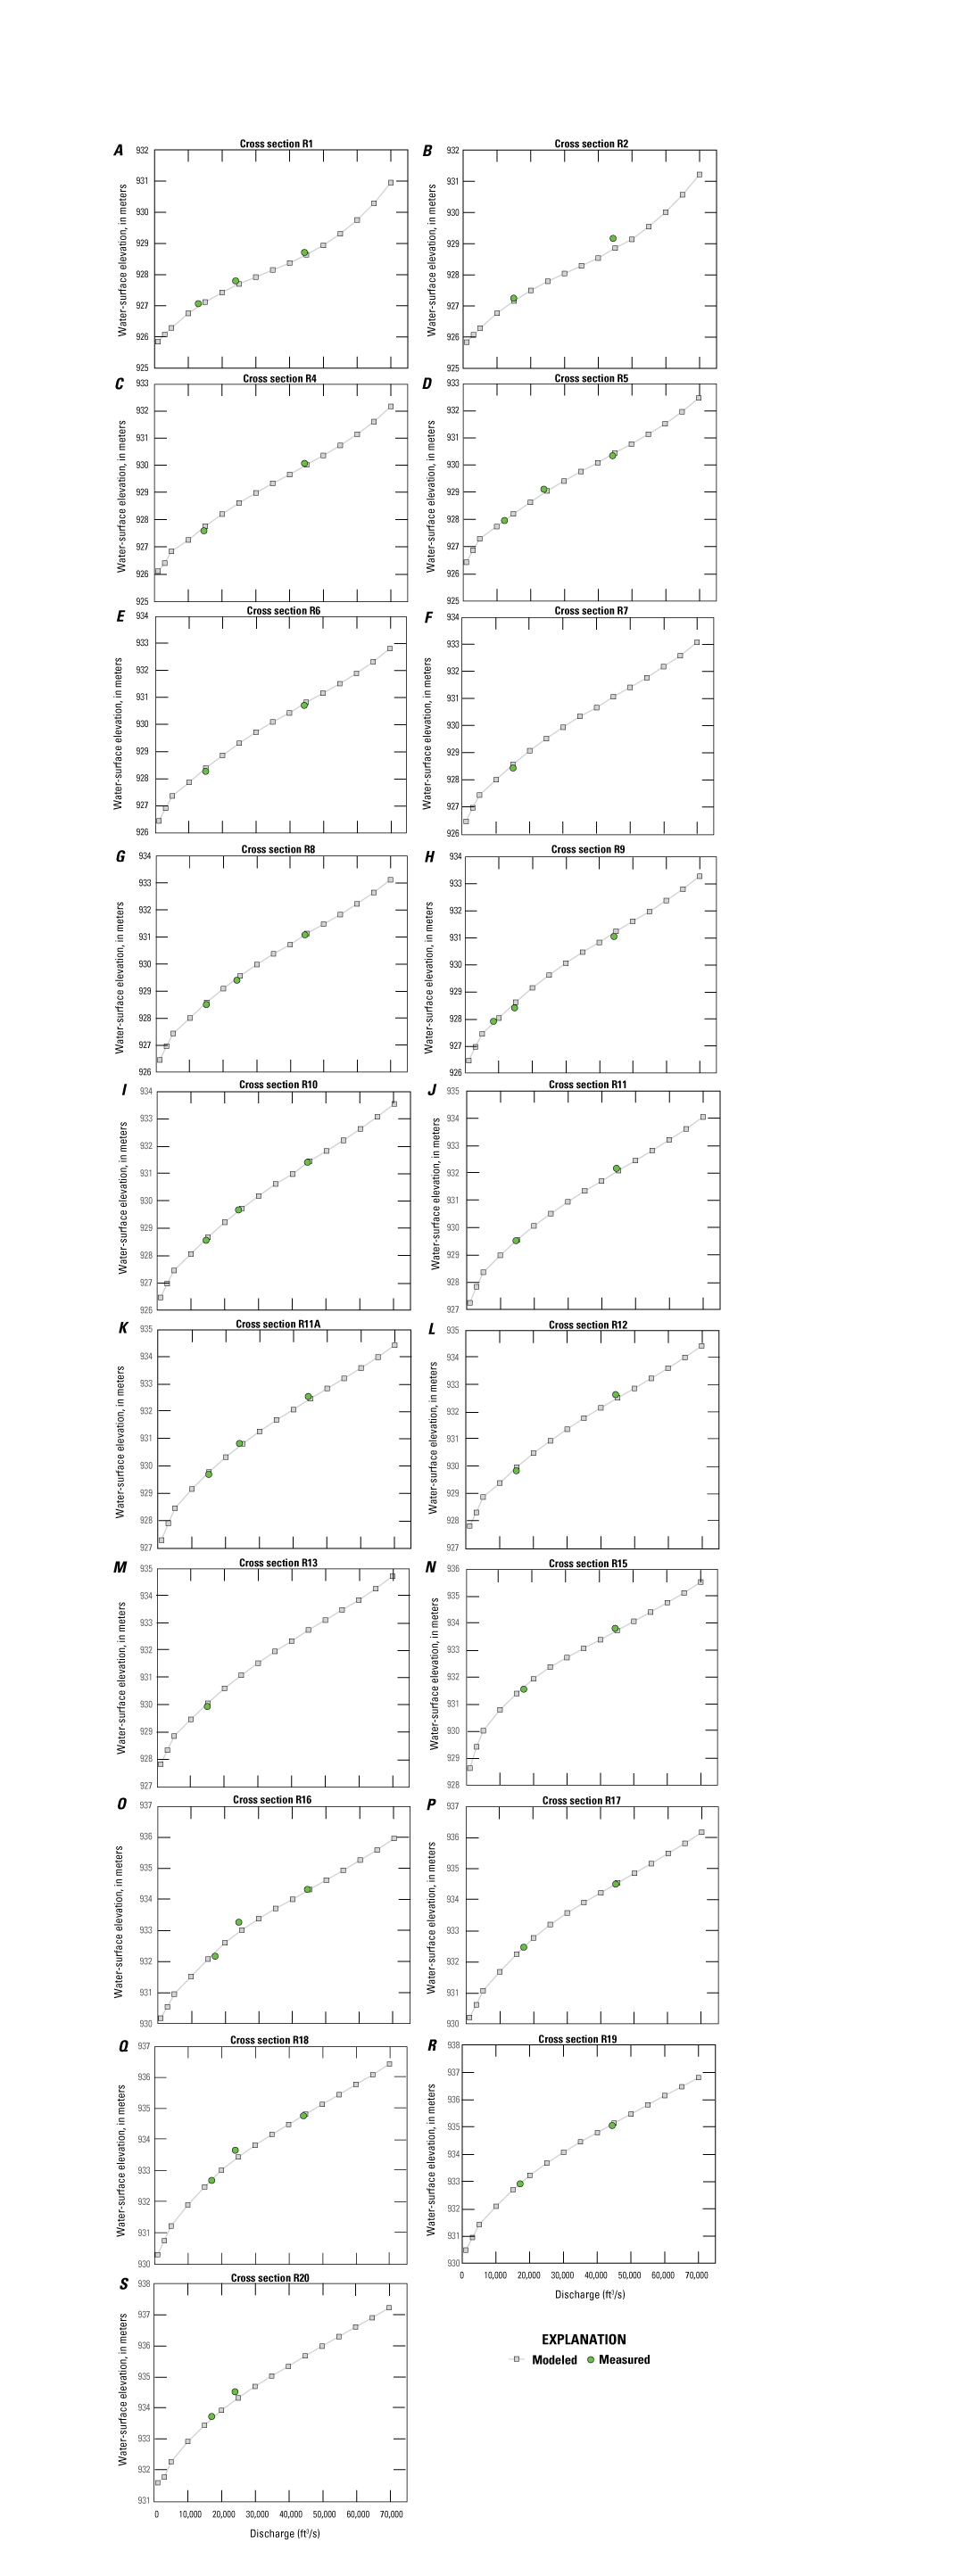
Plots showing the comparison between measured points and modeled water-surface elevation stage-discharge curves at the cross-section locations denoted in figure 1. The model begins 0.25 mile downstream from Glen Canyon Dam and extends to Lees Ferry in the Glen Canyon National Recreation Area, Arizona. These panels (A–S) indicate good agreement between the model and post-1983 measurements. Cross-section locations from Grams and others (2007). Elevation in meters above NAD83 (2011) ellipsoid. ft3/s, cubic feet per second.
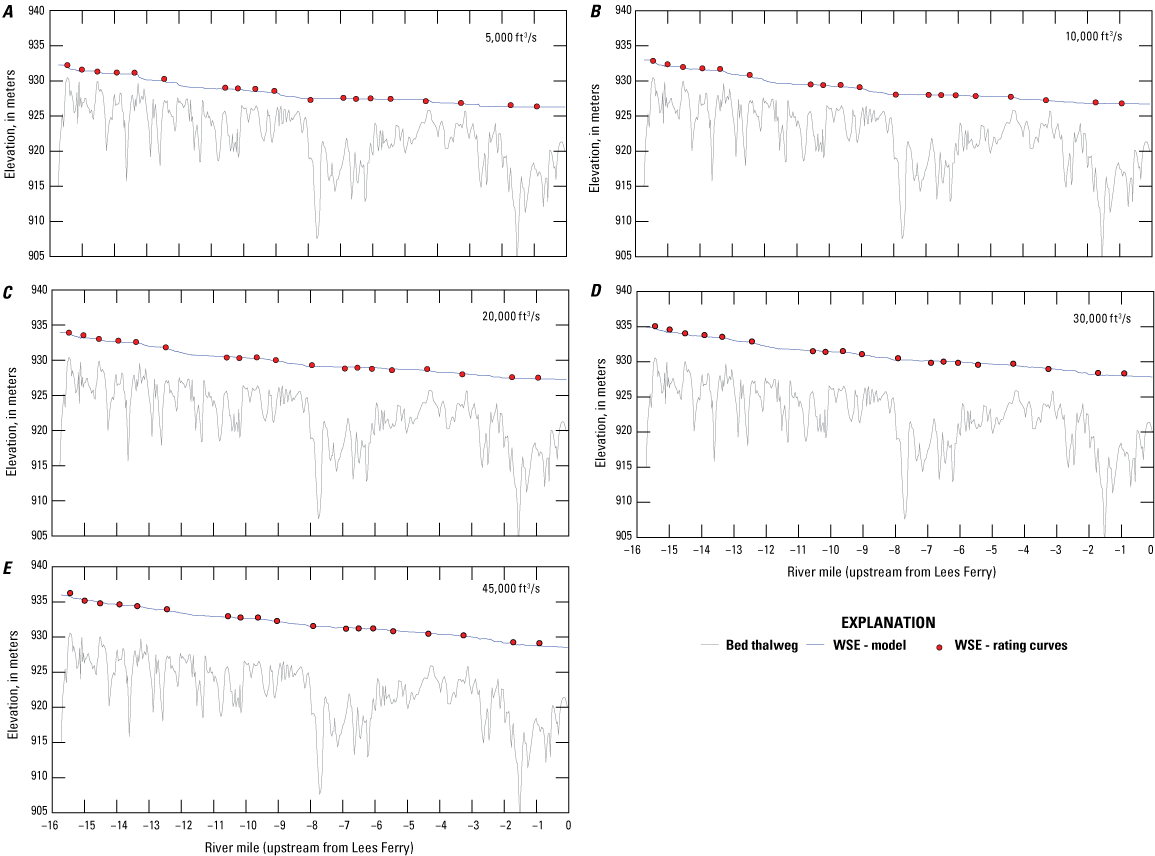
Plots showing the comparison between measured and modeled water-surface elevation (WSE) profiles for five discharges that span the typical range of releases from Glen Canyon Dam, Arizona, along with the bed thalweg elevation profile. Measured water surface values for each specific discharge were derived from the rating curve (stage-discharge curve) developed for each cross section. The figure panels (A–E) demonstrate that the modeled profiles track the measured profiles well over the range of discharges. Bathymetric and topographic data collected from March 2013 to February 2016 (Kaplinski and others, 2022a, b). River miles from Gushue (2019) (fig. 1). Elevation in meters above NAD83 (2011) ellipsoid. ft3/s, cubic feet per second.
Table 1.
Summary of water-surface elevation residuals for a range of discharges from Glen Canyon Dam in the Glen Canyon National Recreation Area, Arizona.[The study area is the 15.8-mile tailwater reach of the Colorado River that extends from 0.25 mile downstream of the Glen Canyon Dam to Lees Ferry. For cross-section locations see fig. 1. ft3/s, cubic feet per second; m, meter; —, not applicable.]
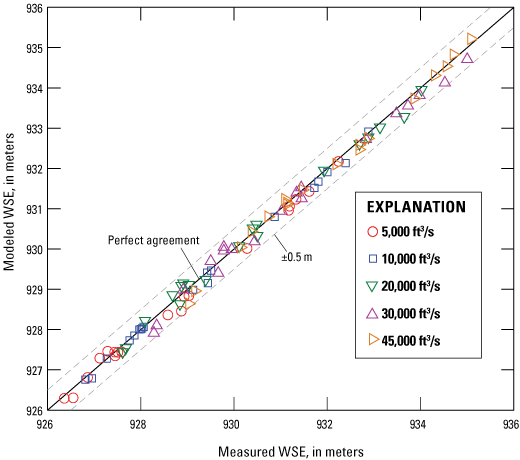
Plot showing the modeled versus measured water-surface elevations (WSE) at all cross sections for five discharges that span the typical range of releases from Glen Canyon Dam, Arizona. Predicted water-surface elevations were compared to measured WSE and elevations derived from stage-discharge relationships to evaluate the accuracy of the model. The stage-discharge relationships were developed by Grams and others (2007) at 19 historical cross sections established by the Bureau of Reclamation that span the length of the study reach (fig. 1). Elevation in meters above NAD83 (2011) ellipsoid. ft3/s, cubic feet per second.
References Cited
Grams, P.E., Schmidt, J.C., Topping, D.J., 2007, The rate and pattern of bed incision and bank adjustment on the Colorado River in Glen Canyon downstream from Glen Canyon Dam, 1956–2000: Geological Society of America Bulletin, v. 119, nos. 5–6, p. 556–575, https://doi.org/10.1130/B25969.1.
Gushue, T.M., 2019, Colorado River mile system, Grand Canyon, Arizona: U.S. Geological Survey data release, accessed August 26, 2021, at https://doi.org/10.5066/P9IRL3GV.
Kaplinski, M., Hazel, J.E., Jr., Grams, P.E., Gushue, T., Buscombe, D.D., and Kohl, K., 2022a, Channel mapping of the Colorado River from Glen Canyon Dam to Lees Ferry in Glen Canyon National Recreation Area, Arizona: U.S. Geological Survey Open-File Report 2022–1057, 20 p., https://doi.org/10.3133/ofr20221057.
Kaplinski, M., Hazel, J.E. Jr., Grams, P.E., Gushue, T., Buscombe, D.D., and Kohl, K., 2022b, Channel mapping Glen Canyon Dam to Lees Ferry in Glen Canyon National Recreation Area, Arizona—Data: U.S. Geological Survey data release, accessed September 26, 2022, at https://doi.org/10.5066/P98GFP93.
Nelson, J.M., Shimizu, Y., Abe, T., Asahi, K., Gamou, M., Inoue, T., Watanabe, Y., 2016, The international river interface cooperative—Public domain flow and morphodynamics software for education and applications: Advances in Water Resources, v. 93, part A, p. 62–74, https://doi.org/10.1016/j.advwatres.2015.09.017.
U.S. Geological Survey [USGS], 2017, 1/3 arc-second digital elevation models (DEMs)—USGS National Map 3DEP downloadable digital collection: U.S. Geological Survey dataset, accessed March 23, 2022, at https://www.usgs.gov/3d-elevation-program.
U.S. Geological Survey [USGS], 2022, USGS 0938000 Colorado River at Lees Ferry, AZ: U.S. Geological Survey National Water Information System, accessed September 26, 2022, at https://waterdata.usgs.gov/nwis/inventory/?site_no=09380000.
Wright, S.A., Kaplinski, M., and Grams, P.E., 2024, Hydrodynamic model of the Colorado River, Glen Canyon Dam to Lees Ferry in Glen Canyon National Recreation Area, Arizona—Tables of model results and accuracy assessment: U.S. Geological Survey data release, https://doi.org/10.5066/P1QTRNEB.
Datum
Vertical coordinate information is referenced to the Geodetic Reference System 1980 ellipsoid defined by the 2011 adjustment of the North American Datum of 1983 (NAD 83[2011]).
Horizontal coordinate information is referenced to NAD 83(2011) and projected to the State Plane Coordinate System of 1983, Arizona Central Zone, in meters.
Elevation, as used in this report, refers to distance above the Geodetic Reference System 1980 ellipsoid defined by NAD 83(2011).
Moffett Field Publishing Service Center, California
Manuscript approved July 24, 2024
Layout by Kimber Petersen
Disclaimers
Any use of trade, firm, or product names is for descriptive purposes only and does not imply endorsement by the U.S. Government.
Although this information product, for the most part, is in the public domain, it also may contain copyrighted materials as noted in the text. Permission to reproduce copyrighted items must be secured from the copyright owner.
Suggested Citation
Wright, S.A., Kaplinski, M.A., and Grams, P.E., 2024, Hydrodynamic model of the Colorado River, Glen Canyon Dam to Lees Ferry in Glen Canyon National Recreation Area, Arizona: U.S. Geological Survey Data Report 1197, 9 p., https://doi.org/10.3133/dr1197.
ISSN: 2771-9448 (online)
Study Area
| Publication type | Report |
|---|---|
| Publication Subtype | USGS Numbered Series |
| Title | Hydrodynamic model of the Colorado River, Glen Canyon Dam to Lees Ferry in Glen Canyon National Recreation Area, Arizona |
| Series title | Data Report |
| Series number | 1197 |
| DOI | 10.3133/dr1197 |
| Publication Date | November 22, 2024 |
| Year Published | 2024 |
| Language | English |
| Publisher | U.S. Geological Survey |
| Publisher location | Reston, VA |
| Contributing office(s) | Southwest Biological Science Center |
| Description | Report: v, 9 p.; Data Release |
| Country | United States |
| State | Arizona |
| Other Geospatial | Colorado River, Glen Canyon Dam, Lees Ferry |
| Online Only (Y/N) | Y |


