

Developing Version 2 of Satellite-Estimated Precipitation Monthly Reports for Selected Locations in the Republic of the Marshall Islands
Links
- Document: Report (793 kB pdf) , HTML , XML
- Data Release: USGS data release - Monthly satellite-estimated precipitation reports for the Republic of the Marshall Islands (ver. 2.0, February 2024)
- NGMDB Index Page: National Geologic Map Database Index Page (html)
- Download citation as: RIS | Dublin Core
Acknowledgments
We are grateful for the continued partnership with our colleagues in the Republic of the Marshall Islands, U.S. Agency for International Development, and National Resources Conservation Service. We thank the U.S. Geological Survey (USGS) Earth Resources Observation and Science Center, the USGS National Land Imaging Program, and the USGS National Climate Adaptation Science Center for funding that supported this research revision cycle.
Abstract
The Republic of the Marshall Islands (RMI; also known as the Marshall Islands) is a nation of more than 30 low-lying atolls and islands, most of which are inhabited, dispersed across an Exclusive Economic Zone over 770,000 square miles in the tropical central north Pacific Ocean. The study objectives and methods were originally presented in U.S. Geological Survey Data Report 1181 and are summarized herein. Monitoring environmental conditions for potential drought risk is challenging in such a dispersed island nation, and current drought hazard products provide generalities regarding conditions on a broad geographic scale. In 2022–23, a team of U.S. Geological Survey scientists, and managers of natural resources and natural hazards in the RMI, used Integrated Multi-satellitE Retrievals for Global Precipitation Measurement satellite estimates of precipitation to develop content and a template for timely monthly reporting of precipitation for 23 inhabited atolls and islands. After a year of report production and user feedback, the team incorporated lessons learned and revised user priorities to update the content and layout of the template. This data report describes the collaboration process and results of revising the report content and layout into version 2 of the monthly satellite-estimated precipitation report.
Introduction
The Republic of the Marshall Islands (RMI; also known as Marshall Islands) is a Small Island Developing State in the Micronesian subregion of the tropical north Pacific Ocean. Communities and agriculture are distributed across several dozen atolls and islands in an ocean area of more than 770,000 square miles. Precipitation is the only natural source of freshwater recharge with latitudinal and seasonal patterns (Stoddart and Walsh, 1992; Leong and others, 2014). Many Marshallese communities rely on crops for food and income, and crops depend on precipitation and groundwater of suitable quality (reviewed in Senay and others, 2023b).
The goal of this effort was to provide managers of water and food security programs in the Marshall Islands with comprehensive, timely estimated precipitation reports that complement and add value to the existing suite of weather and climate products they already use for decision-making. The study objectives and methods were originally presented by Senay and others (2023b) and are summarized herein. In 2022–23, a team of U.S. Geological Survey scientists, and managers of natural resources and natural hazards in the RMI, used Integrated Multi-satellitE Retrievals for Global Precipitation Measurement (IMERG) satellite estimates of precipitation to develop content and a template for timely monthly reporting of precipitation for 23 inhabited atolls and islands (fig. 1; Senay and others, 2023a, 2023b). After a year of report production and user feedback, the team incorporated lessons learned and revised user priorities to update the content and layout of the template. This data report describes the collaboration process and results of revising the report content and layout into version 2 of the monthly satellite-estimated precipitation report.
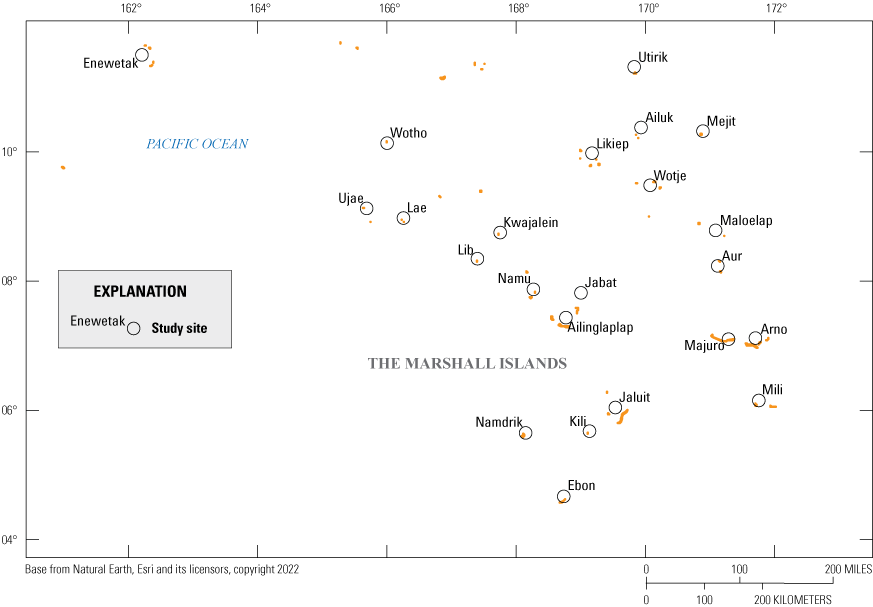
Marshall Islands study sites, north Pacific Ocean (modified from Senay and others, 2023b).
Revising the Monitoring Protocol and Report Template
Satellite Data for Version 2
Environmental monitoring using satellite data generates estimates of precipitation and was used to report monthly estimates for 23 inhabited atolls and islands using IMERG version 6 satellite data (National Aeronautics and Space Administration, 2023). In the initial study, we used 20 years (2001–20) of IMERG Final Run data to define baseline statistics for each of the 23 locations and IMERG version 6 Late Run data for the monthly reporting (Senay and others, 2023b). In this revision (version 2), we used IMERG Late Run data from the same sampling period to define baseline statistics, which ensured the monthly Late Run data were being compared with a baseline dataset that had the same descriptive statistical properties of central tendencies and dispersions. Additionally, in the initial version we filtered out two standard deviation outliers from the daily records in the 20-year baseline dataset before summing the daily data into monthly totals (Senay and others, 2023b). To fully reflect the variation of the baseline data, in this revision (version 2) we did not exclude statistical outliers from the IMERG Late Run baseline dataset before computing monthly sums and then statistics for each location. Instead, we identified six standard deviation daily peaks using Z scores computed from the same location and month, and, using a method similar to the “wet days” pre-processing method used by Beck and others (2019), replaced them with the local three-day average. This pre-processing also was applied to incoming data for the monthly reports. Finally, starting in June 2024 the National Aeronautics and Space Administration updated its IMERG data processing from version 6 to version 7 (Huffman and others, 2023). Thus, reports generated for January–May 2024 used version 6 data for both the baseline statistics and reporting month, and reports from June 2024 onwards used version 7 data for both the baseline statistics and reporting month.
Developing the Report Content for Version 2
The content of the monthly report consists of descriptive statistics assembled from the IMERG data plus visual representations of those statistics. The report produced each month was a summary of the estimated precipitation of the previous month. Because the monthly reports were designed to supplement existing precipitation, drought, and agroforest management products, the reports do not include predictive statistics or interpretation of the effect of the estimated precipitation on or potential risk to vegetation health or crop production. The monthly reports and included data are available and could aid with operational efforts for drought monitoring in the Marshall Islands as well as the U.S.-Affiliated Pacific Islands or all of Oceania.
During the development phase, the team agreed to have two rainfall indices that would serve as a frame of reference for how typical or unusual the monthly precipitation was (rationale and methodological details are provided by Senay and others [2023b]). One index used is the Pacific ENSO Application Climate Center (PEAC) 4/8-inch index (Pacific ENSO Applications Climate Center, 2015). No changes were made to the PEAC 4/8-inch index in version 2. A color ramp using the threshold values of 4 and 8 inches was applied; monthly precipitation less than 4 inches was colored red, 4–8 inches was colored yellow, and greater than 8 inches was colored dark green. The resulting PEAC map is presented in the lower panel of information graphic 1 in the USGS data release (Senay and others, 2023a) in version 2.
The second index used is the rainfall index. Precipitation was categorized along a nonparametric scale using quintiles derived from the 20-year IMERG baseline data. Methodological details are provided by Senay and others (2023b). The quintiles for the rainfall index are as follows: the bottom quintile (0–19 percent) consists of the lowest precipitation values (driest), the next quintile (20–39 percent) represents drier conditions, the middle quintile (40–59 percent) includes the median and spans the most typical precipitation values (typical), the next quintile (60–79 percent) is a little wet compared to the typical conditions, and the highest quintile (80–100 percent) consists of the highest precipitation values (wetter). Each of the quintiles is associated with a color as a quick indicator of how the current month’s precipitation compares to the statistics of the 20-year database, ranging from brown (drier quintile) to deep blue (wetter quintile). The resulting rainfall index map is presented in the upper panel of information graphic 1 in version 2.
In the initial approach, the management partners wished to focus on detecting unusually dry or wet conditions. Therefore, the precipitation of any given month was compared against the long-term (2001–20) data from that location and month. Thus, a set of descriptive statistics was calculated for each month at each of the 23 locations using the 20-year IMERG Final Run database. During the first year, the team identified two challenges created by the “same place same month” comparisons. The first challenge was that the long-term baseline dataset was created using IMERG Final Run data but compared with IMERG Late Run monthly estimates for timely reporting. Differences in the statistics of the Final Run versus Late Run data resulted in many, if not most, months being classified as “wet” or “wetter” than typical in the rainfall index, which rendered the rainfall index uninformative. Therefore, in this revision (version 2) we used IMERG Late Run data from 2001 to 2020 for the baseline data, as well as the monthly reporting data, which ensured the statistics of the baseline data (central tendencies, dispersions) would be most representative of the same modeling distribution from which the monthly precipitation estimates were derived.
The second challenge experienced by the team was lack of agreement between the two precipitation indices. The PEAC index (Senay and others, 2023b) reflected the seasonal and latitudinal variation in precipitation that is well-documented in the RMI (Stoddart and Walsh, 1992; Leong and others, 2014). In contrast, as described above, the rainfall index for most locations remained at “wet” or “wetter” than typical even during the winter/spring dry season. Although the team had discussed this possibility in the initial development process (refer to “Developing the Report Content” in Senay and others, 2023b), the users had not anticipated how challenging it would be to have two indices that did not seem to agree.
Therefore, we made a noteworthy change in the statistics used for the rainfall index. The team decided that communicating patterns of precipitation for each location, including “normal” seasonal dry/wet trends, would result in greater agreement between the rainfall index and the PEAC 4/8-inch index thresholds, which was desirable for our users. We pooled data for all months for each location and computed location-specific rank-order quintiles for each of the 23 locations. Pooling the data across months resulted in changing the protocol from a rainfall index that categorized monthly precipitation from the same place and same month to version 2, which categorized monthly precipitation from the same place as compared across all months from that place during the 20-year baseline data period. In version 2, the “Typical” category in the rainfall index graphics was re-labeled as “Local Median” in the upper panel of graphic 1 to communicate this change to same-place all-months baseline statistics (Senay and others, 2023a).
Developing the Layout for the Report Template Version 2
At the core of the monthly reports are two estimated precipitation values, two colorized rainfall indicators, and a bar graph with the precipitation history for recent months. This information is delivered in multiple ways that provide different quick-look summaries of the precipitation status. In this revision cycle, we modified the content and layout that was developed in the initial work (Senay and others, 2023a, 2023b). Information graphics in version 2 are numbered to facilitate the co-production process and referenced in this report.
-
• On page one (Senay and others (2023a), the data for all locations are summarized in an alphabetically sorted table that includes the following data:
-
o Location.—The report included 23 atolls and islands and the table has 23 rows, one row for each location.
-
o 20-year median, in inches.—This is derived from the IMERG Late Run database from 2001 to 2020 (Senay and others, 2022), from which the monthly median was computed using monthly values for each location.
-
o Current estimate, in inches.—This is the monthly sum of daily IMERG Late Run values for each location (Senay and others, 2022; Senay and others, 2023b).
-
-
• Graphic 1 within version 2 (Senay and others, 2023a) presents maps summarizing the two rainfall indices (as described in the “Developing the Report Content” section). The top panel is the revised rainfall index using colors assigned to the quintiles (labeled “Estimated Rainfall Condition”) and the bottom panel is the PEAC index map that depicts estimated precipitation using colors assigned to the PEAC thresholds.
-
• Graphic 2 within version 2 (Senay and others, 2023a) presents a set of panels, one for each location, that has greater detail regarding the recent precipitation history. Each panel includes the following data:
-
o Location.—The report included 23 atolls and islands; thus, every month includes 23 graphs, with 1 for each location.
-
o 20-year median, in inches.—This was derived from the IMERG Late Run database from 2001 to 2020 and are the same median values as reported in the table within Senay and others (2023a).
-
o Current estimate, in inches.—This was the monthly sum of daily IMERG Late Run values for the location and are the same values as reported in the table within Senay and others (2023a).
-
o Rainfall index.—This colorized box was included as a quick index of how the current month precipitation compares to the statistics of the 2001–20 precipitation database and contains the same values as displayed in the rainfall index map in graphic 1 within Senay and others (2023a).
-
o PEAC 4/8-inch index.—This colorized box refers to the set of PEAC thresholds and are the same values as displayed in the PEAC index map in graphic 1 within Senay and others (2023a).
-
o History of monthly estimated precipitation, in inches, for the current calendar year.—The layout was consistent with the format in which the U.S. Agency for International Development receives precipitation reports. Estimated precipitation is on the vertical axis, and month of year is on the horizontal axis. The median monthly values from the IMERG Late Run data (2001–20; Senay and others, 2022) are presented in a blue curve, and the band corresponding to the values between the first quartile and third quartile is colored gray. IMERG Late Run monthly estimates for the current year (Senay and others, 2022) are presented in orange bars.
-
-
• Graphic 3 within version 2 (Senay and others, 2023a) presents three panels that give a visual representation of patterns of precipitation during the reporting period. The IMERG precipitation for the reporting period was divided into 3 dekads (early month [days 1–10], mid-month [days 11–20], and late month [day 21 to the last day]). Lightest areas received the least precipitation, and areas that received the most precipitation are shown in dark blue. This graphic is moved to the end of the template but its content is unchanged from the initial version.
-
A summary of revisions is provided in table 1.
Table 1.
Summary of revisions made to version 1 of the template for monthly reporting of precipitation for 23 inhabited atolls and islands (Senay and others, 2022).[IMERG, Integrated Multi-satellitE Retrievals for Global precipitation measurement; SD, standard deviation; Version 1, from Senay and others (2023b); Version 2, the revisions described in this report]
Summary
In 2022–23, a team of U.S. Geological Survey scientists, and managers of natural resources and natural hazards in the Republic of the Marshall Islands, used Integrated Multi-satellitE Retrievals for Global Precipitation Measurement satellite estimates of precipitation to develop content and a template for timely monthly reporting of precipitation for 23 inhabited atolls and islands. After a year of report production and user feedback, the team incorporated lessons learned and revised user priorities to update the template's content and layout of the template. Version 2 represents an enhanced, improved rainfall communication product that is delivered monthly to the co-production partners and others in climate, weather, water, and disaster management programs who have asked to be included. The information allows users to gain a quick understanding of whether low precipitation levels were persisting and potentially becoming a cause for concern. The satellite data and monthly reports are available and could form the basis of an operational system for drought and agricultural managers in the Marshall Islands or could be expanded to include the U.S.-Affiliated Pacific Islands or all of Oceania.
References Cited
Beck, H.E., Wood, E.F., Pan, M., Fisher, C.K., Miralles, D.G., van Dijk, A.I.J.M., McVicar, T.R., and Adler, R.F., 2019, MSWEP V2 GLOBAL 3-HOURLY 0.1° PRECIPITATION—Methodology and Quantitative Assessment: Bulletin of the American Meteorological Society, v. 100, no. 3, p. 473–500, accessed March 1, 2024, at https://doi.org/10.1175/BAMS-D-17-0138.1.
Huffman, G.J., Bolvin, D.T., Joyce, R., Kelley, O.A., Nelkin, E.J., Portier, A., Stocker, E.F., Tan, J., Watters, D.C., and West, J., 2023, IMERG V07 release notes: accessed March 1, 2024, at https://gpm.nasa.gov/sites/default/files/2024-02/IMERG_V07_ReleaseNotes_240221.pdf.
Leong, J., Marra, J.J., Finucane, M.L., Giambelluca, T., Merrifield, M., Miller, S.E., Polovina, J., Shea, E., Burkett, M., Campbell, J., Lefale, P., Lipschultz, F., Loope, L., Spooner, D., and Wang, B., 2014, Hawai'i and U.S. Affiliated Pacific Islands, chap. 23 of Melillo, J.M., Richmond, T.C., and Yohe, G.W., eds., Climate change impacts in the United States—The Third National Climate Assessment: U.S. Global Change Research Program, p. 537–556. [Also available at https://doi.org/10.7930/J0W66HPM.]
National Aeronautics and Space Administration, 2023, IMERG—Integrated Multi-satellitE Retrievals for GPM: National Aeronautics and Space Administration digital data, accessed March 9, 2023, at https://gpm.nasa.gov/data/imerg.
Pacific ENSO Applications Climate Center, 2015, 3rd quarter, 2015: Pacific ENSO Update, v. 21, no. 3, 20 p., accessed February 27, 2023, at https://www.weather.gov/peac/update.
Senay, G.B., Kagone, S., Cecere, T.H., Helweg, D., Nelson, K., and Taylor, J.B., 2022, Satellite precipitation estimates for selected locations in the Republic of the Marshall Islands: U.S. Geological Survey data release, accessed February 2024 at https://doi.org/10.5066/P95ANG3N.
Senay, G.B., Helweg, D., Kagone, S., Taylor, J.B., Cecere, T.H., and Nelson, K., 2023a, Monthly satellite-estimated precipitation reports for the Republic of the Marshall Islands (ver. 2.0, February 2024): U.S. Geological Survey data release, accessed February 2024 at https://doi.org/10.5066/P90J1426.
Senay, G.B., Helweg, D.A., Kagone, S., Taylor, J.B., Cecere, T., Eastmond, T., Koch, A., Nelson, K., and Rufus, L., 2023b, Developing satellite-estimated precipitation monthly reports for selected locations in the Republic of the Marshall Islands: U.S. Geological Survey Data Report 1181, 7 p., accessed February 2024 at https://doi.org/10.3133/dr1181.
Stoddart, D.R., and Walsh, R.P.D., 1992, Environmental variability and environmental extremes as factors in the islands ecosystem: Atoll Research Bulletin, v. 356, p. 1–71. [Also available at https://doi.org/10.5479/si.00775630.356.1.]
For more information about this publication, contact:
Director, USGS Earth Resources Observation and Science Center
47914 252nd Street
Sioux Falls, SD 57198
605–594–6151
For additional information, visit: https://www.usgs.gov/centers/eros
Publishing support provided by the
Rolla Publishing Service Center
Disclaimers
Any use of trade, firm, or product names is for descriptive purposes only and does not imply endorsement by the U.S. Government.
Although this information product, for the most part, is in the public domain, it also may contain copyrighted materials as noted in the text. Permission to reproduce copyrighted items must be secured from the copyright owner.
Suggested Citation
Senay, G.B., Helweg, D.A., Kagone, S., Cecere, T., Eastmond, T., Koch, A., Nelson, K., and Jack, R., 2024, Developing version 2 of satellite-estimated precipitation monthly reports for selected locations in the Republic of the Marshall Islands: U.S. Geological Survey Data Report 1199, 5 p., https://doi.org/10.3133/dr1199.
ISSN: 2771-9448 (online)
Study Area
| Publication type | Report |
|---|---|
| Publication Subtype | USGS Numbered Series |
| Title | Developing version 2 of satellite-estimated precipitation monthly reports for selected locations in the Republic of the Marshall Islands |
| Series title | Data Report |
| Series number | 1199 |
| DOI | 10.3133/dr1199 |
| Publication Date | August 13, 2024 |
| Year Published | 2024 |
| Language | English |
| Publisher | U.S. Geological Survey |
| Publisher location | Reston, VA |
| Contributing office(s) | Earth Resources Observation and Science (EROS) Center, National Climate Change and Wildlife Science Center, National Geospatial Program |
| Description | Repoort: v, 5 p.; Data Release |
| Other Geospatial | Marshall Islands |
| Online Only (Y/N) | Y |
| Additional Online Files (Y/N) | N |