

Streamflow, Water Quality, and Constituent Loads and Yields, Scituate Reservoir Drainage Area, Rhode Island, Water Year 2021
Links
- Document: Report (3.57 MB pdf) , HTML , XML
- Data Release: USGS data release - Water-quality data from the Providence Water Supply Board for tributary streams to the Scituate Reservoir (ver. 3.0, 2023)
- NGMDB Index Page: National Geologic Map Database Index Page (html)
- Download citation as: RIS | Dublin Core
Abstract
As part of a long-term cooperative program to monitor water quality within the Scituate Reservoir drainage area, the U.S. Geological Survey in cooperation with Providence Water (formerly Providence Water Supply Board) collected streamflow and water-quality data in tributaries to the Scituate Reservoir, Rhode Island. Streamflow and concentrations of chloride and sodium estimated from records of specific conductance for 16 tributaries were used to calculate loads of chloride and sodium during water year 2021 (October 1, 2020, through September 30, 2021). Water-quality samples were collected by Providence Water at 36 sampling stations on tributaries to the Scituate Reservoir during water year 2021. These water-quality data are summarized by using values of central tendency and are used, in combination with measured (or estimated) streamflows, to calculate loads and yields of selected water-quality constituents for water year 2021.
Annual mean streamflows for monitoring stations in this study ranged from 0.37 to 32.4 cubic feet per second during water year 2021. At the 16 continuous-record streamgages, tributaries transported about 2,900 metric tons (t) of chloride and 1,800 t of sodium to the Scituate Reservoir; annual chloride yields for the tributaries ranged from 15 to 110 metric tons per square mile (t/mi2), and annual sodium yields ranged from 10 to 68 t/mi2. At the stations where water-quality samples were collected by Providence Water, the medians of the median daily loads were 180 kilograms per day for chloride, 12 grams per day as nitrogen for nitrite, less than 700 grams per day as nitrogen for nitrate, 410 grams per day as orthophosphate for phosphate, 71,000 million colony forming units per day for coliform bacteria, and less than 2,000 million colony forming units per day for Escherichia coli. The medians of the median yields were 67 kilograms per day per square mile for chloride, 4.2 grams per day per square mile as nitrogen for nitrite, 400 grams per day per square mile as nitrogen for nitrate, 180 grams per day per square mile as orthophosphate as phosphate, 46,000 million colony forming units per day per square mile for coliform bacteria, and 1,000 million colony forming units per day per square mile for Escherichia coli.
Plain Language Summary
The U.S. Geological Survey, in cooperation with Providence Water (formerly Providence Water Supply Board), conducted a long-term program to monitor water quality in the Scituate Reservoir drainage area in Rhode Island to collect streamflow and water-quality data from 16 tributaries to the reservoir during the water year 2021. These data were used to estimate loads of chloride and sodium. Additionally, water-quality samples were collected at 36 sampling stations on the tributaries, and the data were summarized using central tendency values.
-
• Annual mean streamflows for monitoring stations ranged from 0.37 to 32.4 cubic feet per second.
-
• Tributaries transported about 2,900 metric tons of chloride and 1,800 metric tons of sodium to the reservoir.
-
• Annual yields ranged from 15 to 110 metric tons per square mile for chloride and 10 to 68 metric tons per square mile for sodium.
-
• The medians of the median daily loads were 180 kilograms per day for chloride, 12 grams per day as nitrogen for nitrite, less than 700 grams per day as nitrogen for nitrate, 410 grams per day as orthophosphate for phosphate, 71,000 million colony forming units per day for coliform bacteria, and less than 2,000 million colony forming units per day for Escherichia coli.
-
• The medians of the median yields were 67 kilograms per day per square mile for chloride, 4.2 grams per day per square mile as nitrogen for nitrite, 400 grams per day per square mile as nitrogen for nitrate, 180 grams per day per square mile as orthophosphate for phosphate, 46,000 million colony forming units per day per square mile for coliform bacteria, and 1,000 million colony forming units per day per square mile for Escherichia coli.
Introduction
The Scituate Reservoir is the primary source of drinking water for more than 60 percent of the population of Rhode Island. The Scituate Reservoir drainage area consists of six subbasins and covers an area of about 94 square miles (mi2) in parts of the towns of Cranston, Foster, Glocester, Johnston, and Scituate, R.I. (fig. 1). The six subbasins are referred to in this report as the Barden Reservoir, “Direct Runoff,”, Moswansicut Pond reservoir, Ponaganset Reservoir, “Regulating reservoir,”, and Westconnaug Reservoir subbasins [“informal” names are used for subbasins that do not have official names]. Information about the water quality of the reservoir and its tributaries is important for management of the water supply and for the protection of human health. Providence Water (PW; formerly the Providence Water Supply Board) is the agency responsible for the management and distribution of the Scituate Reservoir water supply and has been monitoring and assessing water quality in the reservoir and reservoir drainage area for more than 60 years.
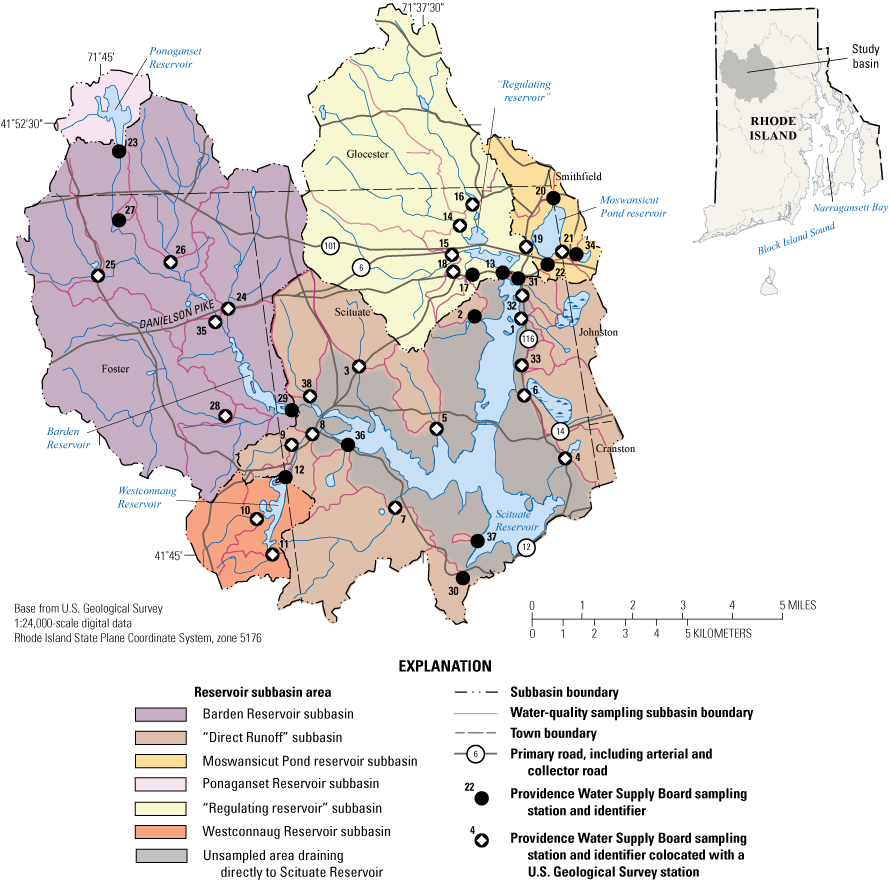
Map showing locations of tributary-reservoir subbasins and stations in the Scituate Reservoir drainage area, Rhode Island, in water year 2021 (October 1, 2020, through September 30, 2021). Modified from Breault (2009). Data are from Smith and Spaetzel (2021).
Since 1993, the U.S. Geological Survey (USGS) has been cooperating with PW and the Rhode Island Department of Environmental Management to measure streamflow in tributaries to the Scituate Reservoir. Streamflow has been continuously measured at 10 streamgages in the drainage area (table 1) since 2009 by the USGS. Streamflow also was continuously measured at four streamgages from 2009 to 2014 and periodically measured at nine additional streamgages on tributaries in the drainage area. In October 2020, three streamgages began or resumed collection of continuous streamflow data (table 1). At 11 streamgages, daily mean streamflow was estimated for the period between October 1, 2020, and September 30, 2021, by using methods developed by the USGS (table 1; Hirsch, 1982). The USGS also has been continuously measuring specific conductance at 14 monitoring stations since 2009 and at 2 additional monitoring stations since 2020 (table 1). Equations that relate specific conductance to concentrations of chloride and sodium in stream water were developed as part of previous cooperative studies of the USGS and PW (Nimiroski and Waldron, 2002; Smith, 2015b, 2018a, 2022a, 2024; Spaetzel and Smith, 2022b). These equations, used together with measured (or estimated) streamflows, allow for nearly continuous estimation of chloride and sodium loads to the reservoir.
Table 1.
Providence Water water-quality sampling stations and corresponding U.S. Geological Survey streamgages, in the Scituate Reservoir drainage area, Rhode Island, and data collection and monitoring statistics from October 1, 2020, to September 30, 2021.[Data are from U.S. Geological Survey (2023). Alternate station names given in parenthesis for stations where different historical names were used for the same sampling location by Providence Water (PW). Locations of stations are shown on figure 1. USGS, U.S. Geological Survey; mi2, square mile; WQ, water quality; Cl, chloride; Na, sodium; M, monthly; Q, quarterly; Y, yes; N, no; --, not applicable]
In 2021, PW regularly, either monthly or quarterly, visited fixed sites on 37 tributaries within the Scituate Reservoir drainage area and collected water-quality samples; however, no samples were collected at the Toad Pond (USGS station 01115177; PW station 31) site because it was routinely dry. Although the Swamp Brook (USGS station 01115278; PW station 38) site began being monitored by USGS in October 2020 and is the 38th site to be monitored by PW, samples were first collected after September 30, 2021 (table 1). Therefore, a total of 36 sites were sampled by PW between October 1, 2020, and September 30, 2021, of which, three were sampled fewer than three times. Compiled and tabulated streamflow (measured or estimated by the USGS) and water-quality data (collected by PW) have been published in Breault and others (2000), Nimiroski and others (2008), Breault (2009), Breault and Campbell (2010a-d), Breault and Smith (2010), Smith and Breault (2011), Smith (2013, 2014, 2015a, b, 2016, 2018a-d, 2019a, b, 2021, 2022a, b, 2024)2021222324, Smith and Spaetzel (2021), and Spaetzel and Smith (2022a, b)37.
This report presents data on streamflow, water quality, and loads and yields of selected constituents for water year (WY) 2021 in the Scituate Reservoir drainage area. Data were collected in past studies by the USGS in cooperation with PW and the Rhode Island Department of Environmental Management and continuous measurements provided by PW (Smith and Spaetzel, 2021). This report summarizes measured and estimated streamflows presented for the 13 continuous-record and 11 partial-record streamgages (called “estimated” in table 1) in the drainage area. Estimated monthly and annual loads and yields of chloride and sodium are presented for the 16 streamgages at which specific conductance is continuously monitored by the USGS (table 1). Summary statistics for water-quality data collected by PW for 36 sampling stations during WY 2021 also are presented, and these data were used to calculate loads and yields of selected water-quality constituents where flow data were available. Water-quality data related to the Scituate Reservoir drainage area have been published serially by the USGS since 2000 (Breault and others, 2000). The presentation and content of this report has been replicated from Breault (2009), with annually updated methods, data, and interpretations (Breault and Campbell, 2010a–d; Breault and Smith, 2010; Smith and Breault, 2011; Smith 2013, 2014, 2015a, 2016, 2018a, b, 2019a, 2022a20212324252831).
Streamflow Data Collection and Estimation
Streamflow was measured or estimated by the USGS at 24 streamgages (table 1). Measured and estimated streamflows are necessary to estimate water volume and water-quality constituent loads and yields from tributary basins. Stream gage height was measured at 10- or 15-minute intervals at the continuous-record streamgages. Streamflow was computed with a gage height to discharge relation (known as a rating), which was developed on the basis of periodic manual measurements of streamflow. Daily mean streamflow at a streamgage was calculated by dividing the total volume of water that passed the streamgage each day by 86,400 (the number of seconds in a day). Periodic manual streamflow measurements at partial-record streamgages were used concurrently with continuous-record measurements from streamgages in nearby hydrologically similar drainage areas to estimate a continuous daily record at the partial-record streamgages. Specifically, daily streamflow records for the 11 partial-record sites in the Scituate Reservoir drainage area (table 1) were estimated by using the maintenance of variance extension type 1 (MOVE.1) method, as described by Ries and Friesz (2000), Smith (2015b), and Spaetzel and Smith (2022b); data needed to estimate streamflows at partial-record sites were retrieved from the USGS National Water Information System (NWIS; U.S. Geological Survey, 2023). The upper and lower 90-percent confidence limits for the estimated mean annual streamflows, as described by Tasker and Driver (1988), are listed in table 2. These USGS data indicate that there is a 90-percent chance that the estimated mean annual streamflow is between the upper and lower 90-percent confidence limits.
Table 2.
Measured or estimated annual mean streamflow for tributary streams in the Scituate Reservoir drainage area, Rhode Island, from October 1, 2020, through September 30, 2021.[Data were collected by the U.S. Geological Survey (U.S. Geological Survey, 2023). Stations are shown on figure 1. PW, Providence Water; USGS, U.S. Geological Survey; ft3/s, cubic foot per second; (ft3/s)/mi2, cubic foot per second per square mile]
Continuous-record streamgages were operated and maintained by the USGS during WY 2021 (fig. 1; table 1). Streamflow data for these streamgages were collected at 10- or 15-minute intervals (near-real-time streamflow data) and were updated at 1-hour intervals through NWIS (U.S. Geological Survey, 2023). Error associated with measured streamflows was generally within about 15 percent as noted in the annual water year summary for each USGS streamgage (U.S. Geological Survey, 2023).
Water-Quality Data Collection and Analysis
Water-quality data were collected by the USGS and PW. Concentrations of sodium and chloride were estimated by the USGS from continuous records of specific conductance from 16 of the 24 streamgages. Water-quality samples were collected monthly or quarterly at 36 sampling stations in the Scituate Reservoir drainage area by PW during WY 2021 as part of a long-term sampling program (table 1).
Data Collected by the U.S. Geological Survey
Three or more water-quality samples were collected by the USGS at each of the 16 streamgages equipped with continuous specific conductance monitors in the Scituate Reservoir drainage area during WY 2021 (table 1), except from unnamed brook A (USGS station 01115120; PW station 18) and Peeptoad Brook (USGS station 01115098; PW station 16) sites where samples were not collected during the summer because the streambeds were dry. Samples were collected in the centroid of the streams during fall, winter, and summer. Water samples were processed in the USGS New England Water Science Center laboratory in Northborough, Massachusetts, at the conclusion of scheduled sampling. After the processing, the samples were packed in ice and shipped overnight to the USGS National Water Quality Laboratory in Lakewood, Colorado. Analytical results for the USGS water-quality samples are available through the NWIS web interface (U.S. Geological Survey, 2023); these include specific conductance and dissolved concentrations of calcium, chloride, magnesium, potassium, sodium, and sulfate.
The USGS collected and analyzed continuous-record specific conductance data at 16 streamgages (fig. 1; table 1). Measurements of specific conductance were recorded automatically at 10- or 15-minute intervals at each streamgage. Measurements were made by using an instream probe and standard USGS methods for continuous water-quality monitoring at streams (Wagner and others, 2006). The specific conductance measurement data are available through the NWIS web interface (U.S. Geological Survey, 2023). Concentrations of chloride and sodium were estimated from continuous measurements of specific conductance by using equations that were developed by the USGS to relate specific conductance to concentrations of chloride and sodium, as follows:
whereThese regression equations were developed by using the MOVE.1 method (also known as the line of organic correlation; Helsel and Hirsch, 2002) on the basis of concurrent measurements of specific conductance (USGS parameter code 90095, corresponding to the observed property “Specific conductance, water, unfiltered, normalized to 25 degrees Celsius, laboratory” with units of µS/cm) along with chloride (USGS parameter code 00940, corresponding to the observed property “Chloride, water filtered” with units of mg/L) and sodium (USGS parameter code 00930, corresponding to the observed property “Sodium, water filtered” with units of mg/L) concentrations measured in water-quality samples collected by the USGS from tributaries in the Scituate Reservoir drainage area during WY 2000, WY 2005, and WYs 2009–23 (table 3; U.S. Geological Survey, 2023).
Table 3.
Regression equation coefficients used to estimate concentrations of chloride and sodium from values of specific conductance for U.S. Geological Survey streamgage stations in the Scituate Reservoir drainage area, Rhode Island, from October 1, 2020, through September 30, 2021.[Data were collected by the U.S. Geological Survey (U.S. Geological Survey, 2023). Constituent concentrations, continuous specific conductance, and parameter codes are available in National Water Information System (U.S. Geological Survey, 2023). Locations of stations are shown in figure 1. Chloride is “Chloride, water filtered” (U.S. Geological Survey [USGS] parameter code 00940); sodium is “Sodium, water filtered” (USGS parameter code 00930); specific conductance is “Specific conductance, water, unfiltered, normalized to 25 degrees Celsius, laboratory” (USGS parameter code 90095) measured in microsiemens per centimeter at 25 degrees Celsius. PW, Providence Water; mg/L, milligram per liter; ft3/s, cubic foot per second; ≥, greater than or equal to]
MOVE.1 was chosen for regression analysis to maintain variance (Hirsch and Gilroy, 1984). Under some circumstances, specific conductance records were unavailable, possibly because of the following reasons: a sensor malfunctioned, was affected by debris, fouling, or ice, or was not submerged during low flow. In these cases, values of specific conductance were estimated by proportional distribution between recorded values. In general, the period of specific conductance record when streamflow occurred that was unavailable for each USGS station represents a small fraction of the record period for WY 2021 (table 3).
Data Collected by Providence Water
Water-quality samples were collected by PW at 36 fixed stations on tributaries draining to the Scituate Reservoir during WY 2021. Samples were scheduled to be collected monthly at 19 stations and quarterly at another 17 stations (table 1). A periodic water-quality sampling schedule was followed so that water-quality samples would be representative of various streamflow conditions. However, sometimes samples could not be collected because tributaries at the sampling stations were dry or frozen or because of inclement weather conditions. When possible, water-quality samples were collected by dipping the sample bottle into the tributary at the center of flow (Richard Blodgett, PW, written commun., 2005). Samples were transported on ice to PW water-quality laboratory at the P.J. Holton Water Purification Plant in Scituate. Water-quality properties and constituent concentrations were measured by using unfiltered water samples. These water-quality properties included pH, alkalinity, color, turbidity, and concentrations of chloride, nitrite, nitrate, orthophosphate, and Escherichia coli (E. coli) and total coliform bacteria; these data collected by PW are published in Smith and Spaetzel (2021). In this report, orthophosphate is the name for compounds with only one phosphate molecule, whereas phosphate is used to name any compound having one or more phosphate molecules. Analytical methods used for the determination of values or concentrations of pH, color, turbidity, alkalinity, and chloride are documented by Baird and others (2018). Concentrations of nitrite were determined by U.S. Environmental Protection Agency method 353.2 (U.S. Environmental Protection Agency, 1993). Concentrations of nitrate were determined by Standard Method 4500–NO3− (Holm and others, 2018). Concentrations of orthophosphate were determined by the Hach PhosVer Method (Hach Method 8048; Hach Company, 2000). Standard Method 9223 was used for the determination of concentrations of bacteria (Best and others, 2018).
Water-quality samples were collected by PW during a wide range of flow conditions. The WY 2021 measured or estimated daily mean flow-duration curves for the USGS streamgages at Westconnaug Brook (USGS station 01115276; PW station 8) and Shippee Brook (USGS station 01115200; PW station 25) are shown in figure 2. The curves represent the percentage of time that each flow was equaled or exceeded at the respective stations; the flows at each station on days when water-quality samples were collected are represented by the plotted points superimposed on the curves. At Westconnaug Brook, 11 samples were collected at flow rates that are exceeded between 16 and 95 percent of the time; this range indicates that the water-quality samples collected in WY 2021 represent a large range of the flow conditions but do not represent flows less than 1.7 ft3/s and greater than 14 ft3/s. At Shippee Brook, samples were collected only on a quarterly schedule at flow rates that are exceeded between 13 and 80 percent of the time; this range of flow rates excludes the flow conditions for both the lower (less than 0.74 ft3/s) and upper (greater than 15 ft3/s) flow range at Shippee Brook during WY 2021 (fig. 2).
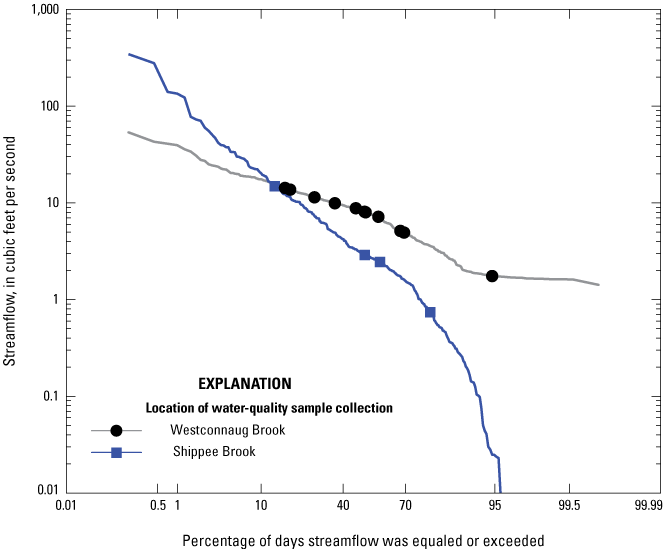
Graph showing flow-duration curves and streamflow on the dates (represented by points) when water-quality samples were collected by Providence Water at the Westconnaug Brook (station 01115276) and Shippee Brook (station 01115200) U.S. Geological Survey streamgages in Foster, Rhode Island, for water year 2021 (October 1, 2020, through September 30, 2021). Locations of stations are shown on figure 1. Modified from Breault (2009). Data are from Smith and Spaetzel (2021).
Estimating Daily, Monthly, and Annual Loads and Yields
Daily, monthly, and annual chloride and sodium loads (in kilograms) were estimated for all streamgages for which continuous-streamflow and specific-conductance data were available for WY 2021. Daily flow-weighted concentrations of chloride and sodium were calculated by multiplying instantaneous flows by concurrent concentrations of chloride and sodium (estimated from measurements of specific conductance) for each day and dividing the sum by the total flow for that day. At the three instrumented monitoring stations, where continuous flow was unavailable (table 1), daily mean concentrations of chloride and sodium were calculated from the daily mean value of specific conductance for each day. The latter method may result in less accurate concentrations because instantaneous measurements of specific conductance may change (decrease or increase) with surface-water runoff; however, the variability of instantaneous measurements of specific conductance at these streamgages was generally small and daily mean values did not differ substantially from daily flow-weighted values estimated during prior water years when instantaneous flow data were available. Daily loads of chloride and sodium were estimated by multiplying daily flow-weighted concentrations of chloride and sodium (in milligrams per liter) by daily discharge (in liters per day). Daily data were summed to estimate monthly or annual loads (converted to metric tons).
Daily loads of water-quality constituents (in samples collected by PW) were calculated for all sampling dates during WY 2021 (table 4) for which periodic- or continuous-streamflow data were available (table 1). These loads were calculated by multiplying constituent concentrations (in milligrams or colony forming units per liter) in single samples by the daily discharge (in liters per day) for the day on which each sample was collected. The flows, which in some cases were estimates, were assumed to be representative of the flow at the time of the sample collection. Loads (in million colony forming units per day, kilograms per day, or grams per day) and yields (in million colony forming units per day per square mile, kilograms per day per square mile, or grams per day per square mile) were calculated for bacteria, chloride, nitrite, nitrate, and orthophosphate. Censored data (concentrations reported as less than method detection limits) were replaced with concentrations equal to one half the method detection limit.
Table 4.
Daily loads of bacteria, chloride, nitrite, nitrate, and orthophosphate in the Scituate Reservoir drainage area, Rhode Island, from October 1, 2020, through September 30, 2021.[Data from Spaetzel and Smith (2021). Water-quality data are from samples collected and analyzed by Providence Water (PW). Locations of stations shown on figure 1. USGS, U.S. Geological Survey; ft3/s, cubic foot per second; CFU×106/d; millions of colony forming units per day; E. coli, Escherichia coli; kg/d, kilogram per day; g/d, gram per day as N, gram per day as nitrogen; g/d as P, gram per day as phosphate; <, less than; >, greater than]
Streamflow
Monitoring streamflow is a necessary step to measure the volume of water and estimate constituent loads to the Scituate Reservoir. The Ponaganset River is the largest monitored tributary to the Scituate Reservoir. Mean annual streamflow at the streamgage on the Ponaganset River (USGS station 01115187, PW station 35) for the entire period of its operation (mean of the annual mean streamflows for the period of record, WYs 1995–2020) before WY 2021 was 28.9 cubic feet per second (ft3/s; U.S. Geological Survey, 2023). During WY 2021, the annual mean streamflow of 32.4 ft3/s was just below the 75th percentile (33.2 ft3/s) for the period of record (fig. 3). Daily mean streamflows were commonly within the 10th and 90th percentile of all mean daily streamflows for WYs 1995–2020 and were similar to the median daily streamflows from December through June. Daily mean streamflows in WY 2021 were lower than the median long-term streamflows and 10th percentile values in October and November and were higher than the median daily streamflows and 90th percentile values from July through September (fig. 3). The other long-term continuous-record streamgage in the Scituate Reservoir drainage area is the Peeptoad Brook streamgage (USGS station 01115098; PW station 16). The mean annual streamflow at the Peeptoad Brook streamgage for the period of record (WYs 1995–2020) before WY 2021 was 10.4 ft3/s (U.S. Geological Survey, 2023). The annual mean streamflow at the Peeptoad Brook streamgage during WY 2021 also was higher than the mean annual streamflow for its period of record at 12.7 ft3/s. The annual mean measured or estimated streamflows for the other monitoring stations in this study ranged from 0.37 to 14.9 ft3/s (table 2).
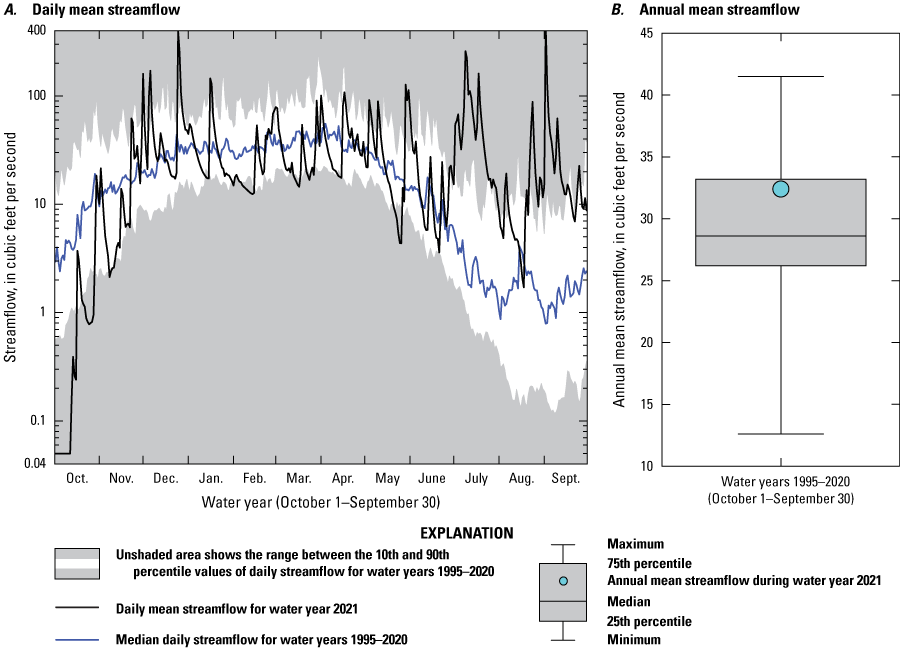
Hydrologic data taken at the U.S. Geological Survey streamgage on the Ponaganset River in Foster, Rhode Island (station 01115187). A, Graph showing measured daily mean streamflow for water year 2021 (October 1, 2020, through September 30, 2021) and the 10th percentile, median, and 90th percentile values of daily streamflow for water years 1995–2020 (October 1, 1994, through September 30, 2020). B, Boxplot showing annual mean streamflow during water year 2021 and the distribution of mean annual streamflows for water years 1995–2020. Location of station is shown on figure 1. Modified from Breault (2009). Data are from Smith and Spaetzel (2021).
Water Quality and Constituent Loads and Yields
Water-quality conditions in the Scituate Reservoir drainage area are described by summary statistics for water-quality properties, constituent concentrations, and estimated constituent loads and yields. Loads and yields measure the rates at which masses of constituents are transferred to the reservoir by tributaries. Tributaries with high flows tend to have high loads because the greater volume of water can carry more of the constituent to the reservoir per unit time than tributaries with low flows. Yield represents the constituent load per unit of drainage area and is calculated by dividing the load estimated for a streamgage by the drainage area for the monitoring station. Yields are useful for comparison among streamgages that have different drainage areas because each basin size and therefore total streamflow volume is normalized. Yields also are useful for examining potential differences among basin properties that may contribute to water quality in the reservoir.
Summary statistics include means and medians. For some purposes, median values are more appropriate because they are less likely to be affected by high or low concentrations (or outliers). Medians are especially important to use for summarizing a relatively limited number of values. In contrast, datasets that include a large number of values, such as continuously monitored streamflow and loads of chloride and sodium (estimated from measurements of specific conductance), are better summarized in terms of means because large datasets are more resistant to the effects of outliers than small datasets. Mean values also are particularly appropriate for measuring loads because outlier values, which typically represent large flows, are important to include in estimates of constituent masses delivered to receiving waters.
Uncertainties associated with measuring streamflow and specific conductance and with chloride and sodium sample collection, preservation, and analysis produce uncertainties in load and yield estimates. The load and yield estimates presented in the text and tables are the most likely values for chloride and sodium inputs from tributaries or their drainage basins, based on the available data and analysis methods. It may be best to discuss loads and yields in terms of a range within which the true values lie; however, the most likely values of loads and yields are presented for ease of discussion and presentation. The range within which the true values lie depends on the uncertainties in individual measurements of streamflow and concentration, which are difficult to quantify with the available information. The uncertainties associated with streamflow are commonly assumed to affect load and yield calculations more than the errors associated with measuring specific conductance or chemical analysis, and the uncertainties associated with estimated streamflow are greater than those associated with measured streamflow. The most likely values of loads and yields presented in the tables and text are sufficient for planning-level analysis of water quality in tributaries and their drainage basins.
Chloride and Sodium Loads and Yields Estimated From Specific-Conductance Monitoring Data
Chloride and sodium are constituents of special concern in the Scituate Reservoir drainage area. Chloride is difficult to remove from finished drinking water and can affect the taste and sodium is a constituent of potential concern for human health because some people on restricted diets might need to limit their sodium intake. Chloride and sodium are major constituents of road salt used for deicing, and several major roadways cross the Scituate Reservoir drainage area. State Routes 12 and 14 cut across the main body of the reservoir, and Route 116 parallels the eastern limb of the reservoir (fig. 1). Nimiroski and Waldron (2002) indicated that tributaries in basins with State-maintained roads had substantially higher concentrations of chloride and sodium than tributaries in basins with low road density, presumably because of deicing activities. Smith (2015b) indicated relations between concentrations of chloride collected from the tributaries to the Scituate Reservoir and total impervious area of the respective subbasins were significant; and Spaetzel and Smith (2022b) found 32 significant upward trends in tributary chloride concentrations at the 37 stations during WYs 1983–2019.
Monthly mean concentrations were calculated by dividing the total monthly load by the total discharge for the month. Estimated monthly mean chloride concentrations in tributaries of the Scituate Reservoir drainage area ranged from 7.9 to 100 milligrams per liter (mg/L) and estimated monthly mean sodium concentrations ranged from 5.6 to 58 mg/L (table 5). The highest monthly mean concentrations of chloride and sodium were estimated to be 100 and 58 mg/L, respectively, in the Rush Brook tributary to Regulating reservoir (USGS station 01115114; PW station 15) in October 2020. The estimated monthly mean concentrations for 13 of the 16 stations were highest or tied for highest during October 2020 compared with the estimated mean concentrations during the winter months. Monthly estimated mean concentrations were highest in November 2020 for Ponaganset River (USGS station 01115187; PW station 35), and highest in February 2021 for the unnamed tributary to Regulating reservoir (USGS station 01115120; PW station 18) and Swamp Brook (USGS station 01115187; PW station 38). The estimated monthly mean concentrations of chloride and sodium in Moswansicut stream (USGS station 01115170; PW station 19) remained consistent throughout the water year, ranging only by a maximum of 3 mg/L.
Table 5.
Monthly mean concentrations of chloride and sodium estimated from continuous measurements of specific conductance in the Scituate Reservoir drainage area, Rhode Island, from October 1, 2020, through September 30, 2021.[Data were collected by the U.S. Geological Survey (2023). Locations of stations are shown on figure 1. Monthly mean concentrations were calculated by dividing the monthly load by the total discharge for the month. PW, Providence Water; USGS, U.S. Geological Survey; Cl, chloride; Na, sodium; mg/L, milligram per liter; —, not applicable]
Annual mean concentrations were calculated by dividing the total annual load by the total discharge for the year. The highest annual mean concentrations of chloride and sodium were estimated to be 51 and 30 mg/L, respectively, in Moswansicut stream (USGS station 01115170; PW station 19; table 6). The stations on the Moswansicut Pond reservoir and the unnamed tributary to Regulating reservoir are in the more developed, northeastern part of the Scituate Reservoir drainage area (fig. 1.) The similarly high annual mean concentrations of 49 mg/L of chloride and 29 mg/L of sodium in Bear Tree Brook (USGS station 01115275; PW station 9) are the result of residual chloride and sodium leaching to groundwater from a formerly uncovered salt storage pile (Nimiroski and Waldron, 2002).
Table 6.
Estimated annual mean chloride and sodium concentrations, loads, and yields for streamgage stations in the Scituate Reservoir drainage area, Rhode Island, from October 1, 2020, through September 30, 2021.[Data were collected by the U.S. Geological Survey (2023). Locations of stations are shown on figure 1. Annual mean concentrations were calculated by dividing the annual load by the total discharge for the year; annual mean yields were calculated by dividing the sum of individual loads by the sum of the drainage area. PW, Providence Water; USGS, U.S. Geological Survey; Cl, chloride; mg/L, milligram per liter; Na, sodium; t/yr, metric ton per year; (t/yr)/mi2, metric ton per year per square mile; —, not applicable]
During WY 2021, the Scituate Reservoir received about 2,900 t of chloride and 1,800 t of sodium from tributaries that are equipped with instrumentation capable of continuously monitoring specific conductance (table 6). The highest annual chloride and sodium loads in the Scituate Reservoir drainage area during WY 2021 were estimated to be 500 and 320 t, respectively, at the Ponaganset River station (USGS station 01115187; PW station 35; table 6). Monthly estimated chloride and sodium loads tended to be lowest in October at each station (fig. 4). Monthly estimated chloride and sodium loads were both highest or tied for highest in December for 13 of the 16 stations. Monthly estimated chloride loads for Rush Brook (USGS station 01115114; PW station 15) were highest in March and April (31 t) but were similar to the December load of 30 t; monthly estimated sodium loads for Rush Brook were tied in December, March, and April (19 t). Hemlock Brook (USGS station 01115265; PW station 28) had the highest loads for chloride (37 t) and sodium (23 t) in April, and Swamp Brook (USGS station 01115278; PW station 38) had the highest loads for chloride (20 t) and sodium (12 t) in March (fig. 4). Monthly estimated chloride and sodium loads for Winsor Brook (USGS station 01115185; PW station 26) were highest in September (28 and 19 t, respectively) but similar to July (26 and 17 t, respectively; fig. 4).
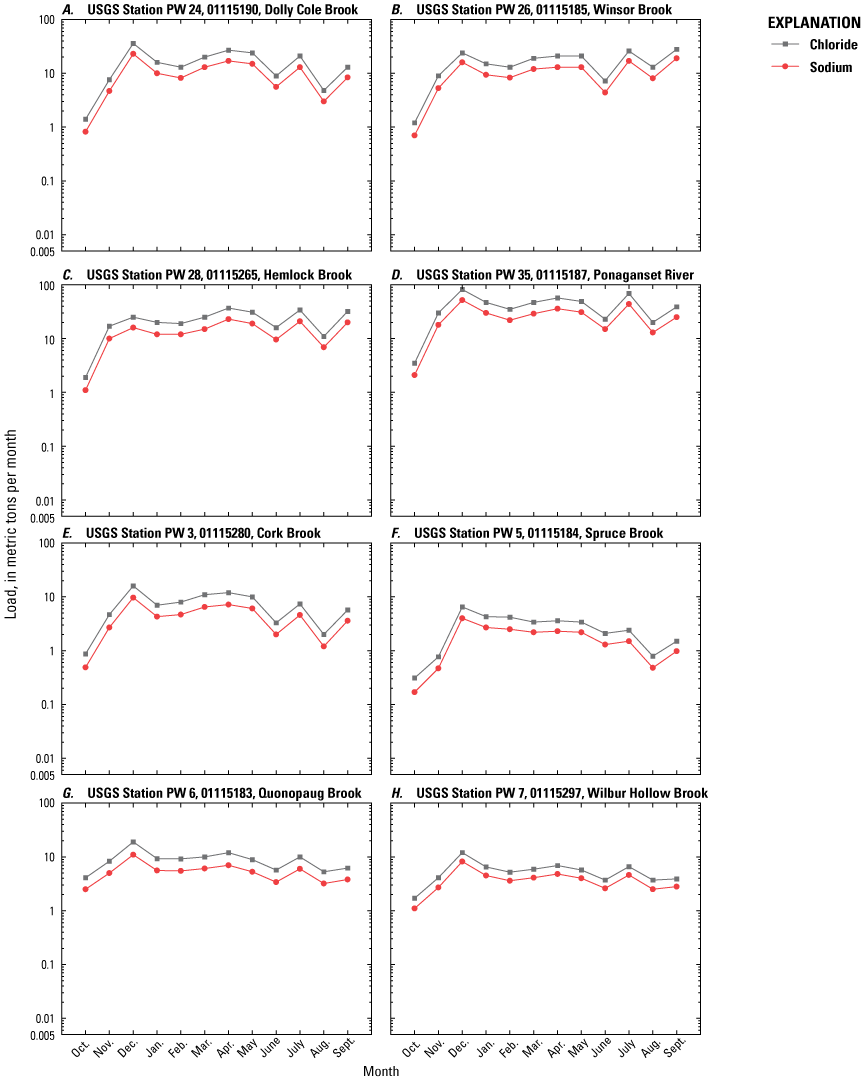
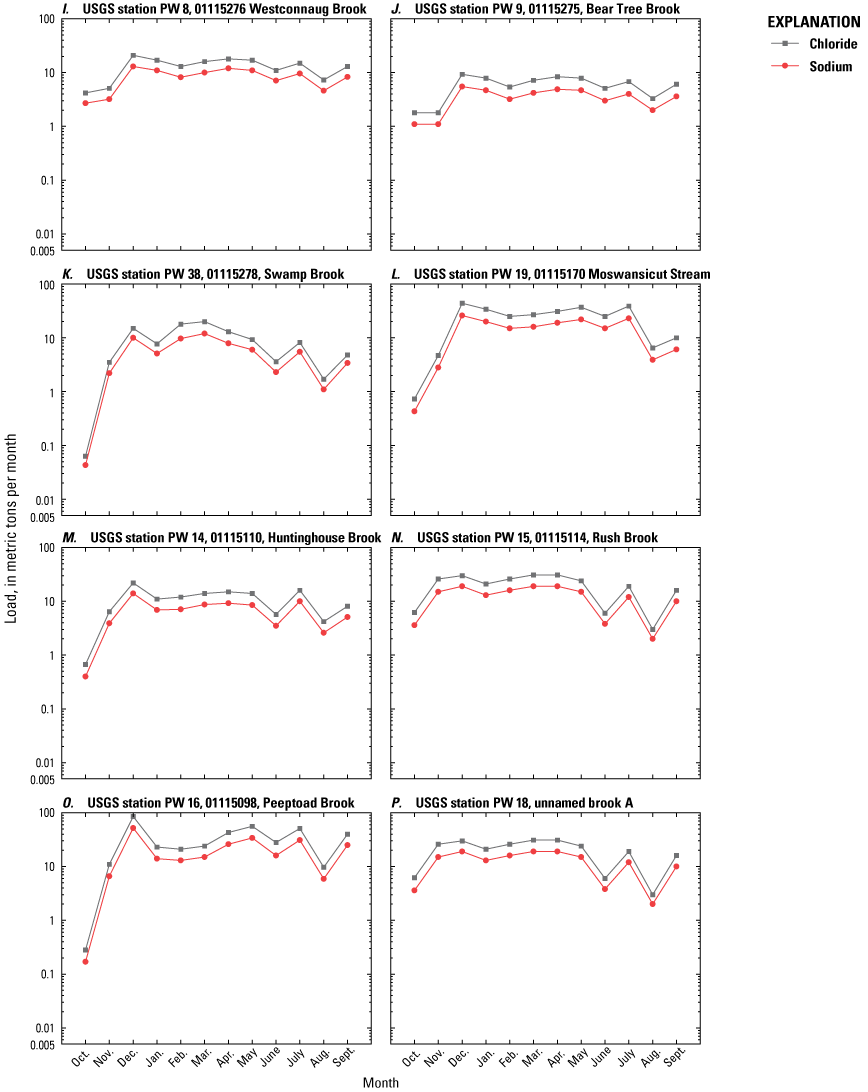
Graphs showing monthly loads of chloride and sodium estimated from streamflow and specific conductance data for water year 2021 (October 1, 2020, through September 30, 2021) at 16 Providence Water sampling stations with continuous-record U.S. Geological Survey (USGS) water-quality data in the Scituate Reservoir drainage area, Rhode Island. Locations of stations are shown on figure 1; station information is listed in table 1. Data are from Smith and Spaetzel (2021).
During WY 2021, estimated annual loads of chloride and sodium at the continuous streamgage stations were greater than the median estimated annual loads for WYs 2009–20 for 8 of the 16 USGS stations (fig. 5; note that two stations do not have estimates for WYs 2009–20). From December through April, the sum of the monthly estimated loads of chloride and sodium for the respective drainage areas upstream of each streamgage accounted for about 50 to 70 percent of the annual load of chloride and sodium (fig. 4). The Ponaganset River (USGS station 01115187; PW station 35), which accounts for 20 percent of the combined drainage area upstream from the 16 USGS streamgage stations, accounted for 17 percent of the combined annual load of chloride and sodium for the 16 USGS streamgage stations. Peeptoad Brook (USGS station 01115098; PW station 16) drains an area that is 7 percent of the combined drainage area upstream from the 16 USGS streamgage stations and had the second highest percentage (13 percent) of the combined annual load of chloride and sodium (table 6).
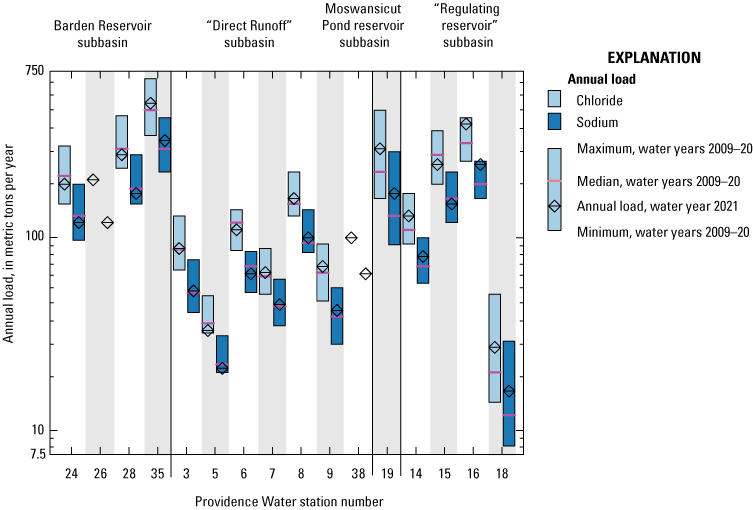
Graph showing annual loads of chloride and sodium estimated from streamflow and specific conductance data for water year 2021 (October 1, 2020, through September 30, 2021) and associated minimum, maximum, and median annual loads for water years 2009–20 (October 1, 2008, through September 30, 2020) at 16 Providence Water sampling stations with continuous-record U.S. Geological Survey water quality data in the Scituate Reservoir drainage area, Rhode Island. Locations of stations are shown on figure 1; station information is shown in table 1. Modified from Smith (2016). Data are from Smith and Spaetzel (2021).
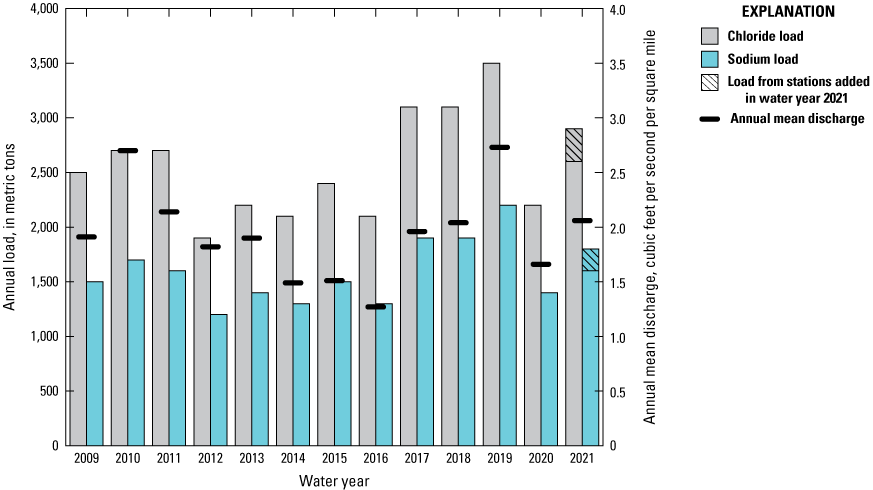
Bar chart showing estimated annual loads of chloride and sodium estimated from continuous measurements of streamflow and specific conductance and the annual mean discharge yield for water years 2009–21 (October 1, 2009, through September 30, 2021) for the area upstream from 16 Providence Water sampling stations in the Scituate Reservoir drainage area, Rhode Island. Locations of stations are shown on figure 1; station information is listed in table 1. Modified from Smith (2019a). Data are from Smith and Spaetzel (2021).
The sum of annual loads during WY 2021 for 14 stations with continuous monitoring in WYs 2009–20 was 17 percent greater than the sum of annual loads estimated during the previous water year and approximately equal to the average of WYs 2009–20 (fig. 6). The two additional stations (Swamp Brook [USGS station 01115187; PW station 38] and Winsor Brook [USGS station 01115185; PW station 26]) represent about 11 percent of the sum of annual loads of chloride and sodium (fig. 6). The annual mean discharge yield in cubic feet per second per square mile for WY 2021 was marginally greater (by 0.13 cubic foot per second per square mile) than the WY 2009–20 average.
The highest annual chloride and sodium yields were 110 and 68 metric tons per year per square mile ([t/yr]/mi2; table 6), respectively, measured at Bear Tree Brook (USGS station 01115275; PW station 9) in a small subbasin (0.62 mi2). These high yields were the result, in part, from chloride and sodium groundwater contamination (Nimiroski and others, 2008). Chloride and sodium yields for Ponaganset River (USGS station 01115187; PW station 35), the largest subbasin in the Scituate Reservoir watershed, were approximately three times lower at 36 and 23 (t/yr)/mi2, respectively, than the yields for Bear Tree Brook (USGS station 01115275; PW station 9). The estimated annual mean yields of chloride and sodium for the drainage area upstream from the 16 USGS streamgage stations were 52 and 32 (t/yr)/mi2 (table 6), respectively. These estimated annual mean yields of chloride and sodium for WY 2021 were greater than the estimated annual mean yields of chloride and sodium in the prior water year by about 49 and 45 percent, respectively (Smith, 2024).
Physical and Chemical Properties and Daily Loads and Yields Estimated From Data Collected by Providence Water
PW routinely measured four water-quality properties (pH, color, turbidity, and alkalinity), and concentrations of chloride, nitrite, nitrate, orthophosphate, total coliform bacteria, and E. coli bacteria in monthly or quarterly samples of tributary water. These data are general indicators of water-quality conditions in the Scituate Reservoir drainage area.
Physical and Chemical Properties
Physical and chemical properties including pH, turbidity, alkalinity, and color were routinely measured to determine water quality in each of the six subbasins in the Scituate Reservoir drainage area (table 7) by PW. Specifically, pH is a measure of the effective hydrogen-ion concentration (U.S. Geological Survey, 2021) representing the negative base-10 logarithm of hydrogen-ion activity of a solution, in moles per liter; color can be an indirect measure of the amount of organic carbon dissolved in the water column; turbidity is an indirect measure of suspended particles; and alkalinity is a measure of the buffer capacity of water.
Table 7.
Median values for water-quality data collected at Providence Water stations in the Scituate Reservoir drainage area, Rhode Island, from October 1, 2020, through September 30, 2021.[Data from Spaetzel and Smith (2021). Water-quality data are from samples collected and analyzed by Providence Water (PW). Locations of stations are shown on figure 1. If fewer than three samples were collected, the sample values are reported instead of a median. Minimum, median, and maximum values of all stations are based on station with more than two samples. USGS, U.S. Geological Survey; PCU, platinum-cobalt unit; NTU, nephelometric turbidity unit; CFU/100 mL, colony forming unit per 100 milliliters; E.coli., Escherichia coli; mg/L, milligram per liter; CaCO3, calcium carbonate; N, nitrogen; PO4, phosphate; <, less than; —, no data]
The median pH in tributaries in the Scituate Reservoir drainage area ranged from 5.7 to 7.0; the median of the medians for all stations with more than two samples was 6.3. Median values of color ranged from 17 to 250 platinum-cobalt units; the median for all stations was 42 platinum-cobalt units. Median values of turbidity ranged from 0.17 to 1.5 nephelometric turbidity units; the median for all stations was 0.57 nephelometric turbidity unit. Median alkalinity values in tributaries were low, ranging from 3.8 to 20 mg/L as calcium carbonate; the median for all stations was 7.6 mg/L alkalinity as calcium carbonate (table 7).
Constituent Concentrations and Daily Loads and Yields
Fecal indicator bacteria, chloride, and nutrients such as nitrogen and phosphorus are commonly detected in natural water; at elevated concentrations, these constituents can cause or contribute to water-quality impairments. Fecal indicator bacteria, which are found in the intestines of warm-blooded animals, may indicate impairment from sewage contamination or from livestock or wildlife that defecate in or near the stream margin. Chloride originates in tributary stream water from precipitation, weathering, or human activities such as waste disposal, use of septic systems, and road deicing. Sources of nutrients in tributary stream water include atmospheric deposition, leaching of naturally occurring organic material, discharge of groundwater that is enriched with nutrients from septic-system leachate, and runoff contaminated with fertilizer or animal waste. The ultimate intended use of water in the tributaries is drinking water, which must meet specific water-quality standards. For this reason, PW closely monitors concentrations of these constituents in tributaries. Median concentrations, loads, and yields of water-quality constituents are listed in tables 7, 8, and 9.
Table 8.
Median daily loads of bacteria, chloride, nitrite, nitrate, and orthophosphate in the Scituate Reservoir drainage area, Rhode Island, from October 1, 2020, through September 30, 2021.[Concentration data from Spaetzel and Smith (2021)]. Water-quality data are from samples collected and analyzed by Providence Water (PW). Locations of stations are shown on figure 1. USGS, U.S. Geological Survey; (CFU×106)/d; million colony forming units per day; E. coli, Escherichia coli; kg/d, kilogram per day; g/d, gram per day; N, nitrogen; PO4, phosphate; <, less than; —, not applicable]
Table 9.
Median daily yields of bacteria, chloride, nitrite, nitrate, and orthophosphate in the Scituate Reservoir drainage area, Rhode Island, from October 1, 2020, through September 30, 2021.[Concentration data from Spaetzel and Smith (2021). Water-quality data are from samples collected and analyzed by Providence Water (PW). Locations of stations shown on figure 1. USGS, U.S. Geological Survey; ([CFU×106]/d)/mi2; millions of colony forming units per day per square mile; E. coli, Escherichia coli; N, nitrogen; PO4, phosphate; (kg/d)/mi2, kilogram per day per square mile; (g/d)/mi2, gram per day per square mile; <, less than; —, not applicable]
Bacteria
Median concentrations of total coliform bacteria were above the detection limit (1 colony forming unit per 100 milliliters [CFU/100 mL]) at all sites (table 7). Median concentrations of E. coli were censored below detection limits of either 10, 25, or 31 CFU/100 mL at 11 of the 33 stations that had more than 2 samples collected in WY 2021. Median concentrations of E. coli were uncensored for 22 stations, and these concentrations ranged from 10 to 110 CFU/100 mL. For three stations, medians were not determined because fewer than three samples were collected, and these concentrations ranged from less than 10 to 63 CFU/100 mL. Total coliform bacteria concentrations were greater than E. coli concentrations (as expected because total coliform is a more inclusive measure than E. coli); the medians of median concentrations for all sites in the drainage area were 1,500 CFU/100 mL for total coliform bacteria and 30 CFU/100 mL for E. coli (table 7). The highest median concentration of total coliform bacteria, 4,900 CFU/100 mL, was at unnamed tributary 2 to Moswansicut Reservoir (USGS station 01115165; PW station 21) which drains a 0.30 mi2 area in the Moswansicut Pond reservoir subbasin (table 1). Median concentrations of total coliform bacteria exceeded 2,000 CFU/100 mL at eight other stations including Winsor Brook (USGS station 01115185; PW station 26), Brandy Brook (USGS station 01115180; PW station 1), Quonopaug Brook (USGS station 01115183; PW station 6), unnamed tributary 1 to Scituate Reservoir (USGS station 01115178; PW station 32), unnamed tributary 1 to Moswansicut Pond reservoir (USGS station 01115160; PW station 20), unnamed tributary from Kimball Reservoir (USGS station 01115164; PW station 34), Huntinghouse Brook (USGS station 01115110; PW station 14), and unnamed tributary to Westconnaug Reservoir (USGS station 01115273; PW station 11). Median concentrations of total coliform bacteria were lowest at Westconnaug Brook (USGS station 01115276; PW station 8). The highest median concentration of E. coli, 110 CFU/100 mL (table 7), also was at unnamed tributary 2 to Moswansicut Reservoir.
Median daily loads and yields of total coliform bacteria and E. coli varied by two orders of magnitude or more (tables 8 and 9). The median daily loads of total coliform bacteria for all subbasins in the Scituate Reservoir drainage area ranged from 4,800 to 340,000 million colony forming units per day ([CFU×106]/d), and yields ranged from 11,000 to 240,000 million colony forming units per day per square mile ([(CFU×106)/d]/mi2); E. coli loads ranged from less than 180 to 11,000 (CFU×106)/d, and yields ranged from 530 to 3,700 ([CFU×106]/d)/mi2 (table 8 and 9). The highest median daily yield of total coliform bacteria at 240,000 ([CFU×106]/d)/mi2 was at unnamed tributary to Westconnaug Reservoir (USGS station 01115273; PW station 11), and the E. coli median yield at this station may have been up to 4,600 ([CFU×106]/d)/mi2. The highest (uncensored) median daily yield of E. coli of 3,700 ([CFU×106]/d)/mi2 occurred at Quonopaug Brook (USGS station 01115183; PW station 6; table 9). Although relatively high for sampling stations in the Scituate Reservoir subbasin, median daily bacteria yields at these stations were low to moderate for yields of indicator bacteria in sewage-contaminated stream water or stream water affected by stormwater runoff in an urban environment (Breault and others, 2002).
Chloride
Median chloride concentrations among PW stations ranged from 7.1 to 71.4 mg/L. The highest median concentration was collected at unnamed tributary 1 to Moswansicut Pond reservoir (USGS station 01115160; PW station 20; table 7). The median of median concentrations for all sites in the drainage area was 23.7 mg/L (table 7), which is very similar to the median of median concentrations in WY 2020 (24.8 mg/L; Smith, 2024). Median daily chloride loads and yields estimated from samples collected by PW varied among monitoring stations in the drainage area (tables 8 and 9). Moswansicut Stream (USGS station 01115170; PW station 19) had the largest median daily chloride load at 980 kilograms per day, followed by Peeptoad Brook (USGS station 01115098; PW station 16) and Ponaganset River (USGS station 01115187; PW station 35) at 890 and 870 kilograms per day, respectively (table 8). The median daily chloride yield at Moswansicut stream was about five times greater than the median yield at Ponaganset River and was the maximum among all stations at 300 kilograms per day per square mile (table 9). The median daily chloride yield for monitored areas within the drainage area was 67 kilograms per day per square mile.
Nutrients
Median concentrations of nitrite and nitrate (table 7) were 0.002 and 0.08 mg/L as nitrogen, respectively. The highest median concentrations of nitrite (0.014 mg/L as nitrogen) and nitrate (1.10 mg/L as nitrogen) were at unnamed tributary 3 to Moswansicut Reservoir (USGS station 01115167; PW station 22). The median concentration of orthophosphate for the entire study area (table 7) was 0.05 mg/L as phosphate. The maximum median concentration of orthophosphate was 0.13 mg/L as phosphate measured in a sample collected at Fire Tower Stream (PW station 37). Median daily loads of nitrite were largest at Ponaganset River (USGS station 01115187; PW station 35) and Peeptoad Brook (USGS station 01115098; PW station 16) at 43 grams per day as nitrogen (g/d; table 8). Median daily loads of nitrate were largest at Peeptoad Brook (USGS station 01115098; PW station 16) at 3,200 g/d as nitrogen. Median daily orthophosphate loads were largest (1,700 g/d as phosphate) at Huntinghouse Brook (USGS station 01115110; PW station 14; table 8). The maximum median daily yield for nitrite was 26 grams per day per square mile ([g/d]/mi2) as nitrogen at Brandy Brook (USGS station 01115180; PW station 1), and the maximum median daily yield for nitrate was 2,400 (g/d)/mi2 as nitrogen at Bear Tree Brook (USGS station 01115275; PW station 9). The maximum yields for nitrite and nitrate were six times greater than the median yields among all stations which were equal to 4.2 and 400 [g/d]/mi2 as nitrogen, respectively. For orthophosphate, the maximum median daily yield was 360 (g/d)/mi2 as phosphate at unnamed tributary to Westconnaug Reservoir (USGS station 01115273; PW station 11), which also had the highest total coliform bacteria median yield. The maximum median daily yield of orthophosphate was two times greater than the median among all station medians (180 [g/d]/mi2 as phosphate). The medians of median daily loads were 12 g/d for nitrite as nitrogen, less than 700 g/d for nitrate as nitrogen, and 410 g/d for orthophosphate as phosphate (table 8), respectively.
Summary
Since 1993, the U.S. Geological Survey (USGS), in cooperation with Providence Water (PW), has maintained a long-term cooperative water-quality monitoring program within the Scituate Reservoir drainage area. PW also has been independently monitoring and assessing water quality in the reservoir and reservoir drainage area for more than 60 years. Together, the data collected by the USGS and PW are used to calculate concentrations, loads, and yields of chloride, sodium, nutrients, and bacteria for tributaries within Scituate Reservoir drainage area on an annual basis.
During water year (WY) 2021, the U.S. Geological Survey measured or estimated streamflow at 24 streamgages; 16 of these streamgages are equipped with instrumentation capable of continuously monitoring water level, specific conductance, and water temperature. Before WY 2021, 14 streamgages were equipped with continuous-monitoring instrumentation; therefore, for annual comparisons of total chloride and sodium loads measured in the drainage area over the WY 2009–20 period, loads from the two streamgages added in WY 2021 are omitted. Water-quality samples, that are analyzed for dissolved concentrations of major ions (including chloride and sodium), were periodically collected by the USGS at each of the 16 streamgages. Concentrations of chloride and sodium, collected during WY 2021 and in previous water years, were used to support and refine relations between each ion and specific conductance. Using equations to relate specific conductance to concentrations of chloride and sodium, and combined with measured or estimated streamflow data, monthly and annual concentrations, loads, and yields were estimated for the 16 streamgages.
At 16 of the 24 USGS streamgages, where both streamflow and continuous specific conductance data were available, estimated monthly mean chloride concentrations ranged from 7.9 to 100 milligrams per liter (mg/L) and estimated monthly mean sodium concentrations ranged from 5.6 to 58 mg/L in tributaries of the Scituate Reservoir drainage area. The highest annual mean concentrations of chloride and sodium were estimated to be 51 and 30 mg/L, respectively, in Moswansicut stream (USGS station 01115170; PW station 19) in the more developed, northeastern part of the Scituate Reservoir drainage area. An estimated 2,900 metric tons (t) of chloride and 1,800 t of sodium were transported to the Scituate Reservoir during WY 2021 from tributaries equipped with instrumentation; annual chloride yields for tributaries in the drainage area ranged from 15 to 110 metric tons per square mile (t/mi2), and annual sodium yields ranged from 10 to 68 t/mi2. The sum of annual loads during WY 2021 for 14 stations with continuous monitoring in WYs 2009–20 was 17 percent greater than the sum of annual loads estimated during the previous water year and approximately equal to the average of WYs 2009–20.
PW collected at least one water-quality sample at 36 of 38 sampling stations in WY 2021, including at 15 of the 16 USGS continuous-record streamgages, as part of their long-term sampling program in the Scituate Reservoir drainage area. In WY 2021, Toad Pond (USGS station 01115177; PW station 31) and Swamp Brook (USGS station 01115278; PW station 38) were not sampled. Water-quality samples are analyzed by PW for pH, color, turbidity, alkalinity, and concentrations of chloride, nutrients, and bacteria. Water-quality data collected by PW are summarized by using values of central tendency and are used in combination with periodic- or continuous-streamflow data available at 23 of the 36 stations sampled in WY 2021 to calculate loads and yields of chloride, nutrients, and bacteria.
For water samples collected by PW, the median of the median pH values for samples from all stations on tributaries in the Scituate Reservoir drainage area was 6.3; the median value for color was 42 platinum-cobalt units; the median value for turbidity was 0.57 nephelometric turbidity unit; and the median concentration for alkalinity was 7.6 mg/L as calcium carbonate. The medians of the median concentrations for water samples from all stations were 23.7 milligrams per liter for chloride, 0.002 milligram per liter as nitrogen for nitrite, 0.08 milligram per liter as nitrogen for nitrate, 0.05 milligram per liter as phosphate for orthophosphate, 1,500 colony forming units per 100 milliliters for total coliform bacteria and 30 colony forming units per 100 milliliters for Escherichia coli. The medians of the median daily loads were 180 kilograms per day for chloride, 12 grams per day as nitrogen for nitrite, less than 700 grams per day as nitrogen for nitrate, 410 grams per day as orthophosphate for phosphate, 71,000 million colony forming units per day for coliform bacteria, and less than 2,000 million colony forming units per day for Escherichia coli. The medians of the median yields were 67 kilograms per day per square mile for chloride, 4.2 grams as nitrogen per day per square mile for nitrite, 400 grams as nitrogen per day per square mile for nitrate, 180 grams as orthophosphate per day per square mile for phosphate, 46,000 million colony forming units per day per square mile for coliform bacteria, and 1,000 million colony forming units per day per square mile for Escherichia coli.
References Cited
Baird, R.B., Eaton, A.D., and Rice, E.W., eds., 2018, Standard methods for the examination of water and wastewater (23d ed.): American Public Health Association, American Water Works Association, and Water Environment Federation, [variously paged], accessed October 4, 2018, at https://www.standardmethods.org/.
Best, J., Cockerel, B.L., Jr., Dichter, G., Hall, N.H., Northeimer, W.W., Reynolds, V., and Solo-Gabriele, H., 2018, 9223—Enzyme substrate coliform test, in Baird, R.B., Eaton, A.D., and Rice, E.W., eds., Standard methods for the examination of water and wastewater (23d ed.): American Public Health Association, American Water Works Association, and Water Environment Federation, 4 p., accessed October 4, 2018, at https://www.standardmethods.org/doi/10.2105/SMWW.2882.194.
Breault, R.F., 2009, Streamflow, water quality, and constituent loads and yields, Scituate Reservoir drainage area, Rhode Island, water year 2002 (rev. April 2010): U.S. Geological Survey Open-File Report 2009–1041, 25 p. [Also available at https://doi.org/10.3133/ofr20091041.]
Breault, R.F., and Campbell, J.P., 2010a, Streamflow, water quality, and constituent loads and yields, Scituate Reservoir drainage area, Rhode Island, water year 2003: U.S. Geological Survey Open-File Report 2010–1043, 24 p. [Also available at https://doi.org/10.3133/ofr20101043.]
Breault, R.F., and Campbell, J.P., 2010b, Streamflow, water quality, and constituent loads and yields, Scituate Reservoir drainage area, Rhode Island, water year 2004: U.S. Geological Survey Open-File Report 2010–1044, 24 p. [Also available at https://doi.org/10.3133/ofr20101044.]
Breault, R.F., and Campbell, J.P., 2010c, Streamflow, water quality, and constituent loads and yields, Scituate Reservoir drainage area, Rhode Island, water year 2005: U.S. Geological Survey Open-File Report 2010–1045, 24 p. [Also available at https://doi.org/10.3133/ofr20101045.]
Breault, R.F., and Campbell, J.P., 2010d, Streamflow, water quality, and constituent loads and yields, Scituate Reservoir drainage area, Rhode Island, water year 2006: U.S. Geological Survey Open-File Report 2010–1046, 25 p. [Also available at https://doi.org/10.3133/ofr20101046.]
Breault, R.F., and Smith, K.P., 2010, Streamflow, water quality, and constituent loads and yields, Scituate Reservoir drainage area, Rhode Island, water year 2009: U.S. Geological Survey Open-File Report 2010–1275, 24 p. [Also available at https://doi.org/10.3133/ofr20101275.]
Breault, R.F., Sorenson, J.R., and Weiskel, P.K., 2002, Streamflow, water quality, and contaminant loads in the lower Charles River watershed, Massachusetts, 1999–2000: U.S. Geological Survey Water-Resources Investigations Report 02–4137, 131 p. [Also available at https://doi.org/10.3133/wri024137.]
Breault, R.F., Waldron, M.C., Barlow, L.K., and Dickerman, D.C., 2000, Water-quality conditions in relation to drainage basin characteristics in the Scituate Reservoir basin, Rhode Island, 1982–95: U.S. Geological Survey Water-Resources Investigations Report 00–4086, 46 p. [Also available at https://doi.org/10.3133/wri004086.]
Helsel, D.R., and Hirsch, R.M., 2002, Statistical methods in water resources: U.S. Geological Survey Techniques of Water-Resources Investigations, book 4, chap. A3, 522 p. [Also available at https://doi.org/10.3133/twri04A3. Superseded by USGS Techniques and Methods, book 4, chap. A3.]
Hirsch, R.M., 1982, A comparison of four streamflow record extension techniques: Water Resources Research, v. 18, no. 4, p. 1081–1088. [Also available at https://doi.org/10.1029/WR018i004p01081.]
Hirsch, R.M., and Gilroy, E.J., 1984, Methods of fitting a straight line to data—Examples in water resources: Journal of the American Water Resources Association, v. 20, no. 5, p. 705–711. [Also available at https://doi.org/10.1111/j.1752-1688.1984.tb04753.x.]
Holm, T.R., Bennett, J., Blakesley, R., Gleichauf, G.K., Jagessar, P.K., Lipps, W.C., Vilissova, N., and Woodall, M.A., 2018, 4500–NO3−—Nitrogen (nitrate), in Baird, R.B., Eaton, A.D., and Rice, E.W., eds., Standard methods for the examination of water and wastewater (23d ed.): American Public Health Association, American Water Works Association, and Water Environment Federation, 13 p., accessed October 4, 2018, at https://www.standardmethods.org/doi/10.2105/SMWW.2882.089.
Nimiroski, M.T., and Waldron, M.C., 2002, Sources of sodium and chloride in the Scituate Reservoir drainage basin, Rhode Island: U.S. Geological Survey Water-Resources Investigations Report 02–4149, 16 p. [Also available at https://doi.org/10.3133/wri024149.]
Nimiroski, M.T., DeSimone, L.A., and Waldron, M.C., 2008, Water-quality conditions and constituent loads, 1996–2002, and water-quality trends, 1983–2002, in the Scituate Reservoir drainage area, Rhode Island: U.S. Geological Survey Scientific Investigations Report 2008–5060, 55 p. [Also available at https://doi.org/10.3133/sir20085060.]
Ries, K.G., III, and Friesz, P.J., 2000, Methods for estimating low-flow statistics for Massachusetts streams: U.S. Geological Survey Water-Resources Investigations Report 00–4135, 81 p. [Also available at https://doi.org/10.3133/wri004135.]
Smith, K.P., 2013, Streamflow, water quality, and constituent loads and yields, Scituate Reservoir drainage area, Rhode Island, water year 2011: U.S. Geological Survey Open-File Report 2013–1127, 32 p., accessed June 23, 2024, at https://doi.org/10.3133/ofr20131127.
Smith, K.P., 2014, Streamflow, water quality, and constituent loads and yields, Scituate Reservoir drainage area, Rhode Island, water year 2012: U.S. Geological Survey Open-File Report 2013–1274, 30 p., accessed June 23, 2023, at https://doi.org/10.3133/ofr20131274.
Smith, K.P., 2015a, Streamflow, water quality, and constituent loads and yields, Scituate Reservoir drainage area, Rhode Island, water year 2013: U.S. Geological Survey Open-File Report 2015–1082, 31 p., accessed June 23, 2023, at https://doi.org/10.3133/ofr20151082.
Smith, K.P., 2015b, Water-quality trends in the Scituate reservoir drainage area, Rhode Island, 1983–2012: U.S. Geological Survey Scientific Investigations Report 2015–5058, 57 p. accessed June 23, 2023, at https://doi.org/10.3133/sir20155058.
Smith, K.P., 2016, Streamflow, water quality, and constituent loads and yields, Scituate Reservoir drainage area, Rhode Island, water year 2014: U.S. Geological Survey Open-File Report 2016–1051, 31 p., accessed June 23, 2023, at https://doi.org/10.3133/ofr20161051.
Smith, K.P., 2018a, Streamflow, water quality, and constituent loads and yields, Scituate Reservoir drainage area, Rhode Island, water year 2015: U.S. Geological Survey Open-File Report 2018–1065, 28 p., accessed June 23, 2023, at https://doi.org/10.3133/ofr20181065.
Smith, K.P., 2018b, Streamflow, water quality, and constituent loads and yields, Scituate Reservoir drainage area, Rhode Island, water year 2016: U.S. Geological Survey Open-File Report 2018–1065, 32 p., accessed June 23, 2023, at https://doi.org/10.3133/ofr20181084.
Smith, K.P., 2018c, Water quality data from the Providence Water Supply Board for tributary streams to the Scituate Reservoir, water year 2015: U.S. Geological Survey data release, accessed 2018 at https://doi.org/10.5066/F7FJ2FR5.
Smith, K.P., 2018d, Water quality data from the Providence Water Supply Board for tributary streams to the Scituate Reservoir, water year 2016: U.S. Geological Survey data release, accessed 2018 at https://doi.org/10.5066/F7Z60NC5.
Smith, K.P., 2019a, Streamflow, water quality, and constituent loads and yields, Scituate Reservoir drainage area, Rhode Island, water year 2017: U.S. Geological Survey Open-File Report 2018–1039, 33 p., accessed June 23, 2023, at https://doi.org/10.3133/ofr20191039.
Smith, K.P., 2019b, Water quality data from the Providence Water Supply Board for tributary streams to the Scituate Reservoir, water year 2017: U.S. Geological Survey data release, accessed 2019 at https://doi.org/10.5066/P9PPAKP6.
Smith, K.P., 2021, Water quality data from the Providence Water Supply Board for tributary streams to the Scituate Reservoir, water year 2018–19: U.S. Geological Survey data release, accessed 2021 at https://doi.org/10.5066/P9WK8N0F.
Smith, K.P., 2022a, Streamflow, water quality, and constituent loads and yields, Scituate Reservoir drainage area, Rhode Island, water year 2018: U.S. Geological Survey Data Report 1144, 36 p., accessed June 23, 2023, at https://doi.org/10.3133/dr1144.
Smith, K.P., 2022b, Streamflow, water quality, and constituent loads and yields, Scituate Reservoir drainage area, Rhode Island, water year 2019: U.S. Geological Survey Data Report 1145, 35 p., accessed June 23, 2023, at https://doi.org/10.3133/dr1145.
Smith, K.P., 2024, Streamflow, water quality, and constituent loads and yields, Scituate Reservoir drainage area, Rhode Island, water year 2020: U.S. Geological Survey Data Report 1192, 31 p., https://doi.org/10.3133/dr1192.
Smith, K.P., and Breault, R.F., 2011, Streamflow, water quality, and constituent loads and yields, Scituate Reservoir drainage area, Rhode Island, water year 2010: U.S. Geological Survey Open-File Report 2011–1076, 26 p., accessed June 23, 2023, at https://doi.org/10.3133/ofr20111076.
Smith, K.P., and Spaetzel, A.B., 2021, Water-quality data from the Providence Water Supply Board for tributary streams to the Scituate Reservoir (ver. 3.0, 2023): U.S. Geological Survey data release, https://doi.org/10.5066/P9WK8N0F. [First published as version 1.0 in 2021 by author K.P. Smith.]
Spaetzel, A.B., and Smith, K.P., 2022a, Water-quality, streamflow, and quality-control data supporting estimation of nutrient and sediment loads in the Scituate Reservoir drainage area, Rhode Island, water years 2016–19: U.S. Geological Survey data release, at https://doi.org/10.5066/P98XCK0R.
Spaetzel, A.B., and Smith, K.P., 2022b, Water-quality conditions and constituent loads, water years 2013–19, and water-quality trends, water years 1983–2019, in the Scituate Reservoir drainage area, Rhode Island: U.S. Geological Survey Scientific Investigations Report 2022–5043, 102 p., accessed June 12, 2024, at https://doi.org/10.3133/sir20225043.
Tasker, G.D., and Driver, N.E., 1988, Nationwide regression models for predicting urban runoff water quality at unmonitored sites: Journal of the American Water Resources Association, v. 24, no. 5, p. 1091–1101. [Also available at https://doi.org/10.1111/j.1752-1688.1988.tb03026.x.]
U.S. Environmental Protection Agency, 1993, Method 353.2, revision 2.0—Determination of nitrate-nitrite nitrogen by automated colorimetry: U.S. Environmental Protection Agency, [variously paged], accessed June 10, 2016, at https://www.epa.gov/sites/production/files/2015-8/documents/method_353-2_1993.pdf.
U.S. Geological Survey, 2021, Measurement of pH: U.S. Geological Survey Techniques and Methods, book 9, chap. A6.4, 21 p., accessed June 10, 2024, at https://doi.org/10.3133/tm9A6.4. [Supersedes USGS Techniques of Water-Resources Investigations, book 9, chap. A6.4, version 2.0.].
U.S. Geological Survey, 2023, USGS water data for the nation: U.S. Geological Survey National Water Information System database, accessed July 24, 2023, at https://doi.org/10.5066/F7P55KJN.
Wagner, R.J., Boulger, R.W., Jr., Oblinger, C.J., and Smith, B.A., 2006, Guidelines and standard procedures for continuous water-quality monitors—Station operation, record computation, and data reporting: U.S. Geological Survey Techniques and Methods, book 1, chap. D3, 96 p., accessed April 10, 2006, at https://doi.org/10.3133/tm1D3. [Supersedes USGS Water-Resources Investigation Report 00–4252.]
Conversion Factors
Datums
Vertical coordinate information is referenced to the North American Vertical Datum of 1988 (NAVD 88).
Horizontal coordinate information is referenced to the North American Datum of 1983 (NAD 83).
Supplemental Information
Concentrations of constituents in water are given in either milligrams per liter (mg/L) or colony forming units per 100 milliliters (CFU/100 mL).
Loads of bacteria in water are given in million colony forming units per day).
Yields of bacteria are given in million colony forming units per day per square mile ([(CFU×106)/d]/mi2).
Specific conductance is given in microsiemens per centimeter at 25 degrees Celsius (µS/cm at 25 °C).
Color is given in platinum-cobalt units (PCU).
A water year is the period from October 1 to September 30 and is designated by the year in which it ends; for example, water year 2020 was from October 1, 2019, to September 30, 2020.
For more information, contact
Director, New England Water Science Center
U.S. Geological Survey
10 Bearfoot Road
Northborough, MA 01532
or visit our website at
https://www.usgs.gov/centers/new-england-water
Publishing support provided by the Pembroke Publishing Service Center
Disclaimers
Any use of trade, firm, or product names is for descriptive purposes only and does not imply endorsement by the U.S. Government.
Although this information product, for the most part, is in the public domain, it also may contain copyrighted materials as noted in the text. Permission to reproduce copyrighted items must be secured from the copyright owner.
Suggested Citation
Smith, K.P., and Spaetzel, A.B., 2024, Streamflow, water quality, and constituent loads and yields, Scituate Reservoir drainage area, Rhode Island, water year 2021: U.S. Geological Survey Data Report 1203, 34 p., https://doi.org/10.3133/dr1203.
ISSN: 2771-9448 (online)
Study Area
| Publication type | Report |
|---|---|
| Publication Subtype | USGS Numbered Series |
| Title | Streamflow, water quality, and constituent loads and yields, Scituate Reservoir drainage area, Rhode Island, water year 2021 |
| Series title | Data Report |
| Series number | 1203 |
| DOI | 10.3133/dr1203 |
| Publication Date | December 09, 2024 |
| Year Published | 2024 |
| Language | English |
| Publisher | U.S. Geological Survey |
| Publisher location | Reston, VA |
| Contributing office(s) | New England Water Science Center |
| Description | Report: vi, 34 p.; Data Release |
| Country | United States |
| State | Rhode Island |
| Other Geospatial | Scituate Reservoir Drainage Area |
| Online Only (Y/N) | Y |
| Additional Online Files (Y/N) | N |