

Parentage and Sibship Relationships Among Captive Snakes at the Phoenix Zoo—2024 Data Summary
Links
- Document: Report (2.9 MB pdf) , HTML , XML
- Data Release: USGS Data Release - Microsatellite loci for Mogollon narrowheaded gartersnake (Thamnophis rufipunctatus) and the northern Mexican gartersnake (Thamnophis eques megalops) in Arizona and New Mexico (2020–2021)
- Download citation as: RIS | Dublin Core
Acknowledgments
The authors would like to thank the Arizona Center for Nature Conservation/Phoenix Zoo for partial funding of this research, in particular, Tara Harris and Whitney Heuring for their continued support and coordination efforts. We also thank the Arizona Game and Fish Department, in particular, Thomas Jones and Mason Ryan for support and coordination efforts related to tissue samples. The authors would like to thank Julia Smith (U.S. Geological Survey), who assisted in the data collection for this project.
Introduction
The narrow-headed gartersnake (Thamnophis rufipunctatus) is listed as threatened under the Endangered Species Act (U.S. Fish and Wildlife Service, 2014). This species has a strong association with aquatic habitats, and these habitats have been highly altered by impoundments, land-use changes, and the introduction and spread of non-native aquatic species, which contributed to declines in Arizona and New Mexico for the last 30–40 years. Captive breeding programs can be used for genetic rescue and conservation of threatened and endangered species (Frankham, 2010). Often based on pedigree analyses, captive management plans aim to retain genetic diversity, limit inbreeding, and avoid adaptation to captivity (Foose and Ballou, 1988; Hedrick and Miller, 1992; Ivy and others, 2009; Frankham, 2010). In 2011, the Arizona Center for Nature Conservation/Phoenix Zoo (hereafter Phoenix Zoo) developed an ex-situ captive breeding management plan for T. rufipunctatus, with the aim to propagate and release individual T. rufipunctatus back into their native range (Blais and others, 2022). We sequenced 125 microsatellite loci to generate genetic toolsets to track pedigree and assess paternity and sibship relationships for this captive breeding program. Specifically, we used microsatellite loci to assign paternity and relatedness among eight litters composed of multiple female and male snakes born between 2014 and 2023 at the Phoenix Zoo breeding facility. We also completed sibship analysis for six wild gartersnakes collected from Canyon Creek, Arizona, that were brought into the Phoenix Zoo breeding facility in 2017 and 2018.
Methods
Tissue Sample Preparation and Loci Development
Small quantities of blood were collected by venal puncture at the Phoenix Zoo and transferred onto Gensaver 2.0 cards (GenTegra, Pleasanton, California). Blood cards were stored in envelopes at room temperature with silica beads until extraction at the Western Ecological Research Center San Diego Field Station genetics laboratory. All samples were extracted with the Gentra Puregene Kit (Qiagen, Hilden, Germany) according to the manufacturer’s protocol, with minor modifications, including cell lysis in the presence of Proteinase K and dithiothreitol, an overnight deoxyribonucleic acid (DNA) precipitation step, and 5–30 minutes centrifugation steps at 21,194 relative centrifugal force and 4 degrees Celsius (°C). We quantified DNA concentration on a Qubit fluorometer (Life Technologies, Carlsbad, Calif.).
Microsatellites used for this study were developed by Wood and others (2022) and more information can be found in the U.S. Geological Survey (USGS) data release (Wood and others, 2022). We provide some details in the following sections. For initial marker discovery, a tetrameric enriched genomic library was created and sequenced on an Illumina MiSeq with paired 250 base-pair (bp) reads (Nali and others, 2014). SeqMan NGen (version 11, DNASTAR, Inc., Madison, Wisconsin) was used to generate a de novo assembly from the paired fastq files (raw data). Next, the fasta files generated from the previous step were used to scan for microsatellite loci and primer pairs with the program msatcommander 1.0.8_beta (Rozen and Skaletsky, 2000; Faircloth, 2008). To develop the microsatellite multiplex panels, we selected approximately 500 unique loci, appended the Nextera tags to the 5-prime end of the forward and reverse primers (5’-TCGTCGGCAGCGTCAGATGTGTATAAGAGACAG was appended to each forward primer, 5’-GTCTCGTGGGCTCGGAGATGTGTATAAGAGACAG to each reverse primer), and generated lists of primer pairs forming primer-dimers using a Multiple Primer Analyzer (MPA; https://www.thermofisher.com/us/en/home/brands/thermo-scientific/molecular-biology/molecular-biology-learning-center/molecular-biology-resource-librar y/thermo-scientific-web-tools/multiple-primer-analyzer.html). We used the following process to ensure that the designed multiplexes would have minimal interference from primer-dimer formation. First, we ran a custom R script to cluster the loci into five groups that would minimize primer-dimer formation (using primer-dimer lists generated by MPA). Next, we selected 32 loci per group that had the lowest number of primer-dimers, and we tested each locus for successful amplification using 2 DNA samples. Finally, we selected 25 successfully amplifying loci from each of the 5 groups (herein referred to as multiplex) for a total of 125 loci genotyped for T. rufipunctatus (app. 1; Wood and others, 2022).
Microsatellite loci were genotyped using a multiplex polymerase chain reaction (PCR) protocol for targeted amplicon sequencing, which is briefly outlined in the next section (see D’Aloia and others [2017] and Wood and others [2022] for more details on the multiplex PCR and Nextera barcoding methods). We amplified the set of 125 loci in 5 multiplex PCR reactions across all samples, 25 loci per mix, with QIAGEN Multiplex PCR kits. Multiplexes were pooled by sample, and the samples were barcoded using Illumina’s S5 and N7 Nextera primers (Illumina, Inc., San Diego, Calif.) for the barcoding PCR. Before sequencing, all barcoded individual libraries were pooled into a single library and cleaned with Ampure XP beads (Beckman Coulter, Brea, Calif.). Finally, each library was diluted to a 2-nanomolar (nM) concentration and sequenced on an Illumina MiSeq with paired 150 bp reads.
Loci Verification
To evaluate the microsatellite loci, we used a subset of genetic samples from a previous study (Wood and others, 2018) that were representative of wild sites occupied by T. rufipunctatus throughout Arizona and New Mexico. We selected 142 individuals from 8 sites throughout the Verde River, Salt River, San Francisco River, and Gila River Basins.
We used a custom Python script called “amplicon” (https://bitbucket.org/cornell_bioinformatics/amplicon) to extract reads from the Illumina runs, assign them to the appropriate locus and individual, and identify the top two haplotypes for individuals at all loci (in other words, their diploid genotypes). We used the default options except for the following parameters: -c 1 (minimum number of samples per haplotype), -a 0.001 (minimum minor allele frequency), -l 75 (minimum haplotype length), and -r 5 (maximum read count ratio between the two alleles in each sample). We also applied an additional missing data filter after running the script to remove loci with greater than 20-percent missing data and individuals with greater than 10-percent missing data. We used the R packages adegenet v.2.1.3 (Jombart and Ahmed, 2011) and poppr v.2.9.1 (Kamvar and others, 2014) to estimate the number of alleles, expected heterozygosity, and to determine if any loci were out of Hardy-Weinberg equilibrium (HWE). We used the method of Brookfield (1996) to estimate the frequency of null alleles for each locus with the R package popgenreport (Adamack and Gruber, 2014), and we removed any locus with an estimated null allele frequency greater than 0.3, following the recommendations of Dakin and Avise (2004). We also tested for linkage disequilibrium among loci using the R package genepop v.1.2.2 (Rousset, 2008) with 5,000 iterations.
Paternity and Sibship Analysis
We assigned paternity and relatedness among eight litters composed of multiple female and male snakes born between 2014 and 2023 at the Phoenix Zoo breeding facility. We also completed a sibship analysis for six wild-caught gartersnakes from Canyon Creek that were brought into the Phoenix Zoo breeding facility in 2017 and 2018. We describe all snakes by their identification numbers that were individually assigned by the Phoenix Zoo for tracking purposes.
We used the program “Colony” (Wang, 2004; Jones and Wang, 2010) to estimate paternity assignments and relatedness among snakes. This program estimates the likelihood that offspring are related to each other, whether full siblings or half siblings, and estimates the likelihood that any genotyped adult male included in the analysis is the father. A total of eight breeding groups were analyzed separately. Each analysis included genotypes of known mother-offspring relationships and genotypes for as many as four adult males that were strategically grouped with a female in the same enclosure to allow free engagement in courtship and breeding behavior. Using the allele frequencies and known mother-offspring relationships, “Colony” generates expected genotypes of the males contributing to each offspring in a litter with a 95-percent confidence level. “Colony” settings were dioecious and diploid species, no inbreeding, polygamous mating system for males and females, full sibship size scaling, weak maternal and paternal likelihood priors that parents are included in the dataset, and five runs each with the full-likelihood analysis method with high precision. We also completed analyses using varying genotyping error rates (0–2 percent) to assess the accuracy of our results.
We estimated pairwise relatedness for all snakes (past and present) in the Phoenix Zoo using the package “related” v1.0 (Pew and others, 2015) accessed through R version 4.2.2 (R Core Team, 2022). For pairwise estimates of relatedness, we used two estimators. The first was the pairwise estimate of relatedness (Rqg) from Queller and Goodnight (1989), which was devised to estimate the average degree of relatedness within groups. We also used the pairwise estimate of relatedness (Rw) from Wang (2002) because this estimator was reported to handle better the uncertainty in allele frequency estimates than the Rqg estimator. We computed 95-percent confidence intervals for each of these point estimates. We used the simdata function in “related” to compare estimates of relatedness for Rqg and Rw using 100 simulated individuals based on our data. Using the simulated individuals, we computed estimates for each relatedness type (fullsib [FS], halfsib [HS], parent-offspring, unrelated) and calculated the correlation coefficient between the observed and expected values for each estimator.
Results and Discussion
Loci Verification and Relatedness Comparisons
Using the wild dataset for loci evaluation, we identified and removed 37 loci with greater than 20-percent missing data and 1 additional locus that was monomorphic. We also identified 4 loci that indicated significant deviation from Hardy-Weinberg equilibrium, 10 loci with null allele frequencies greater than 0.3, and 3 loci with significant linkage disequilibrium. These 55 loci were removed before further analysis with the captive dataset. Locus evaluation and filtering steps resulted in a total of 70 loci used for sibship, relatedness, and individual heterozygosity estimation (app. 1).
Comparisons between the relatedness estimators (Rqg and Rw) using 100 simulated individuals for each relatedness type (fullsib, halfsib, parent-offspring, unrelated) were similar (fig. 1), and the correlation coefficient between the expected and observed values for each estimator were high (Rqg=0.935 and Rw=0.938). For all comparisons of relatedness reported, we only report Rw (Wang, 2002). We provide pairwise relatedness for all breeders (past and present) in the Phoenix Zoo in appendix 2.
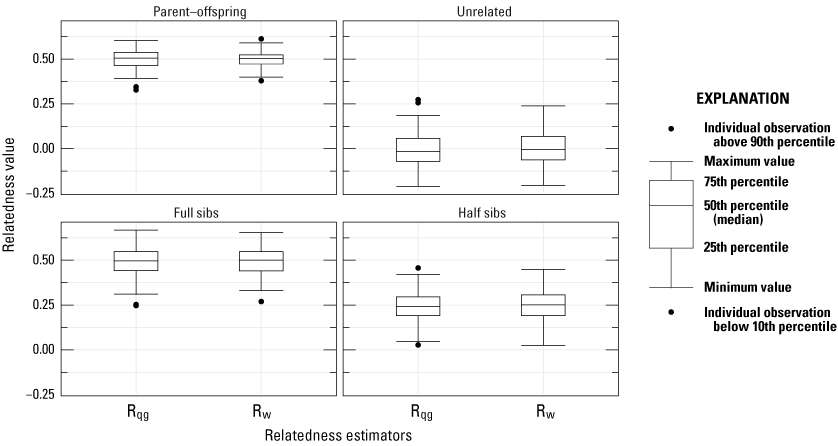
Comparisons between the relatedness estimators (Rqg and Rw) using 100 simulated individuals for each relatedness type (fullsib, halfsib, parent-offspring, unrelated). Boxplots represent the interquartile range with a horizontal line indicating the median, and the whiskers extend to the 90th and 10th percentiles, respectively. The colored circles indicate outlier samples more than 1.0 times the interquartile range from the top or bottom of the box.
Relatedness of Wild Caught Snakes from Canyon Creek
“Colony” inferred fullsib and halfsib relationships among the snakes collected from Canyon Creek between 2016 and 2018. One pair of snakes has an inferred full-sibling relationship with greater than 0.95 probability and pairwise estimates of relatedness greater than 0.5 (table 1). This full-sibling relationship consisted of a male (13547) and a female (13548) that were collected from Canyon Creek in 2017. One pair of snakes has an inferred half-sibling relationship with greater than 0.95 probability and pairwise estimates of relatedness greater than 0.28 (table 1). This half-sibling relationship consisted of two males (13943 and 13946) collected from Canyon Creek in 2018. The remaining snakes collected from Canyon Creek indicated high relatedness estimates, and “Colony” results indicated half-sibling relationships, but the relationship could not be inferred with confidence (p<0.95; table 1).
Table 1.
Sib-ship and pairwise relatedness estimation among Canyon Creek snakes collected in 2016–17.[Inferred relationship: FS, full-sib; HS, half-sib. Abbreviations: CI, confidence interval; Ind, individual snake identity of pairwise comparison; Prob, probability of the inferred relationship from “Colony” (Wang, 2004); Rw, pairwise estimate of relatedness (Wang, 2002); %, percent]
Paternity and Relatedness
We completed paternity analyses of known mother-offspring relationships that resulted from cohabitation, with as many as four males in 2014, 2019, 2022, and 2023. In 2014, female 11345 was paired with two males (12303 and 10809). “Colony” inferred male 12303 as the sire of the six offspring genotyped, and pairwise Rw values between the dam and inferred sire were consistent with this inference (fig. 2). Pairwise Rw values between male 10809 and offspring were low, indicating that there was no relationship with the other male housed with dam 11345 and the offspring.
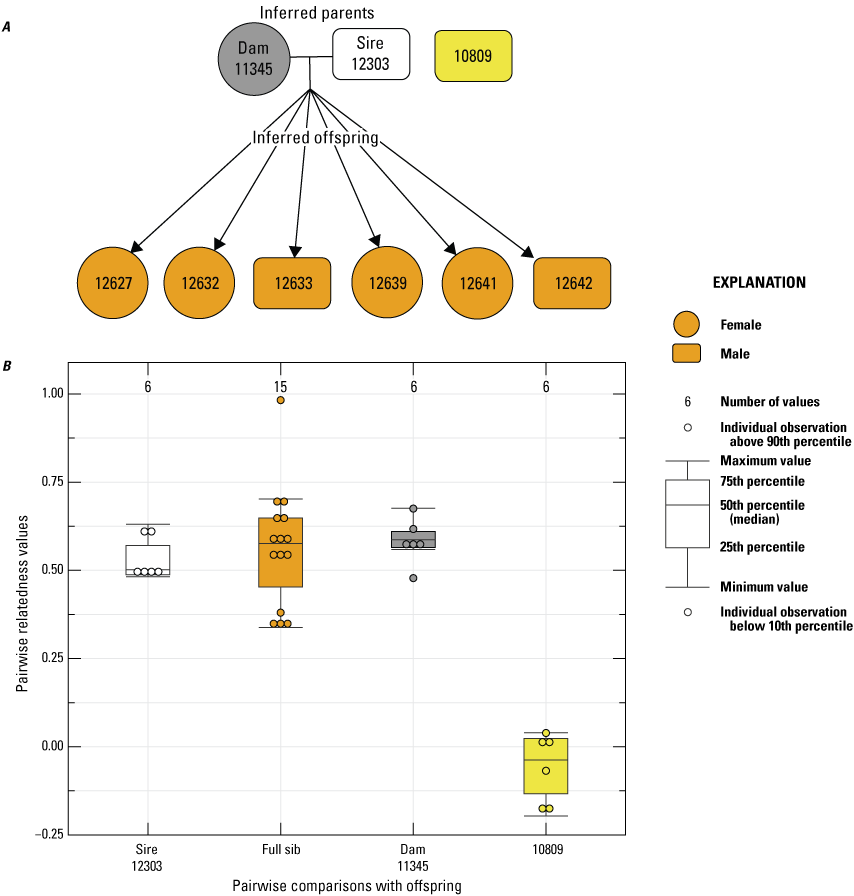
Pedigree inferred from the 2014 breeding group using the relationships from “Colony,” where A, a horizontal line connects inferred parents, and inferred offspring are indicated by arrows (circles indicate female, and rectangles indicate male); B, pairwise relatedness values (Rw; Wang, 2002) on the y-axis estimated for each comparison with the offspring on the x-axis between the inferred sire 12303, the offspring (fullsibs [FS]), the offspring and dam 11345, and the offspring and unrelated male 10809. Boxplots represent the interquartile range with a horizontal line indicating the median, and the whiskers extend to the 90th and 10th percentiles, respectively. Colored dots indicate the sample comparisons with each offspring.
In 2019, the paternity of seven offspring born from a single female (12627) were inferred to be from two sires (13546 and 13547) with high probability (fig. 3). Because of higher-than-average relatedness (Rw=0.29) between the two sires, we ran additional paternity analyses where we removed one of the inferred sires from the dataset and reran “Colony” again, each with only one or the other sire present in the dataset to assess confidence in the number and probability of paternity inference. In both instances, two sires were still inferred: one sampled from the data and one inferred from the data but not sampled, and the probability of multiple paternity was still greater than 0.95. Two other males also were excluded from paternity (13943 and 10809).
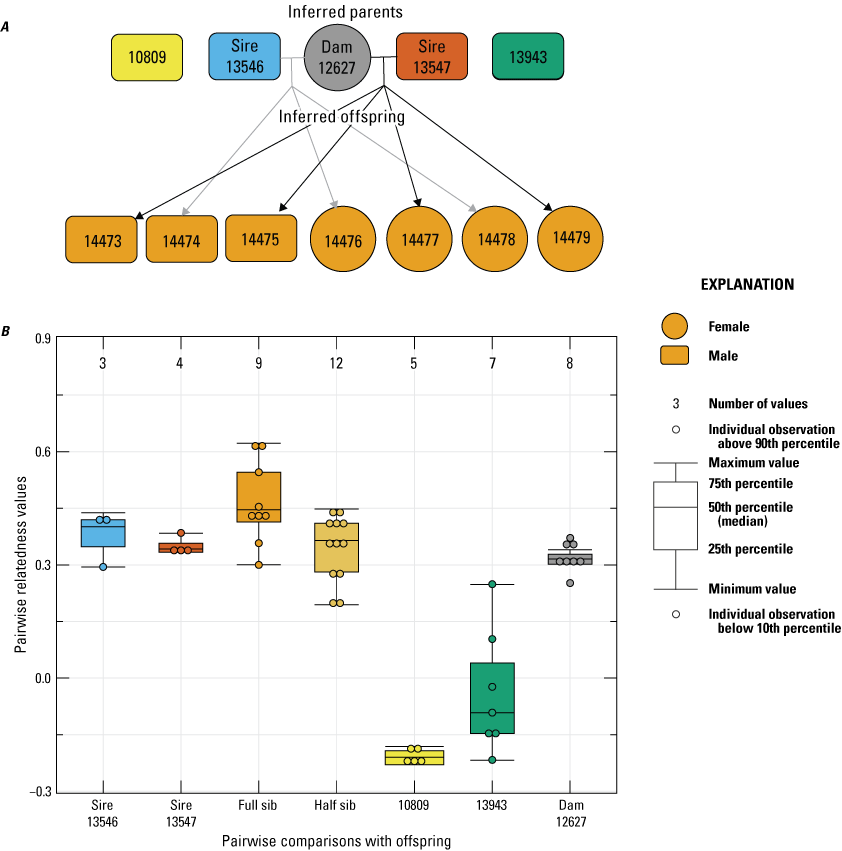
Pedigree inferred from the 2019 breeding group using the relationships from “Colony,” where A, a horizontal line connects inferred parents, and inferred offspring are indicated by arrows (circles indicate female, and rectangles indicate male); B, pairwise relatedness values (Rw; Wang, 2002) on the y-axis estimated for each relationship comparison on the x-axis between the offspring and the inferred sires (13546 and 13547), the offspring (fullsibs [FS] and halfsibs [HS]), the offspring and unrelated males (10809 and 13943), and the offspring and dam 12627. Boxplots represent the interquartile range with a horizontal line indicating the median, and the whiskers extend to the 90th and 10th percentiles, respectively. Colored dots indicate the sample comparisons with each offspring.
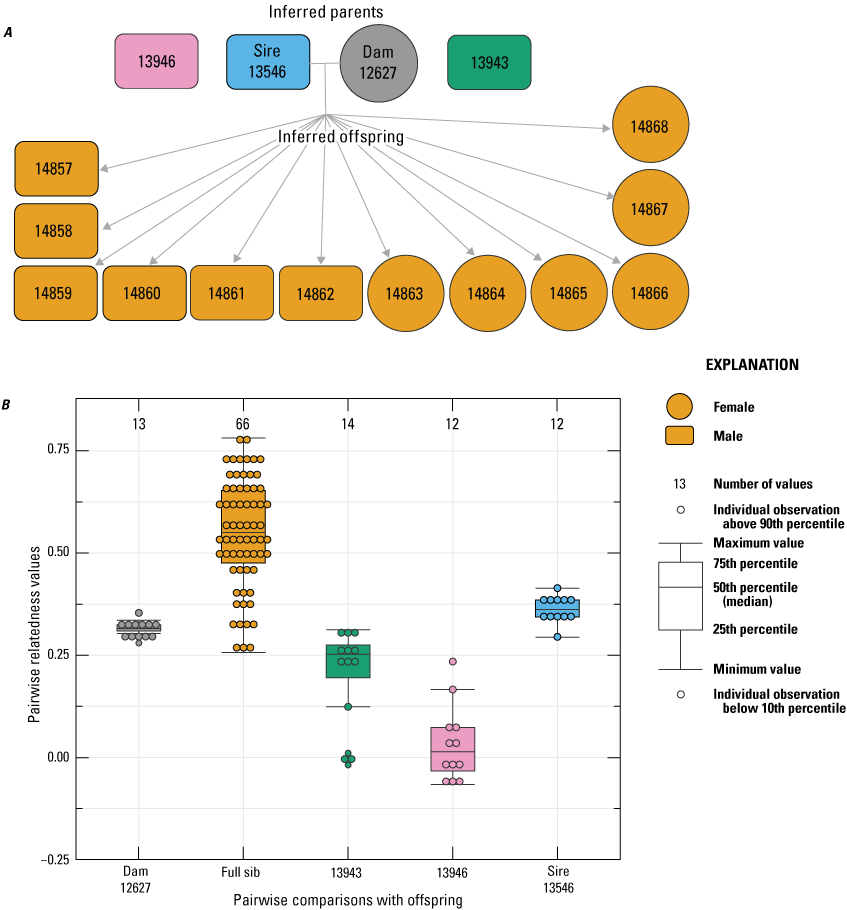
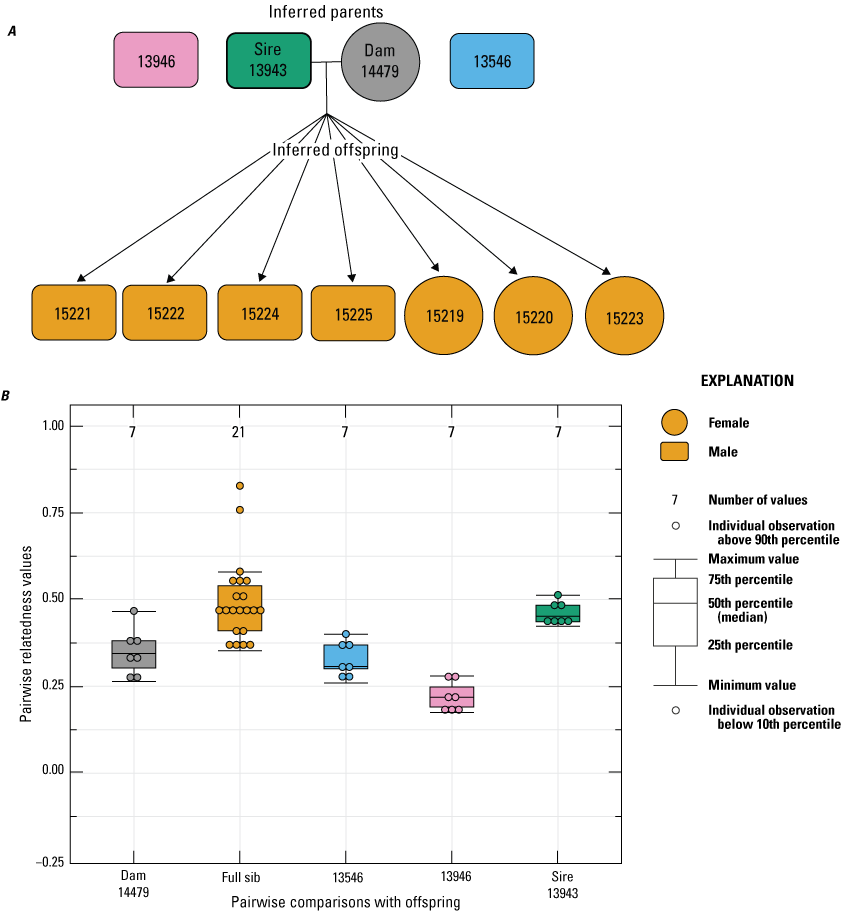
In 2022, four females that were housed together with three males, each gave birth to eight or more offspring. For female 12641, “Colony” inferred eight of nine offspring to have arisen from two sires. One individual was not included in the analysis because of high missing data (14841), so the paternal contribution for this snake is unknown. The two inferred sires (13546 and 13943) indicated high relatedness (Rw=0.49) and were assigned as possible half siblings in the “Colony” analysis but with low confidence (table 1). To assess confidence in the multiple paternity inference, we removed one of the sires and reran “Colony,” each with only one or the other sire present in the dataset to assess if the number of sires and probability of paternity would change. In both instances, “Colony” inferred two sires, one sampled and one inferred from the data with high probability (>0.95). Figure 4 provides the inferred pedigree information and pairwise relatedness among the offspring and all adults in the breeding group.
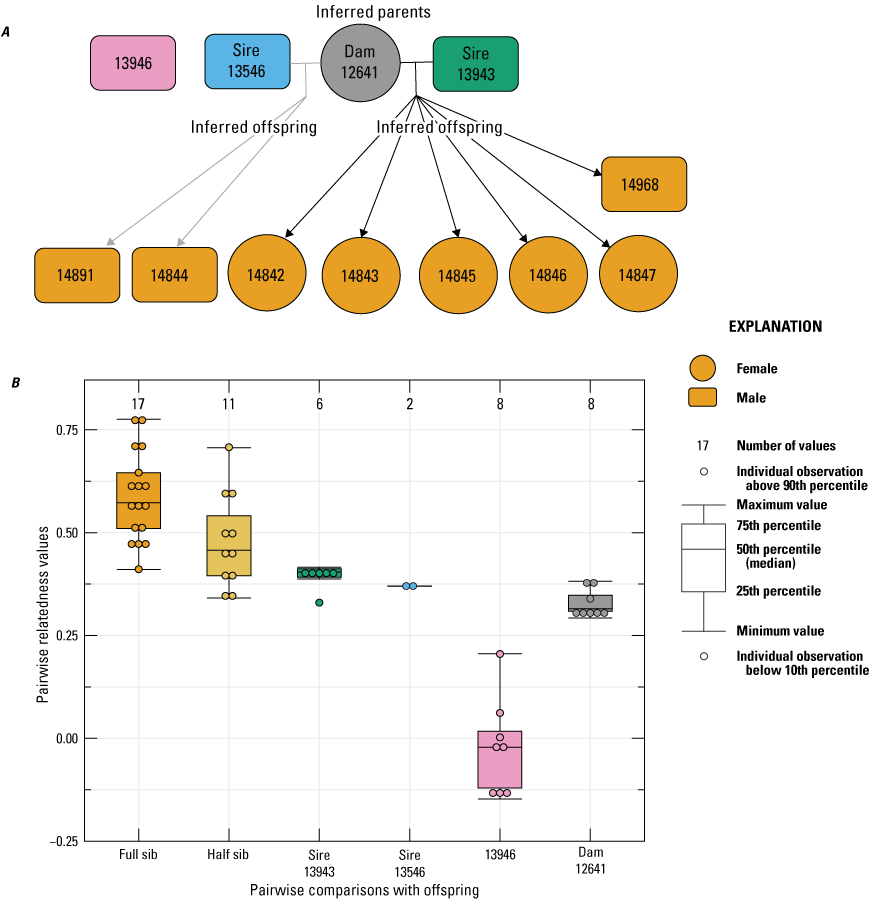
Pedigree inferred from a 2022 breeding group using the relationships from “Colony,” where A, a horizontal line connects inferred parents, and inferred offspring are indicated by arrows (circles indicate female, and rectangles indicate male); B, pairwise relatedness values (Rw; Wang, 2002) on the y-axis estimated for each relationship comparison on the x-axis between the offspring (fullsibs [FS] and halfsibs [HS]), the offspring and the inferred sires 13943 and 13546, the offspring and unrelated male 13946, and the offspring and dam 12641. Boxplots represent the interquartile range with a horizontal line indicating the median, and the whiskers extend to the 90th and 10th percentiles, respectively. Colored dots indicate the sample comparisons with each offspring.
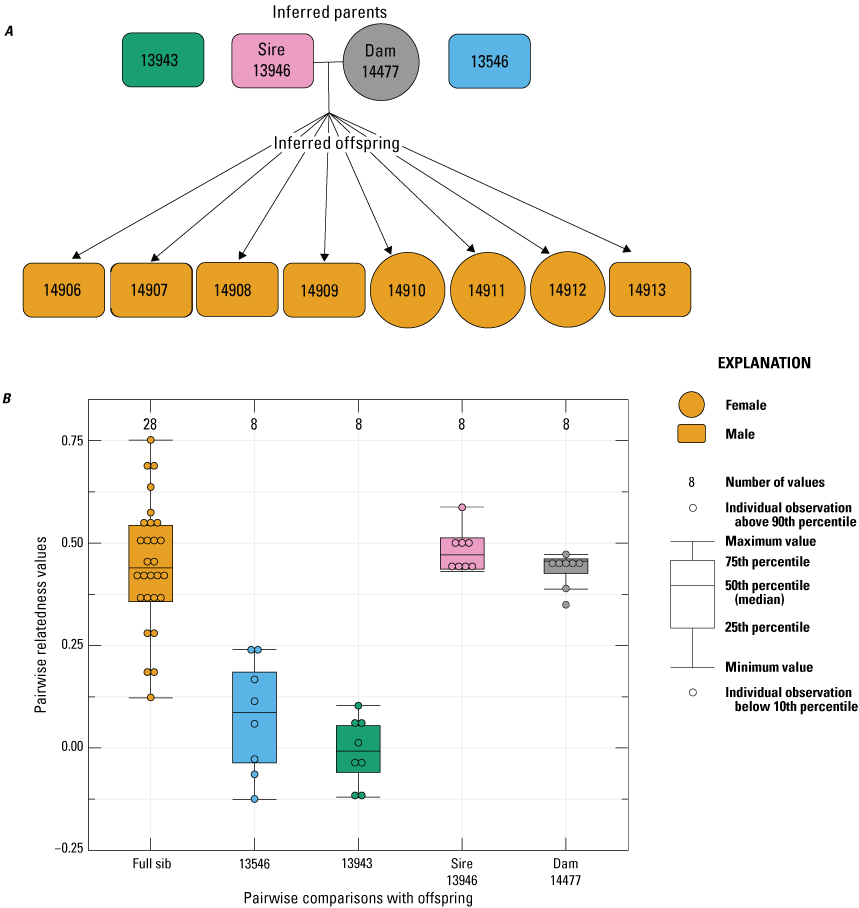
For female 12627, all 12 of the offspring born had an inferred paternity to male 13546 (fig. 5). Although male 13943 was not inferred as a sire, related estimates between this male and the offspring born to dam 12627 were relatively high (mean=0.210), which was likely because of the high relatedness that was estimated between male 13943 and the inferred sire 13546 (Rw=0.49; table 1). For female 14477, all eight of the offspring born in 2022 had an inferred paternity to male 13946 (fig. 6). Similarly, the 11 offspring born to female 14479 in 2022 had an inferred paternity to male 13946 (fig. 7). Based on these analyses, a total of three sires were inferred across the four breeding groups from 2022, with one sire contributing to two breeding groups, and two sires contributing to multiple paternity of a single breeding group.
Pedigree inferred from a 2022 breeding group using the relationships from “Colony,” where A, a horizontal line connects inferred parents, and inferred offspring are indicated by arrows (circles indicate female, and rectangles indicate male); B, pairwise relatedness values (Rw; Wang, 2002) on the y-axis estimated for each relationship comparison on the x-axis between the offspring and dam 12627, the offspring (fullsibs [FS]), the offspring and unrelated males 13943 and 13946, and offspring and the inferred sire 13546. Boxplots represent the interquartile range with a horizontal line indicating the median, and the whiskers extend to the 90th and 10th percentiles, respectively. Colored dots indicate the sample comparisons with each offspring.
Pedigree inferred from a 2022 breeding group using the relationships from “Colony,” where A, a horizontal line connects inferred parents, and inferred offspring are indicated by arrows (circles indicate female, and rectangles indicate male); B, pairwise relatedness values (Rw; Wang, 2002) on the y-axis estimated for each relationship comparison on the x-axis between the offspring (FS), the offspring and unrelated males 13546 and 13943, the offspring and the inferred sire 13946, and the offspring and dam 14477. Boxplots represent the interquartile range with a horizontal line indicating the median, and the whiskers extend to the 90th and 10th percentiles, respectively. Colored dots indicate the sample comparisons with each offspring.
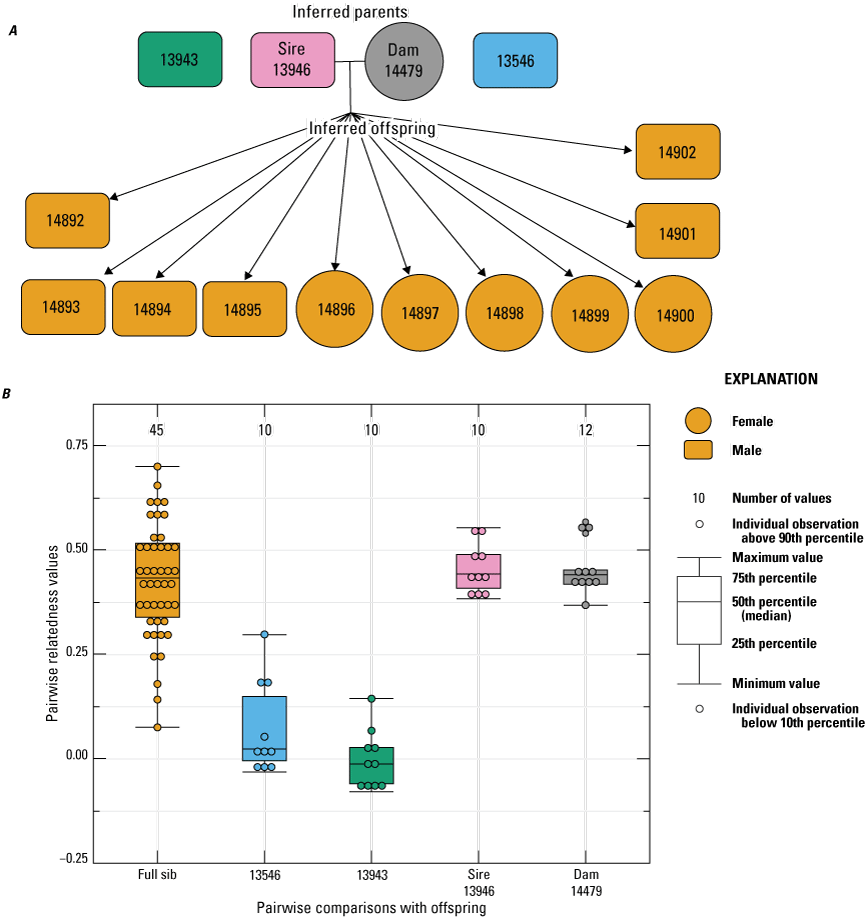
Pedigree inferred from the 2022 breeding group using the relationships from “Colony,” where A, a horizontal line connects inferred parents, and inferred offspring are indicated by arrows (circles indicate female, and rectangles indicate male); B, pairwise relatedness values (Rw; Wang, 2002) on the y-axis estimated for each relationship comparison on the x-axis between the offspring (fullsibs [FS]), the offspring and unrelated males 13546 and 13943, the offspring and the inferred sire 13946, and the offspring and dam 14479. Boxplots represent the interquartile range with a horizontal line indicating the median, and the whiskers extend to the 90th and 10th percentiles, respectively. Colored dots indicate the sample comparisons with each offspring.
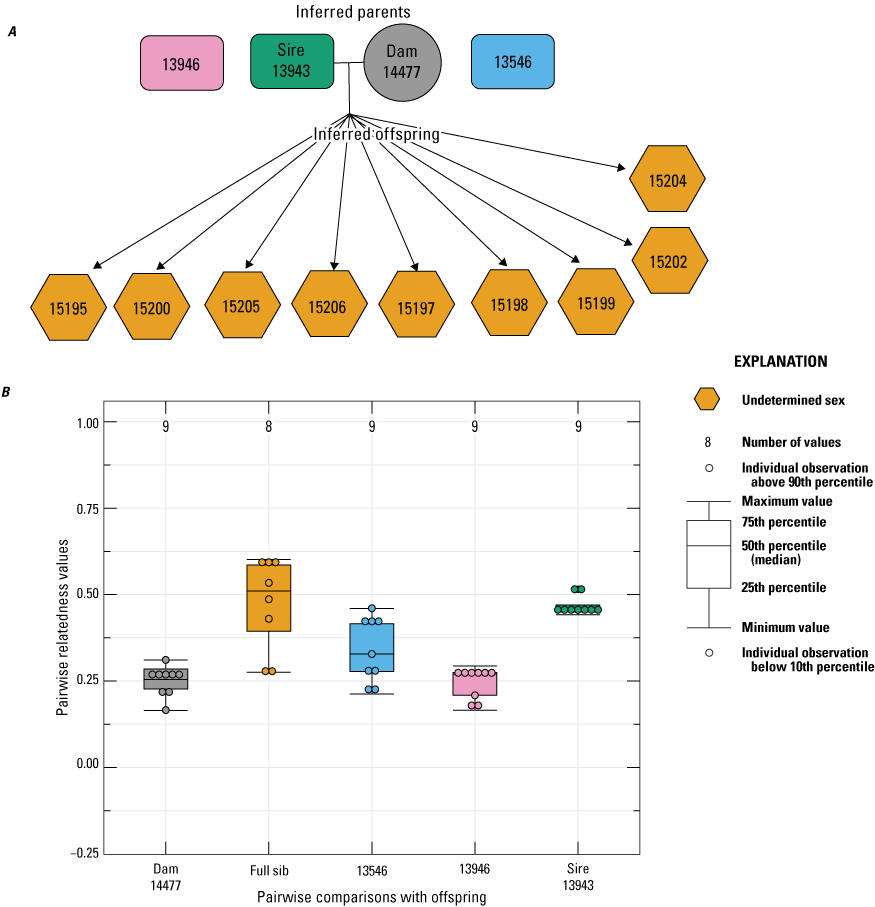
In 2023, two females (14477 and 14479) were paired with the same three males as in 2022. For female 14477, 9 of the 12 offspring born in 2023 had an inferred paternity to male 13943 (fig. 8). The remaining three offspring failed to sequence, so no inference was made. Similarly, the seven offspring born to female 14479 in 2023 had an inferred paternity to male 13943 (fig. 9).
Pedigree inferred from the 2023 breeding group using the relationships from “Colony,” where A, a horizontal line connects inferred parents, and inferred offspring are indicated by arrows (circles indicate female, rectangles indicate male, and hexagons indicate undetermined sex); B, pairwise relatedness values (Rw; Wang, 2002) on the y-axis estimated for each relationship comparison on the x-axis between the offspring and dam 14477, the offspring (fullsibs [FS]), the offspring and unrelated males 13546 and 13946, and the offspring and the inferred sire 13943. Boxplots represent the interquartile range with a horizontal line indicating the median, and upper and the whiskers extend to the 90th and 10th percentiles, respectively. Colored dots indicate the sample comparisons with each offspring.
Pedigree inferred from the 2023 breeding group using the relationships from “Colony,” where A, a horizontal line connects inferred parents, and inferred offspring are indicated by arrows. (circles indicate female, and rectangles indicate male); B, pairwise relatedness values (Rw; Wang, 2002) on the y-axis estimated for each relationship comparison on the x-axis between the offspring and dam 14479, the offspring (fullsibs [FS]) and the unrelated males 13546 and 13946, and the offspring and inferred sire 13943. Boxplots represent the interquartile range with a horizontal line indicating the median, and the whiskers extend to the 90th and 10th percentiles, respectively. Colored dots indicate the sample comparisons with each offspring.
Summary
Our results indicated that microsatellite genotyping is a reliable method for detecting paternity and sibship relationships in the captive breeding colony of narrow-headed gartersnakes (Thamnophis rufipunctatus) at the Phoenix Zoo. We were able to determine the paternity of offspring with high probability (>0.95) from litters that resulted from females housed with as many as four males. During the years, most of the offspring were sired by a single male (six out of eight litters), but in 2019 and 2022, we reported that more than one male contributed to a single reproductive bout of a single female—evidence of multiple paternity. Although previous studies have indicated that gartersnakes can use this reproductive strategy (Garner and others, 2002; Prosser and others, 2002; Friesen and others, 2014; Gangloff and others, 2021), this is the first evidence of multiple paternity in T. rufipunctatus. Interestingly, one study from Garner and others (2002) indicated a positive relationship between gartersnake litter size and the number of sires within a litter. Also, several studies across reptile species have shown fitness benefits for females with multiple sires (Blouin-Demers and others, 2005; Madsen and others, 2005; Uller and Olsson, 2008), such as “bet-hedging” (mating with several males to increase the genetic diversity of her offspring) and “trading up” (mating with a new male deemed of higher quality than a male from a previous mating). As the captive breeding efforts continue at the Phoenix Zoo, future work may be directed toward evaluating female choice and tracking the reproductive success of females (in other words, total litter size) between single and multisired litters.
References Cited
Adamack, A.T., and Gruber, B., 2014, PopGenReport—Simplifying basic population genetic analyses in R: Methods in Ecology and Evolution, v. 5, no. 4, p. 384–387. [Available at https://doi.org/10.1111/2041-210X.12158.]
Blais, B.R., Wells, S.A., Poynter, B.M., Koprowski, J.L., Garner, M.M., and Allard, R.A., 2022, Adaptive management in a conservation breeding program—Mimicking habitat complexities facilitates reproductive success in narrow-headed gartersnakes (Thamnophis rufipunctatus): Zoo Biology, v. 41, no. 4, p. 346–353. [Available at https://doi.org/10.1002/zoo.21682.]
Blouin-Demers, G., Gibbs, H.L., and Weatherhead, P.J., 2005, Genetic evidence for sexual selection in black ratsnakes, Elaphe obsoleta: Animal Behaviour, v. 69, no. 1, p. 225–234. [Available at https://doi.org/10.1016/j.anbehav.2004.03.012.]
Brookfield, J.F.Y., 1996, A simple new method for estimating null allele frequency from heterozygote deficiency: Molecular Ecology, v. 5, no. 3, p. 453–455. [Available at https://onlinelibrary.wiley.com/doi/10.1046/j.1365-294X.1996.00098.x.]
Dakin, E.E., and Avise, J.C., 2004, Microsatellite null alleles in parentage analysis: Heredity, v. 93, no. 5, p. 504–509. [Available at https://doi.org/10.1038/sj.hdy.6800545.]
D’Aloia, C.C., Bogdanowicz, S.M., Harrison, R.G., and Buston, P.M., 2017, Cryptic genetic diversity and spatial patterns of admixture within Belizean marine reserves: Conservation Genetics, v. 18, p. 211–223. [Available at https://doi.org/10.1007/s10592-016-0895-5.]
Faircloth, B.C., 2008, MSATCOMMANDER—Detection of microsatellite repeat arrays and automated, locus-specific primer design: Molecular Ecology Resources, v. 8, no. 1, p. 92–94, accessed July 1, 2024, at https://doi.org/10.1111/j.1471-8286.2007.01884.x.
Foose, T.J., and Ballou, J.D., 1988, Management of small populations: International Zoo Yearbook, v. 27, no. 1, p. 26–41. [Available at https://doi.org/10.1111/j.1748-1090.1988.tb03194.x.]
Frankham, R., 2010, Challenges and opportunities of genetic approaches to biological conservation: Biological Conservation, v. 143, no. 9, p. 1919–1927. [Available at https://doi.org/10.1016/j.biocon.2010.05.011.]
Friesen, C.R., Kerns, A.R., and Mason, R.T., 2014, Factors influencing paternity in multiply mated female red-sided garter snakes and the persistent use of sperm stored over winter: Behavioral Ecology and Sociobiology, v. 68, no. 9, p. 1419–1430. [Available at https://doi.org/10.1007/s00265-014-1749-0.]
Gangloff, E.J., Manes, M.B., Schwartz, T.S., Robert, K.A., Huebschman, N., and Bronikowski, A.M., 2021, Multiple paternity in garter snakes with evolutionarily divergent life histories: Journal of Heredity, v. 112, no. 6, p. 508–518. [Available at https://doi.org/10.1093/jhered/esab043.]
Garner, T.W.J., Gregory, P.T., McCracken, G.F., Burghardt, G.M., Koop, B.F., McLain, S.E., and Nelson, R.J., 2002, Geographic variation of multiple paternity in the common garter snake (Thamnophis sirtalis): Copeia, v. 2002, no. 1, p. 15–23. [Available at https://doi.org/10.1643/0045-8511(2002)002[0015:GVOMPI]2.0.CO;2.]
Hedrick, P.W., and Miller, P.S., 1992, Conservation genetics—Theory and management of captive populations, chap. 4 of Sandlund, O.T., Hindar, K., and Brown, A.H.D., eds., Conservation of biodiversity for sustainable development: Oslo, Norway, Scandinavian University Press, and Oxford, U.K., Oxford University Press, p. 70–87.
Ivy, J.A., Miller, A., Lacy, R.C., and DeWoody, J.A., 2009, Methods and prospects for using molecular data in captive breeding programs—An empirical example using parma wallabies (Macropus parma): Journal of Heredity, v. 100, no. 4, p. 441–454. [Available at https://doi.org/10.1093/jhered/esp019.]
Jombart, T., and Ahmed, I., 2011, adegenet 1.3-1—New tools for the analysis of genome-wide SNP data: Bioinformatics, v. 27, no. 21, p. 3070–3071. [Available at https://doi.org/10.1093/bioinformatics/btr521.]
Jones, O.R., and Wang, J., 2010, COLONY—A program for parentage and sibship inference from multilocus genotype data: Molecular Ecology Resources, v. 10, no. 3, p. 551–555. [Available at https://doi.org/10.1111/j.1755-0998.2009.02787.x.]
Kamvar, Z.N., Tabima, J.F., and Grünwald, N.J., 2014, Poppr—An R package for genetic analysis of populations with clonal, partially clonal, and/or sexual reproduction: PeerJ, v. 2, 14 p. [Available at https://doi.org/10.7717/peerj.281.]
Madsen, T., Ujvari, B., Olsson, M., and Shine, R., 2005, Paternal alleles enhance female reproductive success in tropical pythons: Molecular Ecology, v. 14, no. 6, p. 1783–1787. [Available at https://doi.org/10.1111/j.1365-294X.2005.02505.x.]
Nali, R.C., Zamudio, K.R., and Prado, C.P.A., 2014, Microsatellite markers for Bokermannohyla species (Anura, Hylidae) from the Brazilian Cerrado and Atlantic Forest domains: Amphibia-Reptilia, v. 35, no. 3, p. 355–360. [Available at https://doi.org/10.1163/15685381-00002950.]
Pew, J., Muir, P.H., Wang, J., and Frasier, T.R., 2015, related—An R package for analysing pairwise relatedness from codominant molecular markers: Molecular Ecology Resources, v. 15, no. 3, p. 557–561. [Available at https://doi.org/10.1111/1755-0998.12323.]
Prosser, M.R., Weatherhead, P.J., Gibbs, H.L., and Brown, G.P., 2002, Genetic analysis of the mating system and opportunity for sexual selection in northern water snakes (Nerodia sipedon): Behavioral Ecology, v. 13, no. 6, p. 800–807. [Available at https://doi.org/10.1093/beheco/13.6.800.]
Queller, D.C., and Goodnight, K.F., 1989, Estimating relatedness using genetic markers: Evolution, v. 43, no. 2, p. 258–275. [Available at https://doi.org/10.2307/2409206.]
R Core Team, 2022, R—A language and environment for statistical computing: Vienna, Austria, R Foundation for Statistical Computing, accessed July 1, 2024, at https://www.r-project.org.
Rousset, F., 2008, GENEPOP’007—A complete re-implementation of the GENEPOP software for Windows and Linux: Molecular Ecology Resources, v. 8, no. 1, p. 103–106. [Available at https://doi.org/10.1111/j.1471-8286.2007.01931.x.]
Rozen, S., and Skaletsky, H.J., 2000, Primer3 on the WWW for general users and for biologist programmers, in Misener, S., and Krawetz, S.A., eds., Bioinformatics methods and protocols—Methods in molecular biology: Totowa, N.J., Humana Press, Inc., v. 132, p. 365–386, accessed July 1, 2024, at https://doi.org/10.1385/1-59259-192-2:365.
Uller, T., and Olsson, M., 2008, Multiple paternity in reptiles—Patterns and processes: Molecular Ecology, v. 17, no. 11, p. 2566–2580. [Available at https://doi.org/10.1111/j.1365-294X.2008.03772.x.]
U.S. Fish and Wildlife Service, 2014, Endangered and threatened wildlife and plants; threatened status for the northern Mexican gartersnake and narrow-headed gartersnake [final rule]: Federal Register, v. 79, no. 130, p. 38678–38746. [Available at https://www.federalregister.gov/d/2014-14615.]
Wang, J., 2002, An estimator for pairwise relatedness using molecular markers: Genetics, v. 160, no. 3, p. 1203–1215. [Available at https://doi.org/10.1093/genetics/160.3.1203.]
Wang, J., 2004, Sibship reconstruction from genetic data with typing errors: Genetics, v. 166, no. 4, p. 1963–1979. [Available at https://doi.org/10.1093/genetics/166.4.1963.]
Wood, D.A., Emmons, I.D., Nowak, E.M., Christman, B.L., Holycross, A.T., Jennings, R.D., and Vandergast, A.G., 2018, Conservation genomics of the Mogollon narrow-headed gartersnake (Thamnophis rufipunctatus) and northern Mexican gartersnake (Thamnophis eques megalops): U.S. Geological Survey Open-File Report 2018–1141, 47 p., accessed July 1, 2024, at https://doi.org/10.3133/ofr20181141.
Wood, D.A., Mitelberg, A., and Vandergast, A.G., 2022, Microsatellite loci for Mogollon narrowheaded gartersnake (Thamnophis rufipunctatus) and the northern Mexican gartersnake (Thamnophis eques megalops) in Arizona and New Mexico (2020–2021): U.S. Geological Survey data release, accessed July 1, 2024, at https://doi.org/10.5066/P9H2ZSSY.
Appendix 1. Microsatellite Locus, Multiplex Polymerase Chain Reaction Group Number, Percent Missing Data, Allelic Diversity, Observed and Expected Heterozygosity, and Frequency of Null Alleles of 125 Microsatellite Loci Genotyped Across Four Thamnophis rufipunctatus Populations
Table 1.1.
Microsatellite loci (n=125) that were sequenced and evaluated to generate a genetic toolset to track pedigree and assess paternity and sibship relationships for captive breeding programs.[>, greater than; %M, percent missing data; He, expected heterozygosity; Ho, observed heterozygosity; NA, no diversity statistics were calculated for that locus because the missing data exceeded the 20-percent threshold; Nfreq, frequency of null alleles; Num, number of alleles]
Appendix 2. Breeding Adult Relatedness Estimates
Table 2.1.
Pairwise estimate of relatedness for all adult snakes used for breeding (up to year 2023) in the Phoenix Zoo.[CI, confidence interval; Ind, individual snake identity of pairwise comparison; Rw, pairwise estimate of relatedness (Wang, 2002); %, percent]
Abbreviations
DNA
deoxyribonucleic acid
FS
fullsib
HS
halfsib
PCR
polymerase chain reaction
Rqg
pairwise estimate of relatedness using Queller and Goodnight (1989)
Rw
pairwise estimate of relatedness using Wang (2002)
For more information concerning the research in this report, contact the
Director, Western Ecological Research Center
U.S. Geological Survey
3020 State University Drive East
Sacramento, California 95819
https://www.usgs.gov/centers/werc
Publishing support provided by the Science Publishing Network,
Sacramento Publishing Service Center
Disclaimers
Any use of trade, firm, or product names is for descriptive purposes only and does not imply endorsement by the U.S. Government.
Although this information product, for the most part, is in the public domain, it also may contain copyrighted materials as noted in the text. Permission to reproduce copyrighted items must be secured from the copyright owner.
Suggested Citation
Wood, D.A., Mitelberg, A., and Vandergast, A.G., 2025, Parentage and sibship relationships among captive snakes at the Phoenix Zoo—2024 data summary: U.S. Geological Survey Data Report 1204, 20 p., https://doi.org/10.3133/dr1204.
ISSN: 2771-9448 (online)
Study Area
| Publication type | Report |
|---|---|
| Publication Subtype | USGS Numbered Series |
| Title | Parentage and sibship relationships among captive snakes at the Phoenix Zoo—2024 data summary |
| Series title | Data Report |
| Series number | 1204 |
| DOI | 10.3133/dr1204 |
| Publication Date | January 10, 2025 |
| Year Published | 2025 |
| Language | English |
| Publisher | U.S. Geological Survey |
| Publisher location | Reston, VA |
| Contributing office(s) | Western Ecological Research Center |
| Description | Report: vi, 20 p.; Data Release |
| Country | United States |
| State | Arizona |
| Other Geospatial | Phoenix Zoo |
| Online Only (Y/N) | Y |