

Base-Flow Sampling to Enhance Understanding of the Groundwater Flow Component of Nitrogen Loading in Small Watersheds Draining Into Long Island Sound
Links
- Document: Report (7.91 MB pdf) , HTML , XML
- Data Release: USGS data release - Nitrogen loads, yields, and associated field data collected during baseflow conditions and site attributes for small basins draining to Long Island Sound
- NGMDB Index Page: National Geologic Map Database Index Page (html)
- Download citation as: RIS | Dublin Core
Abstract
Excessive nitrogen discharge is a major concern for the Long Island Sound. Programs have been implemented to reduce point sources of nitrogen to the sound, but little is known about the nonpoint sources. This study aims to better understand the current groundwater contributions of nitrogen from nonpoint sources in the Long Island Sound watershed.
During the spring and summer of 2022, the U.S. Geological Survey, in cooperation with the U.S. Environmental Protection Agency, collected water-quality samples to analyze nutrients (nitrogen and phosphorus), chloride, and bromide at 45 stations in the Long Island Sound watershed in Connecticut, New York, and Rhode Island. The stations were in small drainage watersheds (5 to 30 square kilometers) in the southern part of the Long Island Sound watershed. During two separate synoptic sampling events, water-quality samples and instantaneous streamflow measurements were collected under base-flow conditions (where the streamflow is dominated by groundwater inputs rather than overland flow or runoff flow). One sampling event was in the nongrowing season (April 24–25, 2022), and the other was in the growing season (June 30–July 1, 2022). To calculate instantaneous nitrogen loads and yields, streamflow was measured at the time of sample collection.
Nitrogen concentrations, loads, and yields varied among sampling stations and by season. Total filtered nitrogen concentrations were generally lower in the nongrowing season (from less than 0.14 to 1.9 milligrams per liter) than in the growing season (from less than 0.23 to 3.0 milligrams per liter). Nitrate plus nitrite concentrations showed little variation between the nongrowing and growing seasons. Unfiltered ammonia plus organic nitrogen concentrations were generally lower in the nongrowing season (from less than 0.07 to 0.83 milligram per liter) than in the growing season (from 0.11 to 0.98 milligram per liter). In contrast, total filtered and unfiltered nitrogen loads and yields were higher in the nongrowing season than during the growing season, likely because streamflows were higher during the nongrowing season. Total unfiltered nitrogen yields during the nongrowing season ranged from less than 0.15 to 5.0 kilograms per square kilometer per day. Total unfiltered nitrogen yields during the growing season ranged from less than 0.12 to 2.5 kilograms per square kilometer per day. Total filtered nitrogen yields during the nongrowing season ranged from less than 0.13 to 5.2 kilograms per square kilometer per day. Total filtered nitrogen yields during the growing season ranged from less than 0.06 to 2.5 kilograms per square kilometer per day.
Introduction
Excessive nitrogen loading into the Long Island Sound has been identified as a major contributor to low-oxygen, or hypoxic, conditions in Long Island Sound waters (New York State Department of Environmental Conservation and Connecticut Department of Environmental Protection, 2000). Hypoxic conditions can cause death to fish species due to lack of oxygen and habitat loss for both fish and aquatic plant species (Díaz and Rosenberg, 2011). To regulate the amount of nitrogen entering the waterways in Connecticut and New York, and to reduce the ecological effects of excess nitrogen, the Connecticut Department of Energy and Environmental Protection and New York State Department of Environmental Conservation developed a nitrogen total maximum daily load (TMDL) in 2001. Point sources of nitrogen pollution from wastewater treatment facilities (WWTFs) was the focus for nitrogen reduction in the TMDL, particularly in the major tributaries that flow into the Long Island Sound or from facilities that drain directly to the Long Island Sound. Nitrogen loads from WWTFs in Connecticut have declined since the TMDL implementation (Whitney and Vlahos, 2021).
However, less is known about the current contribution of nitrogen from nonpoint sources, such as on-site wastewater disposal (septic systems) and fertilizer application, within the Long Island Sound watershed. In 2000, nonpoint sources were estimated to contribute 37 percent of the nitrogen load to the Long Island Sound (New York State Department of Environmental Conservation and Connecticut Department of Environmental Protection, 2000).
Many nonpoint sources of total nitrogen inputs to the Long Island Sound are transported through the groundwater-flow system, the process in which groundwater moves through a system, including the discharge of groundwater to surface water systems (Winter and others, 1998). Some of the nitrogen is discharged from the groundwater-flow system into streams and rivers, which then flow into the Long Island Sound, and some of the nitrogen is discharged directly into the Long Island Sound from the groundwater-flow system (Barclay and Mullaney, 2021). To assess total nitrogen concentrations in groundwater, site-specific conditions in small streams were targeted to ensure maximum groundwater flow into the stream (referred to as base flow).
To better understand nonpoint sources of nitrogen from groundwater flow to the Long Island Sound, the U.S. Geological Survey (USGS), in cooperation with the U.S. Environmental Protection Agency (EPA), sampled a network of 45 stream stations during the spring and summer of 2022. These stream stations were in small watersheds (from 5 to 30 square kilometers [km2]), where nonpoint sources of nitrogen dominate the nitrogen load during typical base-flow conditions in Connecticut, New York, and Rhode Island.
The purpose of this report is to deepen understanding of groundwater contributions of nitrogen from nonpoint sources in the Long Island Sound watershed. The report describes methods of station selection, determination of base-flow conditions, water-quality sampling, streamflow measurement, and calculation of nitrogen loads and yields. It presents streamflow and water-quality data from sampling events in nongrowing and growing seasons and nitrogen loads and yields calculated from those data. Also discussed are the accuracy and validity of the water-quality data. The data collected in the study are published in Barclay and others (2023).
Methods
Sampling stations were selected from small watersheds (from 5 to 30 km2) in the southern part of the Long Island Sound watershed (fig. 1). Stations were selected (1) to avoid major water withdrawals or diversions, (2) to include locations along a gradient of increasing urbanization, and (3) to include locations across a gradient of surficial geology types in watersheds with various percentages of coarse-grained glacial stratified sediment deposits. Sampling station selection targeted watersheds with residential areas using on-site wastewater disposal systems, which were identified by the absence of public sewers. Sampling events were conducted when streamflow conditions were at or close to the monthly mean base flow to maximize the relative importance of groundwater flow and minimize contributions from stormwater runoff. Two sampling events were scheduled to include both the nongrowing season (October through April) and the growing season (May through September). The dates of these events were selected to allow for comparison of concentrations and loads of nitrogen during base-flow conditions between seasons, to enable assessment of the importance of instream processing or loss of nitrogen during the warmer months, and to bracket the seasonal range of variation in nutrient loads. During the growing season, fertilizer applications to lawns, parks, and agricultural lands increase, but so does nitrogen removal by plants and microorganisms.
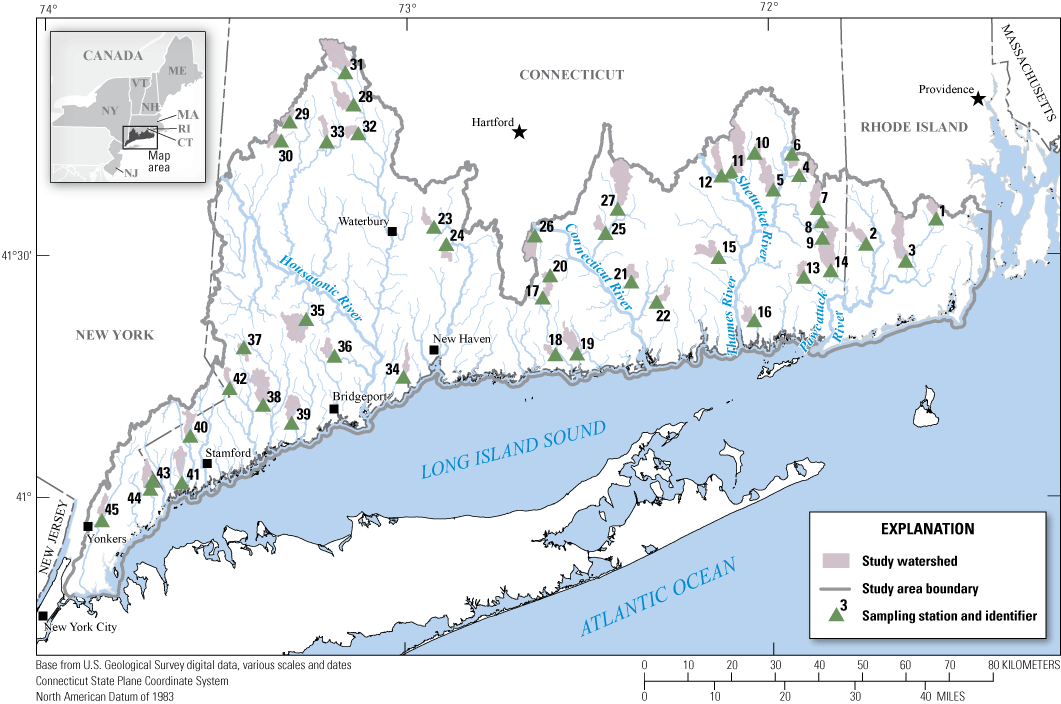
Map of the study area showing sampling stations and study watersheds in Connecticut and adjacent areas of New York and Rhode Island. Stations are labeled with a number and are listed in table 5; data from Barclay and others (2023).
Water-quality samples were analyzed at the USGS National Water Quality Laboratory (NWQL) in Denver, Colorado. The laboratory analysis included measured concentrations for ammonia as nitrogen; nitrite as nitrogen; unfiltered and filtered ammonia plus organic nitrogen as nitrogen; nitrate plus nitrite as nitrogen; filtered phosphorus; orthophosphate; chloride; and bromide (table 1). Some of the concentration data were then used to calculate total unfiltered and filtered nitrogen, unfiltered and filtered organic nitrogen, and filtered nitrate (table 2). The resulting nutrient concentration data (measured and calculated) were used along with measured streamflow to calculate instantaneous nutrient loads and yields at each sampling station. All resulting water-quality data and additional information about laboratory methods, such as sample holding time requirements, can be accessed in the accompanying data release (Barclay and others, 2023).
Table 1.
Measured water-quality constituents and analytical methods.[All data can be accessed in Barclay and others (2023). Parameter codes and method codes are from the U.S. Geological Survey (USGS) National Water Information System (USGS, 2024b). mg/L, milligram per liter; EPA, U.S. Environmental Protection Agency]
| Measured constituent | USGS parameter code | Method code | Laboratory reporting level | Source of method description |
|---|---|---|---|---|
| Ammonia as nitrogen (filtered) | 00608 | SHC02 | 0.01 mg/L | Fishman (1993) |
| Nitrite as nitrogen (filtered) | 00613 | DZ001 | 0.002 mg/L | Fishman (1993) |
| Ammonia plus organic nitrogen (filtered) as nitrogen | 00623 | KJ002 | 0.07 mg/L | Patton and Truitt (2000) |
| Ammonia plus organic nitrogen (unfiltered) as nitrogen | 00625 | KJ008 | 0.07 mg/L | Patton and Truitt (2000) |
| Nitrate plus nitrite (filtered) as nitrogen | 00631 | RED01 | 0.08 mg/L | Patton and Kryskalla (2011) |
| Phosphorus (filtered) | 00666 | CL020 | 0.008 mg/L | EPA (1993) |
| Orthophosphate (filtered) as phosphorus | 00671 | HM01 | 0.008 mg/L | Fishman (1993) |
| Chloride (filtered) | 00940 | IC022 | 0.02 mg/L | Fishman and Friedman (1989) |
| Bromide (filtered) | 71870 | IC027 | 0.01 mg/L | Fishman and Friedman (1989) |
Table 2.
Calculated water-quality constituents and analytical methods.[All data can be accessed in Barclay and others (2023). Parameter codes are from the U.S. Geological Survey (USGS) National Water Information System (USGS, 2024b). Method code is ALGOR for each calculated constituent. mg/L, milligram per liter]
Station Selection
The water-quality stations were selected randomly from groups, called strata, in a stratified random sampling approach. The components that form each stratum were based on factors expected to increase or decrease base-flow nitrogen loads. To determine whether the base-flow nitrogen loads were expected to increase or decrease, the watersheds (drainage areas) upstream from the sampling stations were assessed for their septic system density, percent agricultural or turf grass land cover, percent impervious cover, and percent coarse-grained glacial stratified sediment deposits. Septic system density and agricultural or turf grass land cover indicate nitrogen inputs to the groundwater from human or animal waste or from inorganic fertilizers (Kaushal and others, 2011; Wherry and others, 2021). A watershed with more extensive impervious cover may suggest higher nutrient inputs related to urbanization in that area, such as leaky sewers, and decreased groundwater transport relative to overland flow. Coarse-grained sediment deposits are associated with a greater flow of groundwater and groundwater-transported nutrients to surface water.
Streams at road crossings within the study area were located and developed into a dataset. The dataset was filtered to remove locations with any of the following characteristics:
-
(1) drainage areas that are either large (greater than 50 km2) or very small (less than 5 km2; EPA and USGS, 2012),
-
(2) major water diversions (Connecticut Department of Energy and Environmental Protection, 2005),
-
(3) municipal wastewater discharges (EPA, 2021),
-
(4) upstream lakes with surface areas greater than 0.1 km2 (EPA and USGS, 2012), or
-
(5) coastal wetlands within 0.5 kilometer (U.S. Fish and Wildlife Service, 2018).
-
(1) density of residents served by septic systems (Rhode Island Geographic Information System, 2012; Westchester County Department of Planning, 2015; Falcone, 2016; Connecticut Department of Energy and Environmental Protection, 2019a, 2019b),
-
(2) percent agricultural and turf grass landcover (Homer and others, 2015; Center for Land Use Education and Research, 2016),
-
(3) percent impervious land cover (Homer and others, 2015), and
-
(4) percent coarse-grained glacial stratified sediment deposits (Rhode Island Geographic Information System, 1989; New York State Museum and New York State Geological Survey, 1999; USGS and others, 2005; fig. 2).

Maps of the study area showing sampling stations and A, the population density in the watershed of residents using septic systems; B, the percent of the watershed with agricultural or turf grass land cover; C, the percent of the watershed with impervious land cover; and D, the percent of the watershed with coarse-grained glacial stratified sediment in Connecticut and adjacent areas of New York and Rhode Island. Each dot represents a sampling station; the percentage indicated by the dot color pertains to the entire watershed upstream from the station location.
For each watershed characteristic, percentiles were calculated for each station as compared to the rest of the stations. One of five bins would then be assigned to that station, from very low to very high, as corresponds to the percentiles of the characteristic for that station (table 3). Ultimately, each station was assigned to four bins; one for each watershed characteristic associated with nitrogen loads.
Table 3.
Percentile value ranges, bins, and numerical scores assigned to the watershed characteristics.[≤, less than or equal to; >, greater than; <, less than]
Strata were formed from unique combinations of bins across the watershed characteristics (table 4; fig. 2). Strata 1–4 represent the extreme ends (very low and high or very high) of the combinations of expected nitrogen sources (septic system density, agricultural or turf grass land cover, impervious land cover) and coarse-stratified sediments (low or very low and high or very high). Strata 5–16 represent stations where one source of nitrogen input dominates (medium, high, or very high) and the others are less prevalent (low or very low). Strata 17–36 contain stations representing a range of nitrogen inputs, regardless of source, and a range of coverage by coarse-grained glacial stratified deposits. To calculate the aggregate nitrogen input bin, the bins were converted to numerical scores, from 1 for very low to 5 for very high, and the average score across all sources was used as the aggregate bin (table 3). For example, if the individual bins for a station are very low, low, and high, the aggregate bin would be (1+2+4)/3=2.3, and would then be rounded to 2, or low.
Table 4.
Station-selection strata formed from the combination of bins of watershed characteristics related to nitrogen loads and counts of possible and selected sampling stations in Connecticut and adjacent areas of New York and Rhode Island.[Some strata were not sampled because of station conditions that were unsafe or precluded the ability to sample or measure streamflow]
Stations were randomly selected from each stratum. To prevent the selection of nested stations, stations were selected sequentially, and all upstream and downstream stations were removed after each selection. Two stations each were selected from strata 1–4 to ensure sufficient representation of very high and very low expected nitrogen loads. Initially, one station was selected from each of the remaining strata. To ensure sufficient spatial coverage, an additional station was selected at random from the area of every eight-digit hydrologic unit code that was not represented in the initial station list. These initially selected stations (table 4) were visited to assess the safety and viability of sampling and streamflow measurements, with priority given to existing USGS stations. Stations with conditions that were unsafe or precluded the ability to sample or measure streamflow were replaced with randomly selected backup stations. The final 45 stations are listed in table 5 and appear in figure 1.
Table 5.
Selected water-quality sampling stations and watershed characteristics in Connecticut and adjacent areas of New York and Rhode Island.[Map number refers to the numbers of station labels on the map in figure 1; station names appear as written in the U.S. Geological Survey (USGS) National Water Information System (USGS, 2024b). Data from Barclay and others (2023). km2, square kilometer; RI, Rhode Island; TRIB, tributary; AVE, avenue; EXT, extension; CT, Connecticut; RD, road; BRK, brook; NR, near; ABV, above; BK, brook; RTE, route; ST, street; W, west; R, river; E, east; TPKE, turnpike; BR, branch; PD, pond; NY, New York; PKWY, parkway]
| Map number (fig. 1) | Station number | Station name | Latitude | Longitude | Stratum | Septic system density (population/km2) | Agricultural or turf grass land cover (percent) | Impervious land cover (percent) | Coarse-grained sediment (percent) |
|---|---|---|---|---|---|---|---|---|---|
| 1 | 01117354 | QUEEN RIVER AT STATE HIGHWAY 102 AT EXETER, RI | 41.5785 | −71.5430 | 21 | 35.8 | 1.56 | 0.341 | 1.17 |
| 2 | 01117900 | BRUSHY BROOK NEAR HOPE VALLEY, RI | 41.5288 | −71.7362 | 30 | 18.0 | 2.49 | 0.349 | 9.81 |
| 3 | 01117468 | BEAVER RIVER NEAR USQUEPAUG, RI | 41.4926 | −71.6281 | 36 | 48.9 | 2.39 | 1.45 | 25.5 |
| 4 | 01126644 | UNAMED TRIB AT COMMUNITY AVE EXT AT PLAINFIELD, CT | 41.6722 | −71.9189 | 32 | 70.9 | 17.0 | 4.81 | 12.7 |
| 5 | 01126804 | CORY BROOK AT DEPOT RD NEAR CANTERBURY, CT | 41.6424 | −71.9895 | 6 | 62.3 | 10.6 | 0.72 | 17.8 |
| 6 | 01126525 | SUGAR BROOK AT SUGAR BRK RD NR CENTRAL VILLAGE, CT | 41.7157 | −71.9389 | 37 | 65.6 | 36.5 | 1.71 | 71.3 |
| 7 | 01126908 | MOUNT MISERY BROOK ABV LOWDEN BRK NR VOLUNTOWN, CT | 41.6033 | −71.8678 | 2 | 10.4 | 1.79 | 0.159 | 14.9 |
| 8 | 011269235 | DENISON BRK AT BEACH POND RD NEAR VOLUNTOWN, CT | 41.5757 | −71.8582 | 35 | 17.8 | 9.38 | 0.645 | 47.8 |
| 9 | 01126925 | MYRON KINNEY BK NR VOLUNTOWN CT | 41.5338 | −71.8491 | 12 | 17.1 | 15.9 | 0.473 | 18.4 |
| 10 | 01122875 | DOWNING BROOK AT COLBURN RD NEAR CANTERBURY, CT | 41.7188 | −72.0408 | 18 | 43.3 | 8.23 | 0.355 | 0.00 |
| 11 | 01122710 | MERRICK BROOK AT BASS RD NEAR SCOTLAND, CT | 41.6799 | −72.1052 | 10 | 38.8 | 16.9 | 0.629 | 16.9 |
| 12 | 01122649 | INDIAN HOLLOW BK AT JERUSALEM RD NEAR WINDHAM, CT | 41.6722 | −72.1331 | 36 | 72.8 | 16.8 | 1.15 | 36.2 |
| 13 | 01118368 | SHUNOCK RIVER AT ROUTE 2 AT NORTH STONINGTON, CT | 41.4618 | −71.9087 | 31 | 9.06 | 6.92 | 1.10 | 15.9 |
| 14 | 01118300 | PENDLETON HILL BROOK NEAR CLARKS FALLS, CT | 41.4748 | −71.8342 | 31 | 23.9 | 7.57 | 0.381 | 8.85 |
| 15 | 01127680 | TRADING COVE BK AT LEFFINGWELL, CT | 41.5042 | −72.1420 | 26 | 46.4 | 4.76 | 0.881 | 6.66 |
| 16 | 01128922 | HEMPSTEAD BK AT BUDDINGTON RD NR GROTON, CT | 41.3726 | −72.0455 | 16 | 3.24 | 7.59 | 21.1 | 18.1 |
| 17 | 01195113 | BUNKER HILL BROOK AT RTE 148 NR KILLINGWORTH, CT | 41.4222 | −72.6243 | 21 | 32.0 | 2.69 | 0.268 | 1.11 |
| 18 | 01195149 | HUZZLE GUZZLE BRK AT HORSE POND RD NR MADISON, CT | 41.3045 | −72.5903 | 37 | 312 | 11.4 | 3.69 | 28.2 |
| 19 | 01195100 | INDIAN RIVER NEAR CLINTON, CT | 41.3062 | −72.5310 | 27 | 178 | 9.19 | 2.54 | 7.35 |
| 20 | 01193129 | CANDLEWOOD HILL BROOK NEAR LITTLE CITY, CT | 41.4680 | −72.6048 | 5 | 72.2 | 6.80 | 0.859 | 3.38 |
| 21 | 01193794 | ROARING BROOK NUMBER 2 NR EAST HADDAM, CT | 41.4544 | −72.3819 | 26 | 79.7 | 3.40 | 0.368 | 6.16 |
| 22 | 01194510 | CEDAR POND BROOK AT BEAVER BK RD NR NORTH LYME, CT | 41.4126 | −72.3128 | 2 | 12.6 | 4.08 | 0.265 | 20.8 |
| 23 | 01196081 | HUMISTON BROOK AT MARION AVE AT MARION, CT | 41.5678 | −72.9240 | 14 | 34.3 | 6.30 | 1.78 | 2.94 |
| 24 | 01196210 | HONEYPOT BROOK AT CREAMERY ROAD AT CHESHIRE, CT | 41.5323 | −72.8898 | 37 | 25.9 | 25.6 | 19.1 | 28.7 |
| 25 | 01193600 | FLAT BK NR EAST HAMPTON, CT | 41.5551 | −72.4524 | 7 | 89.4 | 6.78 | 1.07 | 2.37 |
| 26 | 01192929 | LONG HILL BROOK AT MILL ST AT MIDDLETOWN, CT | 41.5501 | −72.6466 | 28 | 47.3 | 28.8 | 15.2 | 6.01 |
| 27 | 01193400 | FAWN BK NR NORTH WESTCHESTER, CT | 41.6048 | −72.4188 | 27 | 83.2 | 13.7 | 0.735 | 4.22 |
| 28 | 01205595 | NICKEL MINE BK AT NORFOLK RD AT W TORRINGTON, CT | 41.8199 | −73.1463 | 11 | 33.1 | 18.0 | 0.752 | 0.00 |
| 29 | 01201995 | W BR SHEPAUG R NR MILTON, CT. | 41.7837 | −73.3221 | 1 | 3.99 | 2.38 | 0.17 | 0.419 |
| 30 | 01201009 | UNAMED TRIBUTARY AT WARREN, CT | 41.7444 | −73.3344 | 22 | 46.2 | 7.23 | 0.911 | 0.00 |
| 31 | 01205555 | HALL MEADOW BK NR WINCHESTER, CT | 41.8860 | −73.1691 | 1 | 12.1 | 4.43 | 0.363 | 3.07 |
| 32 | 01205904 | SPRUCE BK AT E LITCHFIELD RD AT E LITCHFIELD, CT | 41.7606 | −73.1331 | 9 | 40.1 | 12.8 | 0.802 | 2.38 |
| 33 | 01202700 | BUTTERNUT BK NR LITCHFIELD, CT | 41.7431 | −73.2200 | 13 | 38.7 | 40.3 | 0.605 | 0.605 |
| 34 | 0119665996 | UNNAMED TRIBUTARY AT RED CEDAR RD ORANGE, CT | 41.258 | −73.0066 | 29 | 222 | 23.0 | 21.2 | 9.32 |
| 35 | 012035014 | POOTATUCK RIVER AT RTE 25 AT BOTSFORD, CT | 41.3762 | −73.2735 | 33 | 169 | 21.6 | 2.39 | 15.3 |
| 36 | 012087991 | FARMILL RIVER AT MOHEGAN RD NEAR SHELTON, CT | 41.3009 | −73.1957 | 4 | 439 | 19.8 | 12.6 | 10.1 |
| 37 | 01208984 | UMPAWAUG POND BROOK AT SIMPAUG TPKE NR REDDING, CT | 41.3174 | −73.4441 | 8 | 143 | 7.17 | 0.638 | 14.9 |
| 38 | 01209300 | W BR SAUGATUCK R AT WESTON, CT | 41.1991 | −73.3902 | 23 | 169 | 9.36 | 2.41 | 2.55 |
| 39 | 01208948 | SASCO BK AT SOUTHPORT ON INGLESIDE RD ABV BANKS PD | 41.1619 | −73.312 | 3 | 200 | 23.8 | 4.85 | 0.00 |
| 40 | 01210310 | E BRANCH MIANUS R AT WILDWOOD RD NR STAMFORD, CT | 41.1337 | −73.5879 | 24 | 188 | 19.9 | 2.12 | 1.95 |
| 41 | 01211106 | GREENWICH CREEK AT RTE 1 NR COS COB, CT | 41.0368 | −73.6100 | 3 | 192 | 34.6 | 6.41 | 3.44 |
| 42 | 01209716 | EAST BRANCH SILVERMINE R AT RTE 33 NR WILTON, CT | 41.2326 | −73.4818 | 4 | 267 | 19.0 | 3.76 | 12.5 |
| 43 | 01299000 | BLIND BROOK NEAR PURCHASE NY | 41.0397 | −73.6904 | 20 | 18.6 | 35.1 | 26.6 | 0.00 |
| 44 | 01299200 | UNNAMED TRIBUTARY AT LINCOLN AVE NEAR PURCHASE NY | 41.0233 | −73.6954 | 19 | 0.00 | 39.3 | 11.0 | 0.00 |
| 45 | 01301960 | TROUBLESOME BROOK AT BRONX R PKWY NR TUCKAHOE NY | 40.9570 | −73.8267 | 23 | 0.00 | 17.3 | 32.7 | 1.88 |
Determining Base-Flow Conditions
Long-term monthly mean base flow was determined for a series of reference USGS streamgages in or near the study area (table 6). The streamflows in the selected reference streamgages are relatively unaffected by streamflow alteration or urbanization and are in watersheds of similar size (5 to 30 km2) to the targeted sample locations.
For each reference streamgage, the daily stream base flow for the period of water years 1989 to 2020 was estimated by using algorithms adapted from the computer program PART (Rutledge, 1998) and the Base-Flow Index (Gustard and others, 1992), as implemented in the R package DVstats (Lorenz, 2017). The daily estimates were then used to determine mean monthly base flows for each base-flow separation method. The mean of the outputs from the two methods was assumed to represent the mean monthly base flow at each reference streamgage.
To identify time periods that met the targeted base-flow conditions for sampling, daily mean streamflows at the reference gages were compared to the mean monthly base-flow statistics for each site for the month of interest. Sampling events were selected when the monthly mean stream base flow and daily mean streamflow were nearly equal, ensuring that 3 dry days had occurred previously, so the streamflows at the reference streamgages were not affected by stormwater inputs.
The selected sampling time period for the nongrowing season was April 24–25, and the selected time period for the growing season was from June 30–July 1. For the growing season sampling event on July 1, it was determined that the conditions for the first day of the month of July were most similar to the statistics for base flows at the reference streamgages for the month of June because, during July, streamflows typically decline substantially, reducing the monthly flow statistics. Therefore, early July streamflows were comparable to mean June base flows.
Table 6.
Daily mean streamflow and monthly mean base flow at selected reference streamgages used to determine base-flow conditions during the nongrowing and growing season sampling events at sampling stations in Connecticut and adjacent areas of New York and Rhode Island.[Station names appear as written in the U.S. Geological Survey (USGS) National Water Information System (USGS, 2024b). ft3/s, cubic foot per second; NY, New York; CT, Connecticut; RI, Rhode Island; RD, road; NA, not applicable]
Water-Quality Sampling Procedures
Samples collected for nutrients (unfiltered and filtered forms of nitrogen and phosphorus), chloride, and bromide analyses (tables 1 and 2) were collected twice during the project period at the selected sampling stations; once from April 24 to 25, 2022, during the nongrowing season, and once from June 30 to July 1, 2022, during the growing season. Samples were collected over a 2-day period and under conditions as close as possible to long-term monthly mean stream base-flow conditions for the targeted sampling months of April and June–July, including a required period of 3 days without precipitation prior to sampling to minimize stormwater inputs.
Water-quality samples were collected, and sampling equipment was handled in accordance with the USGS National Field Manual for the Collection of Water-Quality Data (USGS, variously dated). All water-quality samples were collected as either single point grab samples at the centroid of flow or composite samples collected across the channel width by an equal width increment sampling technique. The width and depth of the river determined the method of sample collection. Samples from rivers smaller than 10 feet (ft) wide or 1 ft deep were collected at a single point by using prerinsed 2-liter (L) plastic jugs. Samples from rivers larger than 10 ft wide or 1 ft deep were collected by using an equal width increment sampling method and composited in a precleaned, field-rinsed 4-L churn splitter.
Samples were processed in accordance with chapter A5 of the USGS National Field Manual (USGS, variously dated). Unfiltered samples were collected from the outlet tap of the churn splitter into 125-milliliters (mL) clear polyethylene bottles and immediately preserved with 4.5 normal sulfuric acid. Filtered samples were processed through a 0.45-micrometer filter into 125-mL brown polyethylene bottles and a 250-mL clear polyethylene bottle. The samples in the filtered and unfiltered bottles were labeled with sample location, date, and time and immediately chilled on ice in a cooler. All samples were shipped in coolers with ice within 3 days of sample collection to the USGS NWQL in Denver, Colorado, for analysis.
Specific laboratory methods used to analyze the various constituents are listed in table 1. Discrete water-quality field measurements of water temperature, specific conductance, dissolved oxygen, and pH were made in situ by using calibrated field instruments at the time of sampling.
Ten quality-control samples were collected for this study by following the policies and procedures outlined in chapter A4 of the USGS National Field Manual (USGS, variously dated). Two types of quality-control samples were collected and analyzed as part of this project: blank samples and replicate samples. Blank samples (collected in the field and laboratory) were collected to assess the potential for contamination caused by improper cleaning or handling. Collecting field blank samples involved filling the water-quality sample container (either a 2-L plastic jug or 4-L churn) with laboratory-certified clean water at a sampling site. The water-filled container was then processed as typically would be done in the field with natural waters. The field blanks were collected by using the same water-quality equipment that had been used to collect environmental samples. In addition to the collection of field blanks, two laboratory blanks were processed in the laboratory before the start of the project to detect any contamination of the sampling equipment. To represent the different sampling equipment used in the field, one laboratory blank was collected using a 4-L churn and one was collected using a 2-L jug.
A replicate sample involves collecting a typical sample in the field and dividing that sample into two separate bottle sets. Both bottle sets were submitted to the NWQL for analysis. Replicate samples were performed to assess for bias in the laboratory results and field collection techniques. During each sampling season, two field blanks and two field replicates were collected for a total of four field blanks and four field replicates. The blank and replicate samples were shipped to and analyzed at the NWQL in the same way as environmental samples.
Streamflow Measurements
Data from existing USGS streamgages were used where available for streamflow information at the time of sampling. At the locations without streamgages, instantaneous streamflow was measured at the time of water-quality sample collection. All streamflow measurements were made by using established USGS methods described in Rantz and others (1982) and Turnipseed and Sauer (2010). Standard wading rod and conventional handheld acoustic Doppler velocimeter measurements were used to collect the instantaneous streamflow data.
Nitrogen Load Calculations
Nitrogen concentration data were used in conjunction with streamflow measurements (either from instantaneous streamflow measurements or streamflow data from established USGS streamgages) to calculate instantaneous nitrogen loads and yields. Nitrogen loads are a measure of the mass of nitrogen flowing past the sampling point at the time of the sample collection and were determined by multiplying the concentration data by the streamflow and converting the result to units of kilograms per day (kg/d). Yields are area-normalized loads that facilitate the comparison of nutrient loads across watersheds of varying sizes. Yields are determined by dividing the calculated loads by the station drainage area.
Loads and yields were calculated for filtered and unfiltered total nitrogen at all the sampling stations for both the nongrowing and growing sampling events. If the nitrogen concentration data used to calculate the loads and yields were qualified as a nondetect (with a less-than qualifier applied to the values), the loads and yields data calculated from that concentration data would also receive a less-than qualifier. For example, if a total filtered nitrogen value had a concentration value of less than 0.14, the loads and yields would be calculated using the 0.14 value, and the result would have a less-than qualifier attached to it.
Streamflow Conditions, Water-Quality Data, and Nitrogen Loads and Yields
Streamflow conditions during the two sampling events—one during April 24–25, 2022, during the nongrowing season, and the other during June 30–July 1, 2022, during the growing season—were comparable to the mean base-flow conditions in the study area during the sampled months. The daily mean streamflow at reference gages during the sampling event was, on average, within 1.76 percent of the monthly mean base flow for the April sampling event and within 6.83 percent of the monthly mean base flow for the June–July sampling event (table 6). This is based on a comparison of daily mean streamflow on the second day of the 2-day sampling events and using the month of June for the June–July sampling event. The difference between daily mean streamflow and monthly mean streamflow ranged from −22.8 to 35.9 cubic feet per second (ft3/s) for April and from −2.85 to 3.85 ft3/s for June–July at the 18 reference gages used for the comparison. The relative percent difference between daily mean streamflow and monthly mean streamflow for the April nongrowing season sampling event ranged from −27.0 to 21.6 percent (table 6). The relative percent difference between daily mean streamflow and monthly mean streamflow for the June–July growing season sampling event ranged from −72.2 to 34.2 percent (table 6).
Instantaneous streamflow data at the sampling sites (collected either from streamflow measurements or determined from USGS streamgage readings) ranged from 1.40 to 28.0 ft3/s during the April nongrowing season sampling event and from 0.27 to 8.8 ft3/s during the June–July growing season sampling event (table 7).
Table 7.
Summary of the measurements of streamflow, measured water properties, and analytical results from sampling stations in Connecticut and adjacent areas of New York and Rhode Island during the nongrowing and growing season sampling events in 2022.[All data are accessible in the accompanying data release (Barclay and others, 2023); nongrowing season samples were collected on April 25 and 26, 2022, and growing season samples on June 30 and July 1, 2022. ft3/s, cubic feet per second; °C, degree Celsius; μS/cm, microsiemens per centimeter at 25 degrees Celsius; mg/L, milligram per liter; min, minimum; max, maximum; <, less than]
Discrete water-quality data (both measured and calculated constituents) are summarized in table 7. Both filtered and unfiltered total nitrogen are calculated parameters (table 2). When one of the constituents used to calculate total nitrogen was qualified as a nondetect, that qualifier was carried over to the calculated data. As such, the nondetect data has a more extensive range in nondetect values than is seen in the laboratory-analyzed concentration data. The concentration data are available in Barclay and others (2023). Total unfiltered nitrogen (the sum of nitrate plus nitrite and unfiltered ammonia) ranged from less than 0.13 to 2.1 milligrams per liter (mg/L) during the nongrowing season sampling event and ranged from less than 0.28 to 3.0 mg/L during the growing season sampling event (fig. 3). Total filtered nitrogen (the sum of nitrate plus nitrite, and filtered ammonia) ranged from less than 0.14 to 1.9 mg/L during the nongrowing season sampling event and ranged from less than 0.23 to 3.0 mg/L during the growing season sampling event (fig. 4). Total unfiltered ammonia plus organic nitrogen ranged from less than 0.07 to 0.83 mg/L during the nongrowing season sampling event and ranged from 0.11 to 0.98 mg/L during the growing season sampling event. Nitrate plus nitrite ranged from less than 0.04 to 1.65 mg/L during the nongrowing season sampling event and ranged from less than 0.04 to 2.92 mg/L during the growing season sampling event.
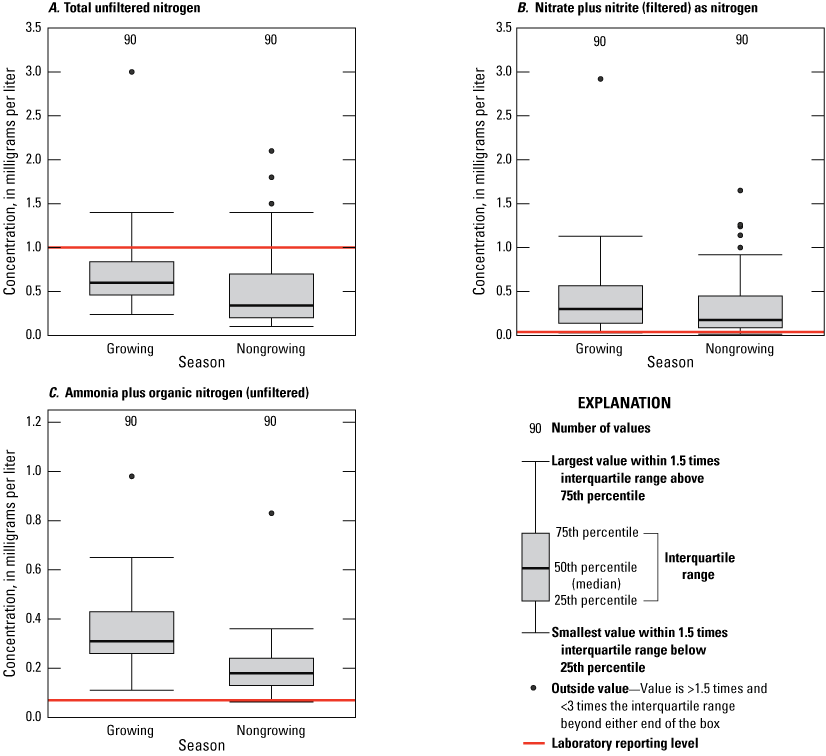
Boxplots displaying the concentrations of A, total unfiltered nitrogen; B, nitrate plus nitrite (filtered) as nitrogen; and C, ammonia plus organic nitrogen (unfiltered), sampled in Connecticut and adjacent areas of New York and Rhode Island in both the growing and nongrowing season sampling events in 2022. Data below the red line may have been censored as less than the laboratory reporting level. Total unfiltered nitrogen (the sum of nitrate plus nitrite, and unfiltered ammonia) has a large variability in the censored data. If one of the constituents used to calculate total unfiltered nitrogen was censored as less than the reporting level, that less-than qualifier was translated to the total unfiltered nitrogen data. All data are accessible in Barclay and others (2023). >, Greater than; <, less than.
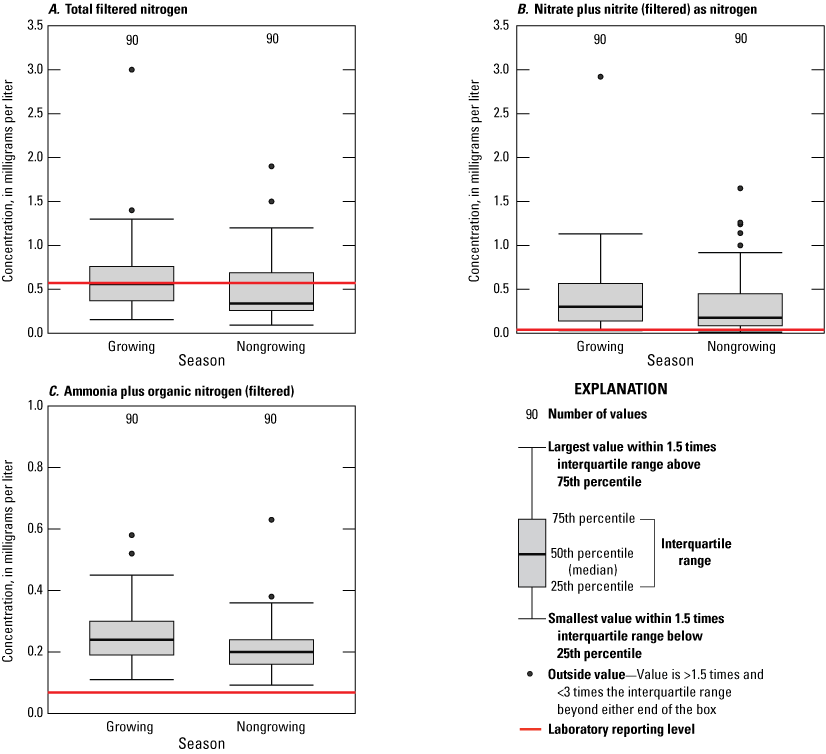
Boxplots displaying the concentrations of A, total filtered nitrogen; B, nitrate plus nitrite (filtered) as nitrogen; and C, ammonia plus organic nitrogen (filtered), sampled in Connecticut and adjacent areas of New York and Rhode Island in both the growing and nongrowing season sampling events in 2022. Data below the red line may have been censored as less than the laboratory reporting level. Total filtered nitrogen (the sum of nitrate plus nitrite, and filtered ammonia) has a large variability in the censored data. If one of the constituents used to calculate total filtered nitrogen was censored as less than the reporting level, that less-than qualifier was translated to the total filtered nitrogen data. All data are accessible in Barclay and others (2023). >, Greater than; <, less than.
Phosphorus (filtered) concentrations ranged from less than 0.003 to 0.026 mg/L during the nongrowing season sampling event and ranged from 0.005 to 0.082 mg/L during the growing season sampling event. Orthophosphate concentrations ranged from less than 0.004 to 0.016 mg/L during the nongrowing season sampling event and ranged from less than 0.004 to 0.079 mg/L during the growing season sampling event.
Chloride concentrations ranged from 3.22 to 154 mg/L during the nongrowing season sampling event and ranged from 3.35 to 172 mg/L during the growing season sampling event. Bromide concentrations ranged from less than 0.01 to 0.106 mg/L during the nongrowing season sampling event and ranged from less than 0.01 to 0.231 mg/L during the growing season sampling event.
The calculated instantaneous nutrient loads and yields are summarized in table 8. Total unfiltered nitrogen loads ranged from less than 0.82 to 38 kg/d for samples collected during the nongrowing season sampling event and ranged from less than 0.39 to 14 kg/d for samples collected during the growing season sampling event. Total unfiltered nitrogen yields ranged from less than 0.15 to 5.0 kilograms per square kilometer per day (kg/d/km2) for samples collected during the nongrowing season sampling event and ranged from less than 0.12 to 2.5 kg/d/km2 for samples collected during the growing season sampling event.
Table 8.
Summary of calculated unfiltered and filtered nitrogen loads and yields at sampling stations in Connecticut and adjacent areas of New York and Rhode Island during nongrowing and growing sampling events in 2022.[All data are accessible in the accompanying data release (Barclay and others, 2023); station names appear as written in the U.S. Geological Survey (USGS) National Water Information System (USGS, 2024b). km2, square kilometer; L/s, liter per second; kg/d, kilogram per day; kg/d/km2, kilogram per day per square kilometer; NG, nongrowing season; G, growing season; <, less than; RI, Rhode Island; CT, Connecticut; BK, brook; RD, road; BRK, brook; NR, near; TRIB, tributary; AVE, avenue; EXT, extension; ABV, above; ST, street; W, west; BR, branch; R, river; E, east; PD, pond; TPKE, turnpike; RTE, route; NY, New York]
Total filtered nitrogen loads ranged from less than 0.72 to 38 kg/d for samples collected during the nongrowing season sampling event and ranged from less than 0.29 to 14 kg/d for samples collected during the growing season sampling event. Total filtered nitrogen yields (fig. 5) ranged from less than 0.13 to 5.2 kg/d/km2 for samples collected during the nongrowing season sampling event and ranged from less than 0.06 to 2.5 kg/d/km2 for samples collected during the growing season sampling event.
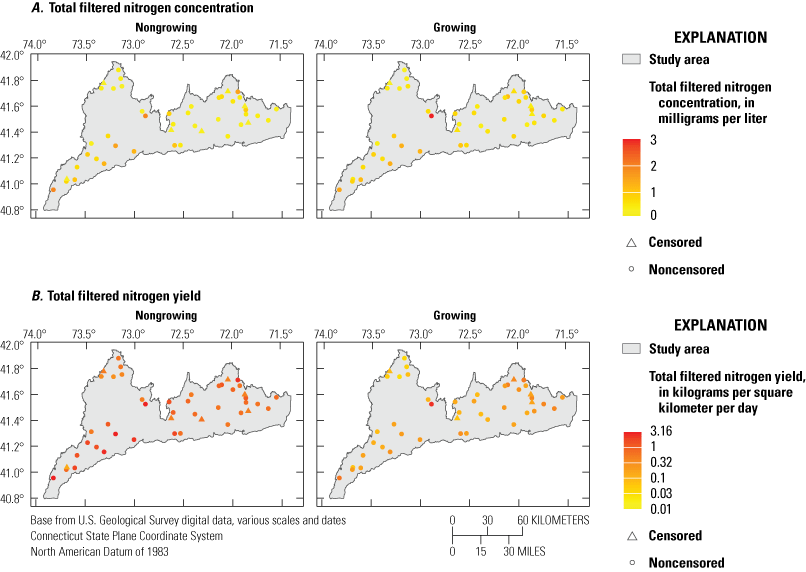
Maps of the study area showing A, the total filtered nitrogen concentration in the nongrowing and growing season sampling events, and B, the total filtered nitrogen yield in the nongrowing and growing season sampling events, at sampling stations in Connecticut and adjacent areas of New York and Rhode Island in 2022.
Quality Assurance and Quality Control of Water-Quality Data
Both blank and replicate samples were collected during this project to assess for potential equipment contamination, as well as the repeatability of analysis. Blank samples are expected to result in nondetect concentrations. Replicate samples are expected to have sample concentration values within 10 percent of the replicated sample concentration values or to have a resulting difference of no more than the laboratory reporting level. Sample results that fall outside this criterion call into question the sample integrity.
No systematic bias or contamination was apparent in the laboratory or field blank data that would have affected the interpretation of the analyses of the water-quality samples. One field blank had a chloride concentration of 0.03 mg/L, close to the laboratory reporting level of 0.02 mg/L (table 1). This was much lower than the concentration in the stream water sample associated with this blank sample (20.5 mg/L), and no sample bias was suspected. Chloride concentrations for all collected samples ranged from 3.22 to 172 mg/L. Consequently, the detection of chloride in the field blank does not indicate any contamination bias in the environmental samples for chloride. All blank and replicate sample results are available in Barclay and others (2023).
The results of the four field replicate samples collected during the study indicate that concentrations of most constituents were accurately replicated with relatively low variability; the relative percent difference between the concentrations in the environmental samples and the replicate samples was less than 10 percent for most constituents. For constituents with relative percent differences greater than 10 percent for environmental and replicate sample pairs, all differences between the replicate and environmental samples were close to the laboratory reporting levels.
Although the blank and replicate results do not indicate any potential for contamination bias or unacceptably high variability in the concentration data, the quality of the analyzed results remains somewhat questionable because many of the laboratory analyses were performed after the established holding times for the analytical methods had elapsed. Approximately 77 percent of the analyses in samples collected for this study were done after the established holding periods for the analytical methods; 42 percent of samples were analyzed after twice the holding period had elapsed (table 9).
Table 9.
Summary of laboratory holding time violations for samples collected at stations in Connecticut and adjacent areas of New York and Rhode Island.[All data can be accessed in Barclay and others (2023); parameter codes are from the U.S. Geological Survey (USGS) National Water Information System (USGS, 2024b)]
The analysis of unfiltered and filtered forms of ammonia plus organic nitrogen had the greatest number of samples analyzed past analytical method holding times. The resulting analytical concentration data for unfiltered and filtered ammonia were reviewed carefully to assess the validity of the results. In a typical sample, concentrations of unfiltered ammonia plus organic nitrogen should be greater than concentrations of filtered ammonia plus organic nitrogen. Of the 100 samples collected (90 environmental samples and 10 quality-control samples), 34 had analytical results (34 percent of the samples) where filtered ammonia nitrogen concentrations were greater than unfiltered concentrations. In 20 of those 34 samples, the differences between filtered and unfiltered concentrations were greater than 10 percent (table 1). In 5 of those 34 samples, the difference was larger than the laboratory reporting level of 0.07 mg/L (table 1). For comparison, 10 years of nutrient data from the USGS streamgage at Indian River at Clinton, Conn. (01195100), was pulled from the USGS National Water Information System database (USGS, 2024a). Of the 121 samples collected at that streamgage, 22 samples (18 percent) had analytical results in which filtered ammonia nitrogen concentrations were greater than unfiltered concentrations. Samples where unfiltered concentrations are less than filtered concentrations call into question the accuracy and validity of the data.
The concentrations of ammonia plus organic nitrogen are used in calculating filtered and unfiltered total nitrogen and represent, on average, 50 percent of the total nitrogen concentrations (Barclay and others, 2023). Consequently, any data-quality issues with the ammonia plus organic nitrogen data because they were analyzed past holding times will also affect the total nitrogen loads and yields calculated in this study. As noted, many of the nitrate plus nitrite analyses were also performed past the holding time, and any resulting data-quality issues with these results could affect the calculated total nitrogen loads and yields. No additional information is currently (2024) available on the stability of concentrations for the specific matrices and analyses represented by the samples collected in this study. Some information on the stability of nutrient concentrations in natural waters can be found in Patton and Gilroy (1998), Maher and Woo (1998), Yorks and McHale (2000), Gardolinski and others (2001), and Moore and Locke (2013). These studies have documented potential instability of nitrogen and phosphorus in water samples. Storage temperature, days from sampling to analysis, and individual water matrices have all been observed to affect the resulting concentration data.
Summary
During the spring and summer of 2022, the U.S. Geological Survey, in cooperation with the U.S. Environmental Protection Agency, conducted two synoptic sampling events during base-flow conditions in small watersheds (from 5 to 30 square kilometers) in the southern part of the Long Island Sound watershed to better understand nutrient contributions from nonpoint sources and groundwater flow. The two sampling events were conducted during the nongrowing season (collected April 24–25, 2022) and the growing season (collected June 30–July 1, 2022). Samples were analyzed for concentrations of nitrogen and phosphorus compounds, chloride, and bromide. A total of 45 locations were selected across a gradient of land-use and surficial geology classifications to help quantify nonpoint source contributions of nutrients. The classifications, derived on the basis of factors expected to increase or decrease base-flow nitrogen loads, focused on the population density of septic system users, the percent agriculture or turf grass cover, the percent impervious cover, and the percent coarse-grained glacial stratified sediment deposits. The resulting water-quality and streamflow data were used to calculate nutrient loads and yields at each sample location.
Quality-control samples, including blank and replicate samples, do not indicate any potential for contamination bias or unacceptably high variability in the concentration data. However, many of the laboratory analyses were performed after the established holding times for the analytical methods had elapsed, which could affect the calculated total nitrogen loads and yields. No additional information is currently (2024) available on the stability of concentrations for the specific matrices and analyses represented by the samples collected in this study.
Total unfiltered nitrogen yields during the nongrowing season ranged from less than 0.15 to 5.0 kilograms per square kilometer per day. Total unfiltered nitrogen yields during the growing season ranged from less than 0.12 to 2.5 kilograms per square kilometer per day. Total filtered nitrogen yields during the nongrowing season ranged from less than 0.13 to 5.2 kilograms per square kilometer per day. Total filtered nitrogen yields during the growing season ranged from less than 0.06 to 2.5 kilograms per square kilometer per day.
Acknowledgments
The authors gratefully acknowledge our U.S. Geological Survey New England Water Science Center colleagues for their assistance in the variety of data-collection activities required by this project: Stephen Banulski, Casey Beaudoin, Ryan Bottorff, Danny Hansen, Donald Jeandervin, Tabatha Lewis, Patrick McNamara, Dee-Ann McCarthy, Nigel Pepin, and Maria Skarzynski. A special thanks to our colleagues in the U.S. Geological Survey New York Water Science Center for their assistance in the data-collection activities at the stations in New York: Michael Stouder and Elaiya Jurney.
References Cited
Barclay, J.R., and Mullaney, J.R., 2021, Simulation of groundwater budgets and travel times for watersheds on the north shore of Long Island Sound, with implications for nitrogen-transport studies: U.S. Geological Survey Scientific Investigations Report 2021–5116, 84 p., accessed August 15, 2024, at https://doi.org/10.3133/sir20215116.
Barclay, J.R., Laabs, K.L., and Mullaney, J.R., 2023, Nitrogen loads, yields, and associated field data collected during base-flow conditions and site attributes for small basins draining to Long Island Sound: U.S. Geological Survey data release, https://doi.org/10.5066/P99IAXUI.
Center for Land Use Education and Research, 2016, Long Island Sound 2010 land cover—Connecticut’s changing landscape land cover: University of Connecticut website, accessed December 5, 2019, at https://clear.uconn.edu/projects/landscape/download/LIS_landcover2010_v2-03_ctstp83.zip.
Connecticut Department of Energy and Environmental Protection, 2005, Connecticut hydrography set: Connecticut Geographic Information System Open Data website, accessed October 21, 2021, at https://ct-deep-gis-open-data-website-ctdeep.hub.arcgis.com/maps/CTDEEP:connecticut-hydrography-set/about.
Connecticut Department of Energy and Environmental Protection, 2019a, Connecticut’s second-generation nitrogen strategy, Long Island Sound, 2017–2022: Connecticut Bureau of Water Protection and Land Reuse webpage, accessed October 26, 2021, at https://portal.ct.gov/-/media/DEEP/water/lis_water_quality/nitrogen_control_program/2ndGenNitrogenStrategypdf.pdf.
Connecticut Department of Energy and Environmental Protection, 2019b, Sewer service area 1998 (Sewer_Service.shp): Connecticut Geographic Information System Open Data website, accessed July 19, 2021, at https://ct-deep-gis-open-data-website-ctdeep.hub.arcgis.com/datasets/sewer-service-area-1998.
Díaz, R.J., and Rosenberg, R., 2011, Introduction to Environmental and Economic Consequences of Hypoxia: International Journal of Water Resources Development, v. 27, no. 1, p. 71–82, accessed February 13, 2023, at https://doi.org/10.1080/07900627.2010.531379.
Falcone, J.A., 2016, U.S. block-level population density rasters for 1990, 2000, and 2010: U.S. Geological Survey data release, accessed June 24, 2021, at https://doi.org/10.5066/F74J0C6M.
Fishman, M.J., ed., 1993, Methods of analysis by the U.S. Geological Survey National Water Quality Laboratory—Determination of inorganic and organic constituents in water and fluvial sediments: U.S. Geological Survey Open-File Report 93–125, 217 p., accessed August 15, 2024, at https://doi.org/10.3133/ofr93125.
Fishman, M.J., and Friedman, L.C., 1989, Methods for determination of inorganic substances in water and fluvial sediments: U.S. Geological Survey Techniques of Water-Resources Investigations, book 5, chap. A1, 545 p., accessed August 15, 2024, at https://doi.org/10.3133/twri05A1.
Gardolinski, P.C.F.C., Hanrahan, G., Achterberg, E.P., Gledhill, M., Tappin, A.D., House, W.A., and Worsfold, P.J., 2001, Comparison of sample storage protocols for the determination of nutrients in natural waters: Water Research, v. 35, no. 15, p. 3670–3678, accessed August 15, 2024, at https://doi.org/10.1016/S0043-1354(01)00088-4.
Gustard, A., Bullock, A., and Dixon, J., 1992, Low flow estimation in the United Kingdom: Institute of Hydrology report 108, [variously paged; 292 p]. [Also available at https://core.ac.uk/download/61638.pdf.]
Hagemann, M., 2023, Streamstats—R bindings to the USGS Streamstats API: R package version 0.0.3, accessed August 15, 2024, at https://github.com/markwh/streamstats/.
Homer, C.G., Dewitz, J.A., Yang, L., Jin, S., Danielson, P., Xian, G., Coulston, J., Herold, N.D., Wickham, J., and Megown, K., 2015, Completion of the 2011 National Land Cover Database for the conterminous United States—Representing a decade of land cover change information: Photogrammetric Engineering and Remote Sensing, v. 81, no. 5, p. 345–354.
Kaushal, S.S., Groffman, P.M., Band, L.E., Elliott, E.M., Shields, C.A., and Kendall, C., 2011, Tracking nonpoint source nitrogen pollution in human-impacted watersheds: Environmental Science & Technology, v. 45, no. 19, p. 8225–8232, accessed August 19, 2024, at https://doi.org/10.1021/es200779e.
Lorenz, D.L., 2017, DVstats—Functions to manipulate daily-values data (ver. 0.3.4): U.S. Geological Survey R software package, accessed June 24, 2021, at https://rdrr.io/github/USGS-R/DVstats/.
Maher, W.A., and Woo, L., 1998, Procedures for the storage and digestion of natural waters for the determination of filterable reactive phosphorus, total filterable phosphorus, and total phosphorus: Analytica Chimica Acta, v. 375, no. 1–2, p. 5–47, accessed August 15, 2024, at https://doi.org/10.1016/S0003-2670(98)00274-8.
Moore, M.T., and Locke, M.A., 2013, Effect of storage method and associated holding time of nitrogen and phosphorus concentrations in surface water samples: Bulletin of Environmental Contamination and Toxicology, v. 91, p. 493–498, accessed August 15, 2024, at https://doi.org/10.1007/s00128-013-1084-6.
New York State Department of Environmental Conservation and Connecticut Department of Environmental Protection, 2000, A total maximum daily load analysis to achieve water quality standards for dissolved oxygen in Long Island Sound, 73 p., accessed January 4, 2023, at https://portal.ct.gov/-/media/DEEP/water/lis_water_quality/nitrogen_control_program/tmdlpdf.pdf.
New York State Museum and New York State Geological Survey, 1999, Surficial geology—Lower Hudson: New York State Museum Technology Center digital dataset [corresponds with original 1989 map sheet], scale 1:250,000, accessed June 4, 2019, at https://www.nysm.nysed.gov/research-collections/geology/gis.
Patton, C.J., and Gilroy, E.J., 1998, U.S. Geological Survey nutrient preservation experiment—Experimental design, statistical analysis, and interpretation of analytical results: USGS Water-Resources Investigations Report 98–4118, accessed August 15, 2024, at https://doi.org/10.3133/wri984118.
Patton, C.J., and Kryskalla, J.R., 2011, Colorimetric determination of nitrate plus nitrite in water by enzymatic reduction, automated discrete analyzer methods: U.S. Geological Survey Techniques and Methods, book 5, chap. B8, 34 p., accessed August 15, 2024, https://doi.org/10.3133/tm5B8.
Patton, C.J., and Truitt, E.P., 2000, Methods of analysis by the U.S. Geological Survey National Water Quality Laboratory—Determination of ammonium plus organic nitrogen by a Kjeldahl digestion method and an automated photometric finish that includes digest cleanup by gas diffusion: U.S. Geological Survey Open-File Report 00–170, 31 p., accessed December 9, 2011, at https://pubs.usgs.gov/of/2000/0170/report.pdf.
Rantz, S.E., and others, 1982, Measurement and computation of streamflow: U.S. Geological Survey Water-Supply Paper 2175, v. 2, 631 p., accessed October 26, 2021, at https://doi.org/10.3133/wsp2175.
Rhode Island Geographic Information System, 1989, Rhode Island glacial deposits—s44ggl88: Rhode Island Geographic Information System (RIGIS) Data Distribution System, accessed July 13, 2018, at https://www.rigis.org/datasets/glacial-deposits.
Rhode Island Geographic Information System, 2012, Rhode Island sewered areas—sewerAreas12: Rhode Island Geographic Information System (RIGIS) Data Distribution System, accessed March 4, 2019, at https://www.rigis.org/datasets/sewered-areas.
Ries, K.G., III, Newson, J.K., Smith, M.J., Guthrie, J.D., Steeves, P.A., Haluska, T., Kolb, K.R., Thompson, R.F., Santoro, R.D., and Vraga, H.W., 2017, StreamStats, version 4: U.S. Geological Survey Fact Sheet 2017–3046, accessed March 4, 2019, at https://doi.org/10.3133/fs20173046.
Rutledge, A.T., 1998, Computer programs for describing the recession of ground-water discharge and for estimating mean ground-water recharge and discharge from streamflow records—Update: U.S. Geological Survey Water-Resources Investigations Report 98–4148, 43 p. accessed October 26, 2021, at https://pubs.er.usgs.gov/publication/wri984148.
Turnipseed, D.P., and Sauer, V.B., 2010, Discharge measurements at gaging stations: U.S. Geological Survey Techniques and Methods book 3, chap. A8, 87 p., accessed October 26, 2021, at https://pubs.usgs.gov/tm/tm3-a8/.
U.S. Environmental Protection Agency [EPA], 1993, Determination of phosphorus by semi-automated colorimetry (revision 2.0), method 365.1 of Methods for the determination of inorganic substances in environmental samples: U.S. Environmental Protection Agency EPA/600/R–93/100, 17 p. [Also available at https://www.epa.gov/sites/default/files/2015-08/documents/method_365-1_1993.pdf.]
U.S. Environmental Protection Agency [EPA], 2021, Facility search—Enforcement and compliance data: Enforcement and Compliance History Online website, accessed October 6, 2021, at https://echo.epa.gov/facilities/facility-search?mediaSelected=all.
U.S. Environmental Protection Agency [EPA] and U.S. Geological Survey [USGS], 2012, National hydrography dataset plus, version 2.1: U.S. Environmental Protection Agency dataset, accessed January 4, 2023, at https://www.epa.gov/waterdata/nhdplus-national-hydrography-dataset-plus.
U.S. Fish and Wildlife Service, 2018, National wetlands inventory: U.S. Fish and Wildlife Service website, accessed April 29, 2019, at https://www.fws.gov/wetlands/.
U.S. Geological Survey [USGS], Connecticut Department of Energy and Environmental Protection, and Geological and Natural History Survey, 2005, Connecticut quaternary geology and surficial materials polygon: Connecticut Department of Energy and Environmental Protection dataset, accessed August 27, 2021, at https://ct-deep-gis-open-data-website-ctdeep.hub.arcgis.com/datasets/CTDEEP:quaternary-geology/about.
U.S. Geological Survey [USGS], 2024a, USGS 01195100 Indian River near Clinton, CT, in USGS water data for the Nation: U.S. Geological Survey National Water Information System database, accessed March 20, 2024, at https://doi.org/10.5066/F7P55KJN. [Site information directly accessible at https://nwis.waterdata.usgs.gov/usa/nwis/qwdata/?site_no=01195100.]
U.S. Geological Survey [USGS], 2024b, USGS water data for the Nation: U.S. Geological Survey National Water Information System database, accessed March 20, 2024, at https://doi.org/10.5066/F7P55KJN.
U.S. Geological Survey [USGS], [variously dated], National field manual for the collection of water-quality data, section A of Handbooks for water-resources investigations: U.S. Geological Survey Techniques of Water-Resources Investigations, book 9, 10 chap. (A0–A8, A10), accessed March 20, 2024, at https://doi.org/10.3133/twri09.
Westchester County Department of Planning, 2015, Sewer districts: Westchester County webpage, accessed March 4, 2019, at https://giswww.westchestergov.com/download/wcsewdst.zip.
Wherry, S.A., Tesoriero, A.J., and Terziotti, S., 2021, Factors affecting nitrate concentrations in stream base flow: Environmental Science & Technology, v. 55, no. 2, p. 902–911, accessed April 30, 2021, at https://doi.org/10.1021/acs.est.0c02495.
Whitney, M.M., and Vlahos, P., 2021, Reducing hypoxia in an urban estuary despite climate warming: Environmental Science & Technology, v. 55, no. 2, p. 941–951, accessed January 4, 2023, at https://doi.org/10.1021/acs.est.0c03964.
Winter, T.C., Harvey, J.W., Franke, O.L., and Alley, W.M., 1998, Groundwater and surface water—A single resource: U.S. Geological Survey Circular 1139, 87 p., accessed on August 15, 2024, at https://doi.org/10.3133/cir1139.
Yorks, T.E., and McHale, P.J., 2000, Effects of cold storage on anion, ammonium, and total nitrogen concentrations in soil water: Communications in Soil Science and Plant Analysis, v. 31, no. 1–2, p. 141–148, accessed January, 2023, at https://doi.org/10.1080/00103620009370425.
Conversion Factors
Datums
Vertical coordinate information is referenced to the North American Vertical Datum of 1988 (NAVD 88).
Horizontal coordinate information is referenced to the North American Datum of 1983 (NAD 83).
Supplemental Information
Specific conductance is given in microsiemens per centimeter at 25 degrees Celsius (µS/cm at 25 °C).
Concentrations of chemical constituents in water are given in milligrams per liter (mg/L).
Constituent loads are constituent concentration data multiplied by streamflow and are given in kilograms per day (kg/d).
Constituent yields are area-normalized loads and are given in kilograms per square kilometer per day (kg/d/km2).
A water year is the 12-month period from October 1 through September 30 of the following year and is designated by the calendar year in which it ends.
For more information, contact:
Director, New England Water Science Center
U.S. Geological Survey
10 Bearfoot Road
Northborough, MA 01532
dc_nweng@usgs.gov
or visit our website at
Disclaimers
Any use of trade, firm, or product names is for descriptive purposes only and does not imply endorsement by the U.S. Government.
Although this information product, for the most part, is in the public domain, it also may contain copyrighted materials as noted in the text. Permission to reproduce copyrighted items must be secured from the copyright owner.
Suggested Citation
Laabs, K.L., Barclay, J.R., and Mullaney, J.R., 2025, Base-flow sampling to enhance understanding of the groundwater flow component of nitrogen loading in small watersheds draining into Long Island Sound: U.S. Geological Survey Data Report 1206, 23 p., https://doi.org/10.3133/dr1206.
ISSN: 2771-9448 (online)
Study Area
| Publication type | Report |
|---|---|
| Publication Subtype | USGS Numbered Series |
| Title | Base-flow sampling to enhance understanding of the groundwater flow component of nitrogen loading in small watersheds draining into Long Island Sound |
| Series title | Data Report |
| Series number | 1206 |
| DOI | 10.3133/dr1206 |
| Publication Date | March 13, 2025 |
| Year Published | 2025 |
| Language | English |
| Publisher | U.S. Geological Survey |
| Publisher location | Reston, VA |
| Contributing office(s) | New England Water Science Center |
| Description | Report: v, 23 p.; Data Release |
| Country | United States |
| State | Connecticut, New York, Rhode Island |
| Online Only (Y/N) | Y |
| Additional Online Files (Y/N) | N |