

Bathymetric and Acoustic-Backscatter Mapping of Lake Sammamish, Washington, During USGS Field Activity 2021-656-FA
Links
- Document: Report (9.1 MB pdf) , HTML , XML
- Related Work: Scientific Investigations Map 3537 - Colored shaded-relief bathymetry and acoustic backscatter of Lake Sammamish, Washington
- Data Release: USGS data release - Bathymetry and acoustic-backscatter data for Lake Sammamish, Washington collected during USGS field activity 2021–656-FA
- NGMDB Index Page: National Geologic Map Database Index Page
- Download citation as: RIS | Dublin Core
Abstract
In 2021, scientists from the U.S. Geological Survey (USGS) acquired bathymetric and acoustic-backscatter data within Lake Sammamish, Washington. Mapping was completed to find evidence of past earthquakes such as underwater landslides and is part of a larger USGS project to understand the overall geologic hazards history of the Cascadia Margin region. The survey was conducted using the USGS research vessel Parke Snavely outfitted with an interferometric sidescan-sonar system for swath mapping. Three estimates of bathymetric uncertainty were calculated from the post-processed bathymetric data. This report provides a summary of the mapping mission.
Introduction
In November 2021, the U.S. Geological Survey (USGS) acquired high-resolution bathymetric and co-registered acoustic-backscatter data in Lake Sammamish, Washington, approximately 15 miles east of Seattle (fig. 1). During USGS field activity 2021-656-FA (https://compass.er.usgs.gov/datadxny/activity.php?id=8818), mapping was completed to find evidence of past earthquakes in the region, such as underwater landslides. This is part of a larger USGS project to understand the overall geologic hazards history of the Cascadia Margin region. Mapping Lake Sammamish was one part of a larger data collection effort within the lake that included chirp seismic-reflection profiling and the collection of lake floor sediment cores.
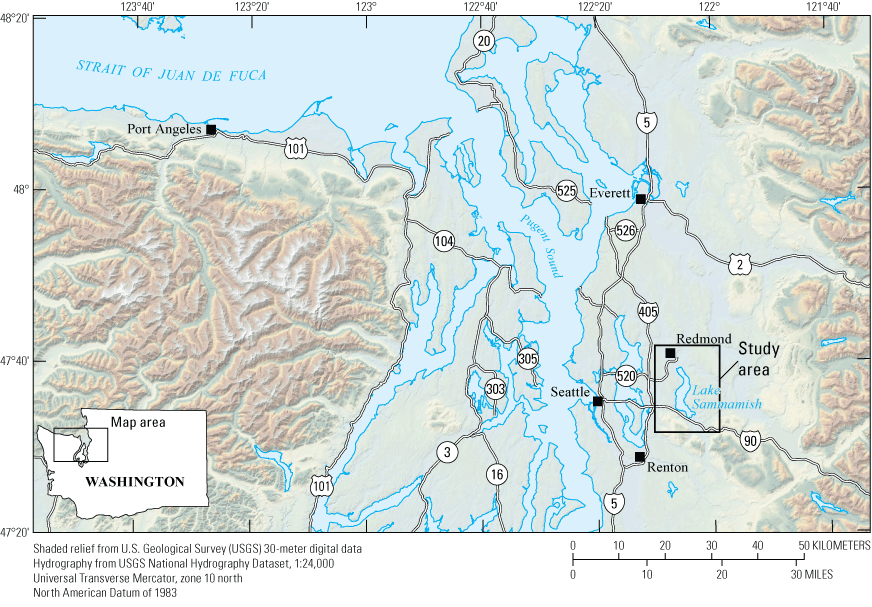
Location of Lake Sammamish, Washington, east of Seattle, mapped by the U.S. Geological Survey Pacific Coastal and Marine Science Center in 2021.
These new data could be used to help researchers, lake managers, and other stakeholders better understand the lake environments; for example, identifying lake floor features not previously imaged in such detail. This information can improve understanding of the natural hazard history of the northern Cascades region. This report provides a summary of the USGS 2021 bathymetric and acoustic-backscatter data acquisition, post-processing steps, and estimates of bathymetric uncertainty, along with figures of the bathymetric and acoustic backscatter data. An accompanying USGS data release provides the bathymetric and acoustic-backscatter data in Geographic Information Systems (GIS)-ready formats along with Federal Geographic Data Committee (FGDC) metadata that are available in Dartnell and others (2025).
Mapping Operations
Mapping of Lake Sammamish was completed aboard the USGS research vessel (R/V) Parke Snavely (fig. 2). Bathymetric and acoustic backscatter data were collected with a 234.5 kilohertz (kHz) SEA (Systems Engineering and Assessment, United Kingdom; acquired by ITER Systems [La Motte-Servolex, France] in 2011) SWATHplus-M phase-differencing sidescan-sonar system pole-mounted on the R/V Parke Snavely. The sonar system includes 3 transducers port and starboard looking transducers as well as a forward-looking transducer that is used to fill the data gap at nadir. During mapping, an Applanix (Applanix Corporation, Richmond Hill, Ontario, Canada; acquired by Trimble Incorporation [Westminster, Colorado] in 2003) Wavemaster Position and Orientation System for Marine Vessels (POS-MV) used inputted global position system (GPS) data to locate the vessel during data collection, and also accounted for vessel motion, such as heave, pitch, and roll. The POS-MV also recorded position and vessel motion parameters for later post-processing. Throughout the survey, sound-velocity profiles were derived from conductivity/temperature/density (CTD) casts and immediately incorporated into data acquisition. The R/V Parke Snavely was equipped with a real-time data coverage display, ensuring the current survey line had good data overlap with adjacent lines (approximately 20–25 percent). Bathymetric and acoustic-backscatter data were recorded using the SWATHplus acquisition software, Bathyswath (version 3.15.20.0; ITER Systems, 2013). The software uses a series of adjustable filters to highlight the lake-floor soundings from a point cloud of potential soundings across swath that are recorded into a processed survey line file. Prior to running the mapping survey, a calibration was run to measure roll offsets of the port and starboard transducers and elevation and skew offsets of the forward-looking transducer. These offsets were applied to the SWATHplus acquisition session files.
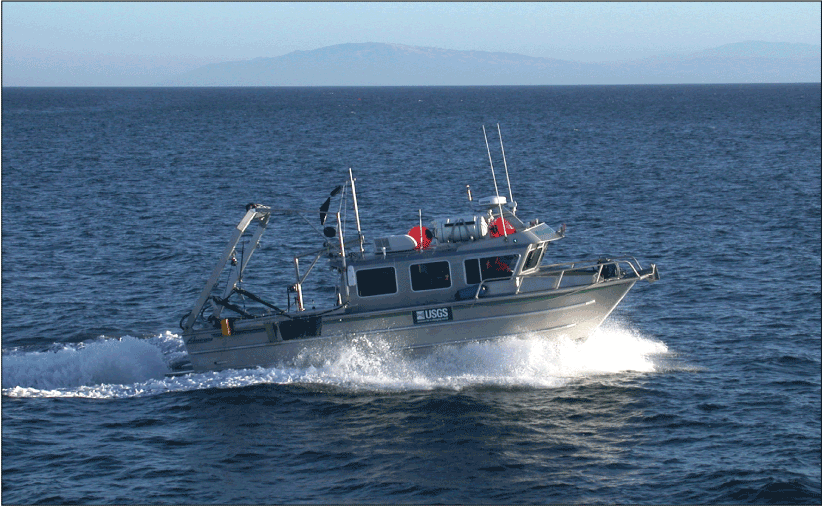
Photograph of the U.S. Geological Survey research vessel Parke Snavely.
Data Collection Accuracies
The vertical and horizontal bathymetric accuracies decrease with increasing angles away from nadir. The Applanix POS-MV post-processed horizontal positional accuracy is about 0.1 meter (m) with a vertical positional accuracy of about 0.2 m. Roll and pitch accuracies are about 0.02 degrees (°) (Applanix Corporation, n.d.). The SWATHplus sonar system (234 kHz) has an across track resolution of about 2 centimeters (cm), a measurement resolution limit of about 6 millimeters (mm), and a resolution detection limit of about 3 mm. Horizontal and vertical accuracies of the final products may be lower due to total propagated uncertainties of the mapping systems, which include sonar system, position and motion compensation system, and navigation, as well as data processing that includes sounding cleaning, gridding, and datum transformations.
Post-Processing
The recorded Applanix POS-MV data were post-processed using POSPac Mobile Mapping Suite (MMS) software (version 8.3). The software incorporates post-processed GPS data from Continuous Operating Reference Stations (CORS; National Oceanic and Atmospheric Administration [NOAA], 2021). After data quality checks, a virtual base-station is generated at the survey vessel. A smoothed best estimate of trajectory (SBET) file is then generated which precisely corrects for vessel motion and maps the data to the World Geodetic System of 1984 (WGS 84) ellipsoid. The SBET data were merged with the original survey line files using Bathyswath (version 3.15.20.0; ITER Systems, 2013) and new survey lines files were generated mapped to the WGS 84 ellipsoid. The new, post-processed survey line files were imported into Chesapeake Tech, Inc. (Los Altos, California) SonarWiz software (version 6). The data were cleaned for obvious sounding errors and gridded into a 2-m base surface. The clean base surface was exported as an ERDAS Imagine grid file in Universal Transverse Mercator (UTM), zone 10 north coordinates, vertically referenced to the WGS 84 ellipsoid. The Imagine bathymetric surface was imported into Esri ArcMap software (version 10.8.1; Redlands, California).
National Oceanic and Atmospheric Administration (NOAA) on-line VDatum transformation tool states there is a positive 23.688-meter difference between the WGS 84 ellipsoid and the North American Vertical Datum of 1988 (NAVD 88) at the center of Lake Sammamish (lat 47°36ʹ27.9354ʺ N., long 122°5ʹ20.9184ʺ W.). Using ArcTools raster math, a value of 23.688 was added to the Lake Sammamish bathymetric WGS 84 surface to transform the bathymetric values to the NAVD 88. Finally, the NAVD 88 bathymetric surface was projected from the WGS 84 horizontal datum to NAD 83 datum with ArcTools Project Raster Tool (WGS_1984_ITRF08_To_NAD_1983_2011) to generate a final bathymetric surface in UTM, zone 10, north, NAD 83 coordinates, vertically referenced to NAVD 88 (fig. 3). The bathymetric surface was vertically referenced to NAVD 88 to merge with surrounding topographic data.
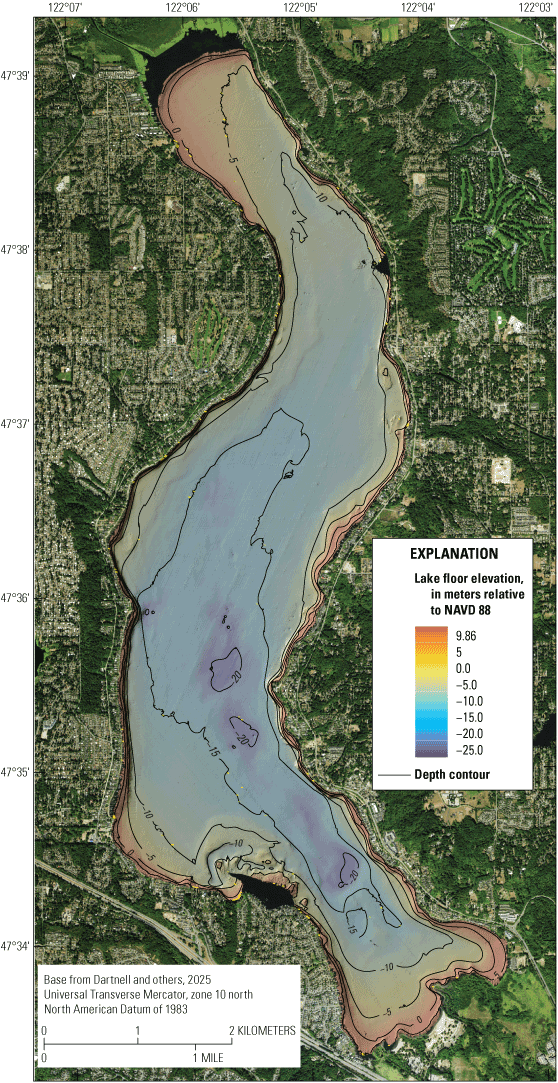
Bathymetric map of Lake Sammamish, Washington, from the 2021 U.S. Geological Survey SWATHplus survey (Dartnell and others, 2025). Surrounding land imagery from National Oceanic and Atmospheric Administration (2015; https://coast.noaa.gov/dataviewer/#/). NAVD 88, North American Vertical Datum of 1988.
Acoustic-backscatter data were processed in the SonarWiz software (version 6). Backscatter data were normalized in all the combined survey lines. The data were then gridded into a 2-m resolution 16-bit, gray-scale image. The image was exported as an ERDAS Imagine image in UTM, zone 10, north, WGS 84 coordinates. The image was imported into ArcMap and projected from the WGS 84 horizontal datum to the NAD 83 datum with ArcTools Project Raster Tool (WGS_1984_ITRF08_To_NAD_1983_2011) to generate a final acoustic-backscatter image in UTM, zone 10, north, NAD 83 coordinates (fig. 4).
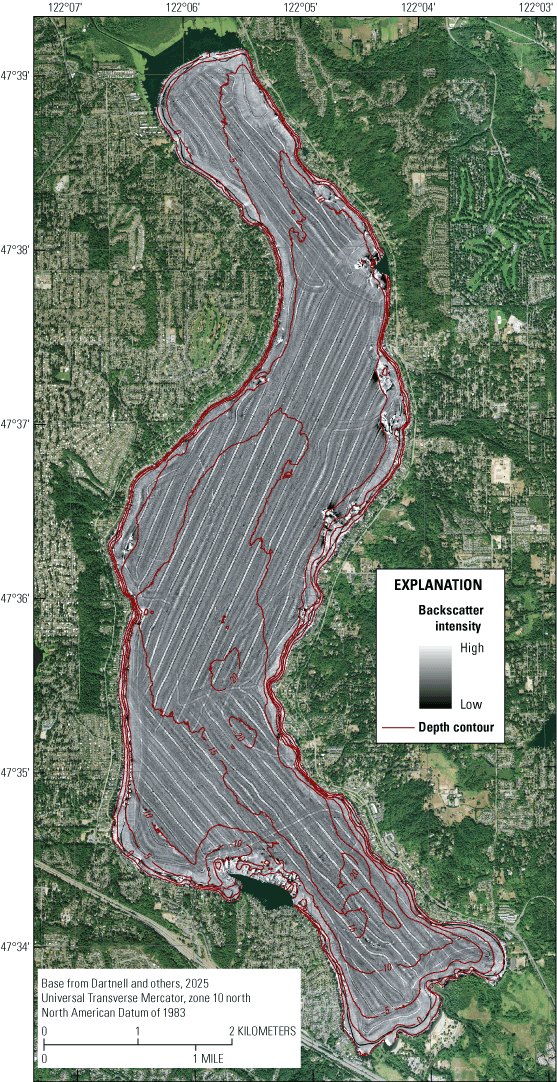
Acoustic-backscatter map of Lake Sammamish, Washington, from the 2021 U.S. Geological Survey SWATHplus survey (Dartnell and others, 2025). Linear features are data collection and processing artifacts. Surrounding land imagery from National Oceanic and Atmospheric Administration (2015; https://coast.noaa.gov/dataviewer/#/).
Assessments of Bathymetric Uncertainties
Although the USGS collects bathymetric and acoustic backscatter data for research purposes only and not for navigational purposes, mapping Lake Sammamish provides an opportunity to determine the propagated uncertainties of the bathymetric data from data acquisition through final map generation. Mapping was conducted under ideal conditions with no swell and little wind chop, and the center of the lake generally had low relief, which removes uncertainties associated with vessel motion and higher lake-floor slopes. Estimates of bathymetric uncertainty were calculated from the survey lines using three different methods. First, in the SonarWiz software, bathymetric standard deviation (fig. 5) and uncertainty (fig. 6) were generated in two separate areas within the center, low-relief regions of the lake. Table 1 shows the minimum, maximum, mean uncertainty, and standard deviation statistics of the two regions.
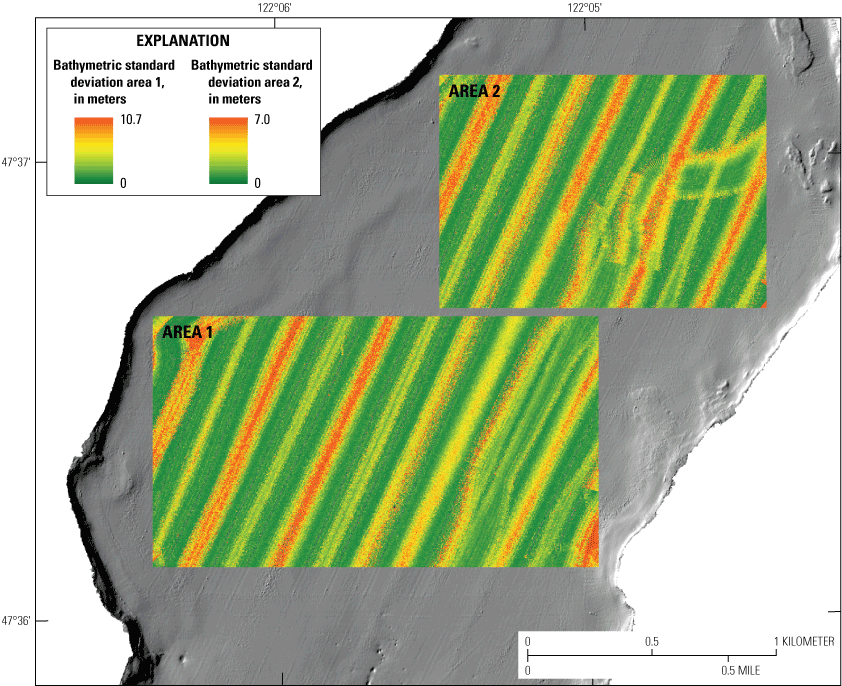
Bathymetric standard deviations calculated from the Lake Sammamish, Washington, 2021 U.S. Geological Survey SWATHplus survey data (Dartnell and others, 2025). Calculations were run in two separate regions in flatter, lower relief areas of the lake.
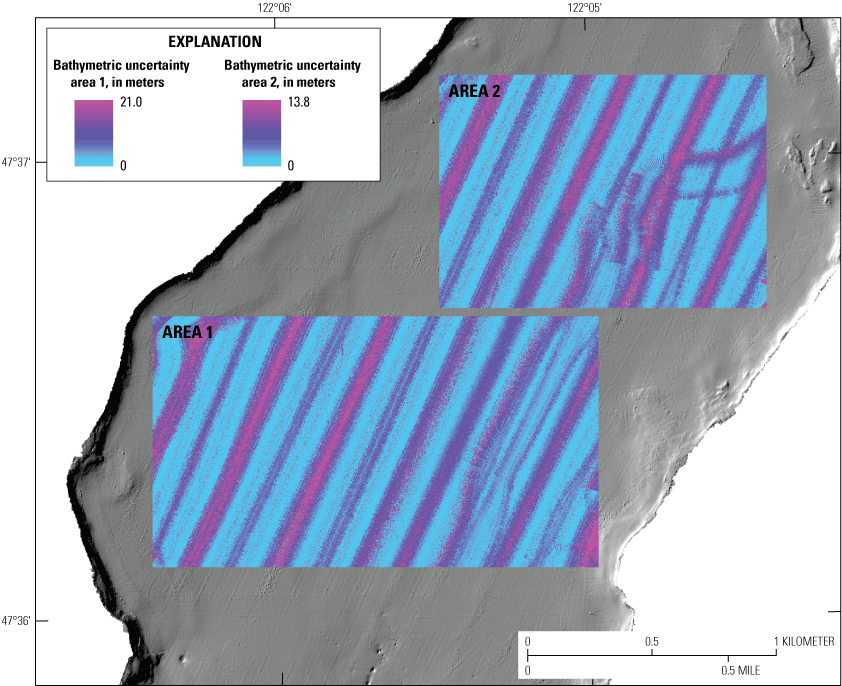
Bathymetric uncertainty calculated from the Lake Sammamish, Washington, 2021 U.S. Geological Survey SWATHplus survey data (Dartnell and others, 2025). Calculations were run in two separate regions in flatter, lower relief areas of the lake.
Table 1.
Uncertainty and standard deviation statistics for two regions in the center of Lake Sammamish, Washington, from the U.S. Geological Survey 2021 bathymetric survey data (Dartnell and others, 2025).[m, meters]
A second method to estimate bathymetric uncertainty was to compare the bathymetric survey data which were generally collected in north-south orientated lines with bathymetric data collected during the chirp seismic-reflection profile data collection, which were generally collected in east-west orientated lines (fig. 7). This allows comparisons of bathymetric values between the standard bathymetric survey and the crosslines. In SonarWiz, bathymetric data were clipped from the bathymetric survey data and the crosslines separately in the same two regions as the above standard deviation and uncertainty grids (figs. 5 and 6). Differences were calculated between the two grids. Table 2 shows the difference statistics, including minimum, maximum, and mean differences, along with standard deviations.
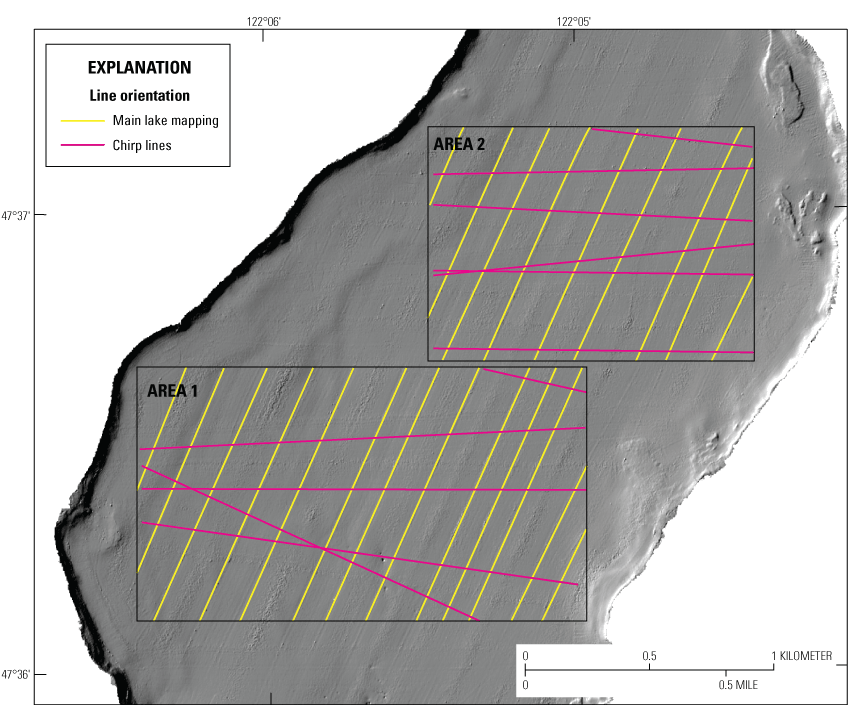
Map showing the bathymetric survey lines and the chirp seismic-reflections lines used for the bathymetric uncertainty comparisons. Data from Dartnell and others (2025).
Table 2.
Bathymetric difference statistics between the standard bathymetric survey data and the cross lines collected during the seismic-reflection data collection (Dartnell and others, 2025).[m, meters]
A third method of calculating bathymetric uncertainty is to calculate total vertical uncertainty (International Hydrographic Organization [IHO], 2008) using the standard deviation data. Standard deviations are a good indication of the distribution of uncertainty in bathymetric soundings. However, bathymetric errors naturally increase with depth and angles from the sonar system. By comparing calculated total vertical uncertainty (TVU) with standardized IHO TVU survey order thresholds, which are based on a combination of coverage, depth, and accuracy (IHO, 2008), we can access the bathymetric uncertainties of the data in this report. Following the methods of Ritchie, and others (2010), TVU is defined as TVU(x,y) = 1.96 x σ(x,y), (1) where σ(x,y) is the standard deviation of a cell located at coordinate (x,y). The TVU’s were calculated for the Lake Sammamish survey data from the two standard deviation grids using GIS raster math with equation 1.
Results
In the winter of 2021, the USGS collected and processed bathymetric and acoustic-backscatter data within Lake Sammamish, Washington using a SWATHplus interferometric bathymetric sidescan-sonar system. Lake Sammamish is over 10 kilometers (km) long and over 2 km wide. Lake-floor elevations relative to the NAVD-88 datum range from 9.9 m to -25.0 m. The lake floor is mainly flat with low relief however, there is a relatively rougher lake floor in the southwestern portion of the lake. Steeper sides surround the lake (fig 3).
Three estimates of bathymetric uncertainty were calculated with the final Lake Sammamish bathymetric data. After all the data were “cleaned” to remove obvious sounding outliers, uncertainty and standard deviation grids were generated for two low-relief regions in the center of the lake using the processing software. The mean uncertainties for the two regions were 0.35 m and 0.37 m, while the mean standard deviations were 0.18 m and 0.19 m, respectively. Both regions have mean elevations (relative to NAVD 88) of negative 38 m, so the mean uncertainties are 0.9 percent and 1.0 percent of the range of elevations. The calculated mean TVUs for the two regions were 0.35 and 0.37, and these fall within the IHO standard for first-order surveys of 0.5 m for areas shallower than 100 m (IHO, 2008). However, there are outlier cells that exceed both first- and even second-order standard thresholds. This is a similar result to a USGS 2010–2011 survey using similar mapping equipment and survey vessel but with a different MRU and in an ocean environment (Dartnell and others, 2012). Figure 8 shows the two TVU grids color-coded for the IHO orders. Combining the two TVU grids, 76.6 precent of the 2 m TVU grid cells fall within the IHO standard for first-order surveys, 17.4 percent of the cells fall within second-order surveys, and 6.0 percent are above second-order surveys. The highest standard deviations, uncertainties, and TVU values are found in the regions where swaths overlap. The final bathymetric and acoustic backscatter surfaces and accuracy assessments show that this mapping system accurately maps the bathymetry of shallow-water lakes. This report provides information that could inform further data collection and could be used to find evidence of past earthquakes in the region, such as underwater landslides (Karlin and others, 2004; Leithold and others, 2019; Brothers and others, 2024). The Lake Sammamish bathymetric and acoustic-backscatter data described in this report along with FGDC metadata are provided in Dartnell and others (2025).
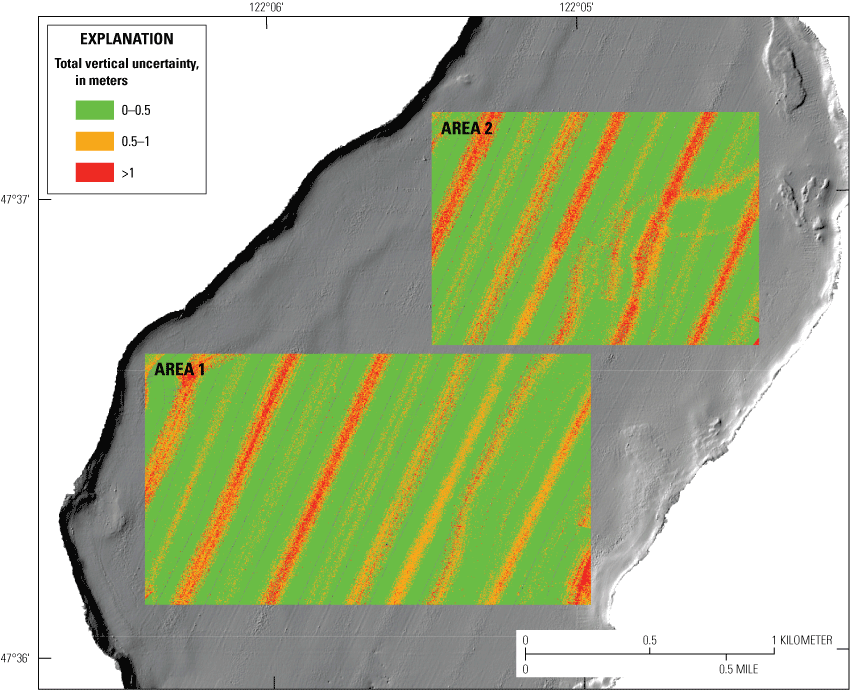
Total Vertical Uncertainty (TVU) within two low-relief regions of Lake Sammamish, Washington, color-coded for International Hydrographic Organization (IHO) orders. Data from Dartnell and others (2025).
References Cited
Applanix Corporation, n.d., Applanix POS MV—WaveMaster II: Trimble, Inc. datasheet, 2 p., accessed April 17, 2025, at https://assets.ctfassets.net/9k5dj5b59lqq/2h2iGgUjp1XXvpRKQFBWKu/40df6ee0056a5d9605e557e16638ddbc/022520-028A-2-en-US-POSMV-WaveMaster-II_USL_0125_LR. pdf.
Brothers, D.S., Sherrod, B., Singleton, D., Padgett, J., Hill, J., Ritchie, A., Kluesner, J., and Dartnell, P., 2024, Post-glacial stratigraphy and late Holocene record of great Cascadia Earthquakes in Ozette Lake, Washington, USA: Geosphere, v. 20, no. 5, p. 1315–1346, https://doi.org/10.1130/GES02713.1.
Dartnell, P., Finlayson, D.P., Ritchie, A.C., Cochrane, G.R., and Erdey, M.D., 2012, Bathymetry and acoustic backscatter—Outer mainland shelf, eastern Santa Barbara Channel, California: U.S. Geological Survey data series 702, 6 p., and GIS data, accessed December 4, 2024, at https://pubs.usgs.gov/ds/702/.
Dartnell, P., Brothers, D.S., Sherrod, B., Hatcher, G.A., Powers, D.C., Hill, J.C., Currie, J.E., and Dal Ferro, P., 2025, Bathymetry and acoustic-backscatter data for Lake Sammamish, Washington collected during USGS field activity 2021-656-FA, U.S. Geological Survey data release, https://doi.org/10.5066/P1YKDHGC.
International Hydrographic Organization [IHO], 2008, IHO standards for hydrographic surveys (5th ed.): Monaco, International Hydrographic Bureau, IHO Special Publication 44, 28 p. [Also available at https://doi.org/10.25607/OBP-1354.]
ITER Systems, 2013, Bathyswath-2 (ver. 3.15.20.0, 2015): ITER Systems software release, accessed April 16, 2025, at https://www.iter-systems.com/bathyswath-2/.
Karlin, R.E., Holmes, M., Abella, S.E.B., and Sylwester, R., 2004, Holocene landslides and a 3500-year record of Pacific Northwest earthquakes from sediments in Lake Washington: Geological Society of America Bulletin, v. 116, no. 1–2, p. 94–108, https://doi.org/10.1130/B25158.1.
Leithold, E.L., Wegmann, K.W., Bohnenstiehl, D.R., Joyner, C.N., and Pollen, A.F., 2019, Repeated megaturbidite deposition in Lake Crescent, Washington, USA, triggered by Holocene ruptures of the Lake Creek-Boundary Creek fault system: Geological Society of America Bulletin, v. 131, no. 11–12, p. 2039–2055, https://doi.org/10.1130/B35076.1.
Liesch, B.A., 1955, Record of wells, water levels, and quality of ground water in the Sammamish Lake area, King County, Washington: U.S. Geological Survey Open-File Report 55–96, https://doi.org/10.3133/ofr5596.
National Oceanic and Atmospheric Administration [NOAA], 2015, Digital Coast—Data access viewer—Imagery: National Oceanic and Atmospheric Administration, accessed August 25, 2015, at https://coast.noaa.gov/dataviewer/#/.
National Oceanic and Atmospheric Administration [NOAA], 2021, Continuously Operating Reference Station (CORS)—Reference stations LKCP, P434, P416, P424, PCOL: National Oceanic and Atmospheric Administration, accessed December 2, 2021, at https://www.ngs.noaa.gov/CORS/.
Ritchie, A.C., Finlayson, D.P., and Logan, J.B., 2010, Swath bathymetry surveys of the Monterey Bay area from Point Año Nuevo to Moss Landing, San Mateo, Santa Cruz, and Monterey Counties, California: U.S. Geological Survey data series 514, accessed December 4, 2024, at https://pubs.usgs.gov/ds/514/.
Moffett Field Publishing Service Center, California
Manuscript approved for publication February 14, 2025
Edited by Crystal Czarniecki
Illustration support by Katie Sullivan and Cory Hurd
Layout and design by Kimber Petersen
Disclaimers
Note that the USGS collects bathymetric data for scientific purposes only. The USGS does not guarantee that full bottom search has been achieved and the data have not been inspected for dangers to navigation. These data are not intended to be used for navigation.
Any use of trade, firm, or product names is for descriptive purposes only and does not imply endorsement by the U.S. Government.
Although this information product, for the most part, is in the public domain, it also may contain copyrighted materials as noted in the text. Permission to reproduce copyrighted items must be secured from the copyright owner.
Suggested Citation
Dartnell, P., Brothers, D.S., Sherrod, B., Hatcher, G.A., Powers, D.C., Hill, J.C., Currie, J.E., and Dal Ferro, P., 2025, Bathymetric and acoustic-backscatter mapping of Lake Sammamish, Washington, during USGS field activity 2021–656-FA: U.S. Geological Survey Data Report 1207, 9 p., https://doi.org/10.3133/dr1207.
ISSN: 2771-9448 (online)
Study Area
| Publication type | Report |
|---|---|
| Publication Subtype | USGS Numbered Series |
| Title | Bathymetric and acoustic-backscatter mapping of Lake Sammamish, Washington, during USGS field activity 2021-656-FA |
| Series title | Data Report |
| Series number | 1207 |
| DOI | 10.3133/dr1207 |
| Publication Date | September 26, 2025 |
| Year Published | 2025 |
| Language | English |
| Publisher | U.S. Geological Survey |
| Publisher location | Reston, VA |
| Contributing office(s) | Pacific Coastal and Marine Science Center |
| Description | Report: iii, 9 p.; Data Release |
| Country | United States |
| State | Washington |
| Other Geospatial | Lake Sammamish |
| Online Only (Y/N) | Y |