

Assessment of Active Sand Volumes at Rockaway Beach and Fire Island in New York and Seven Mile Island in New Jersey
Links
- Document: Report (8.47 MB pdf) , HTML , XML
- Data Releases:
- USGS Data Release - Archive of chirp sub-bottom profile geophysical data collected in 2014 from Fire Island, New York
- USGS Data Release - Archive of chirp subbottom profile data collected in June 2018 from Fire Island, New York
- USGS Data Release - Coastal bathymetry data collected in June 2018 from Fire Island, New York—Wilderness breach and shoreface
- USGS Data Release - Archive of chirp subbottom profile data collected in 2019 from Rockaway Peninsula, New York
- USGS Data Release - Coastal bathymetry and backscatter data collected in September and October 2019 from Rockaway Peninsula, New York
- USGS Data Release - Coastal bathymetry and backscatter data collected in June 2021 from Rockaway Peninsula, New York
- USGS Data Release - Coastal multibeam bathymetry data collected in 2018 offshore of Seven Mile Island, New Jersey
- USGS Data Release - Coastal multibeam bathymetry and backscatter data collected in May 2021 from Seven Mile Island, New Jersey
- USGS Data Release - Archive of chirp subbottom profile data collected in 2022 from Seven Mile Island, New Jersey
- USGS Data Release - Coastal single-beam bathymetry data collected in 2022 off Seven Mile Island, New Jersey
- USGS Data Release - Coastal multibeam bathymetry and backscatter data collected in May 2023 from Seven Mile Island, New Jersey
- NGMDB Index Page: National Geologic Map Database Index Page (html)
- Download citation as: RIS | Dublin Core
Acknowledgments
This work was funded by the National Fish and Wildlife Foundation. The authors thank all the U.S. Geological Survey marine operations and research personnel who participated in the nine surveys over 9 years and processed single-beam bathymetry, multibeam bathymetry, and seismic chirp data that made this comparison report possible. We would also like to thank Julie Bernier and Christine Kranenburg for their thorough and insightful reviews.
Abstract
Between 2018 and 2023, the U.S. Geological Survey assessed shoreface sediment availability at three Atlantic Coast barrier island study sites in support of a National Fish and Wildlife Foundation project entitled, “Monitoring Hurricane Sandy Beach and Marsh Resilience in New York and New Jersey.” The three study sites are Seven Mile Island, New Jersey, Rockaway Beach peninsula, New York, and Fire Island, N.Y. Previously interpreted geologic boundaries from shoreface geophysical surveys and data from repeat bathymetric surveys at each of the study sites were integrated to quantify the active sediment volume, or the volume of sediment that could contribute to beach and shoreline behavior over annual to decadal time scales. This report describes the methods used to calculate these volumes and the variability of active sediment volume for each survey at the three study sites. Our data show that when shoreface volumes account for varying alongshore extent of each study site, Seven Mile Island and Rockaway Beach peninsula have about 1.5 times the active sediment volume measured at Fire Island.
Introduction
Quantifying the amount of shoreface sediment available to barrier islands is important for understanding how shorelines will respond to sea-level rise and storms (Kinsela and others, 2020). Further, understanding spatial variations in shoreface sediment availability may guide the development of sediment management priorities used by coastal managers. In October 2012, the Atlantic coastline from North Carolina to Connecticut was impacted by Hurricane Sandy (Blake and others, 2013). As a result of these impacts, many coastal communities pursued coastal restoration projects that sought to improve the condition of beaches and marshes (U.S. Army Corps of Engineers [USACE], 2016, 2019). To support a National Fish and Wildlife Foundation (NFWF)-led effort to evaluate the effectiveness of those restoration projects, the U.S. Geological Survey (USGS) received funding to conduct a remote sensing and in situ monitoring campaign of the shorelines, beaches, and marshes along the New York and New Jersey coastlines at three sites: Seven Mile Island, New York; Rockaway Beach, N.Y., alternatively called Rockaway Peninsula by Wei and others (2021), and Wei and Miselis (2022); and Fire Island, N.Y. Seven Mile Island, New Jersey (NFWF project no. 41991) and Rockaway Beach peninsula, N.Y. (NFWF project no. NPS-1A) sites (fig. 1B–C) were included within the NFWF project entitled, “Monitoring Hurricane Sandy Beach and Marsh Resilience in New York and New Jersey.” Fire Island, N.Y. (fig. 1D; Hurricane Sandy Supplemental Task USGS-GS2-2B) was added as a control, because it is less developed than the other two sites and the USGS had an existing monitoring project at this location. Remote sensing monitoring spanned the coastlines of New York and New Jersey, whereas in situ monitoring activities occurred at Seven Mile Island, N.J., and Rockaway Beach peninsula, N.Y.
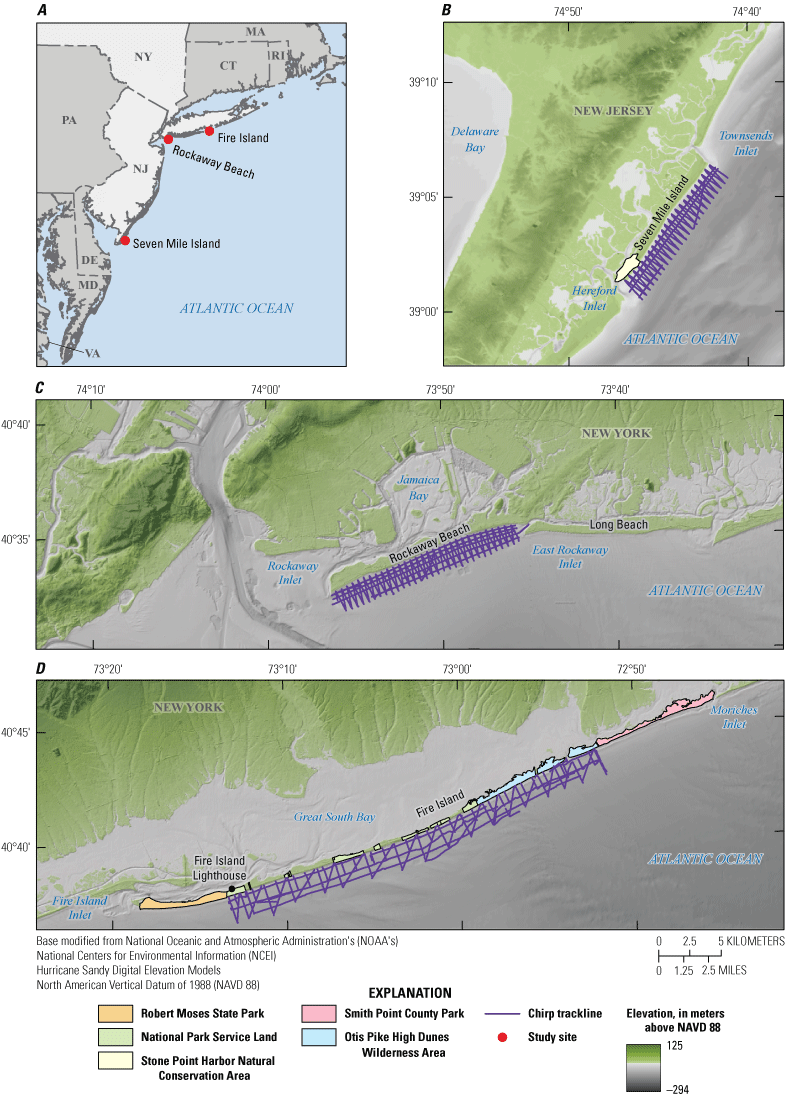
Maps showing the three survey sites discussed in this report, including chirp profile tracklines. A, Regional index map indicating locations of study sites; B, Seven Mile Island, New Jersey; C, Rockaway Beach peninsula, New York; and D, Fire Island, N.Y., study sites.
One of the metrics that NFWF will use to evaluate restoration effectiveness is the active sand volume (ASV), defined here as the volume of sediment that could contribute to beach and shoreline behavior over short (annual to decadal) time scales. Barrier islands are composed of terrestrial (above-water) and submerged (below-water) environments (fig. 2). These environments contain sediment that is available for reworking and redistribution during fair weather and stormy conditions. However, the quantities and distribution of sediment volumes in submerged environments, particularly on the shoreface (fig. 2, inset), are poorly quantified relative to terrestrial environments. Over thousands of years, shoreface sediment availability is controlled by the geologic framework and often coincides with the Holocene-Pleistocene (H-P) boundary (Riggs and others, 1995; Belknap and Kraft, 1985; Schwab and others, 2014). However, other studies have identified boundaries above the H-P boundary that indicate not all of that shoreface sediment is available over annual to decadal time scales (Miselis and McNinch, 2006; Locker and others, 2017; Wei and Miselis, 2022; fig. 2). In contrast, ASV depends not only on the geologic framework, but also on the redistribution of sediment during and after storms (Harley and others, 2022) and on the wave conditions that define the offshore boundary of sediment transport, also known as the depth of closure (DoC) (Hallermeier, 1981).
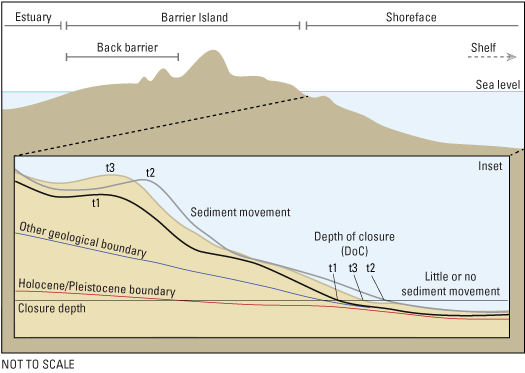
Generalized cross-shore profile illustration of the shoreface depicting seafloor fluctuations and the associated shift in locations of the depth of closure (DoC), where the depth contour intersects the fluctuating seafloor depth profile over time (t1, t2, t3). Also depicted are example geologic boundaries and the possible scenarios for what type of boundary can serve as the base boundary used to calculate the active sand volume depending on the geologic framework of the shoreface. Geologic boundary colors correspond to the boundaries shown in seismic profiles later in the report.
To quantify the ASV at the three study sites, this report uses (1) previously interpreted geologic surfaces from chirp seismic surveys that define the geometry of shoreface sand units (Locker and others, 2017; Wei and others, 2021, 2025; Wei and Miselis, 2022; table 1); (2) repeat bathymetry surveys (multibeam echo sounder [MBES] or single-beam echo sounder [SBES]) (table 1) to assess interannual changes in seafloor elevation; and (3) estimates of the DoC for each survey year at each site (table 2).
Table 1.
Data sources used at study sites in this analysis, including multibeam echo sounder (MBES), single-beam echo sounder (SBES), seismic chirp, and interpretive products.| Data type | Year | Publication |
|---|---|---|
| MBES | 2018 | Farmer and others (2019) |
| MBES | 2021 | Stalk and others (2022a) |
| Seismic chirp | 2022 | Forde and others (2023) |
| SBES chirp1 | 2022 | Lyons and others (2023) |
| MBES | 2023 | Stalk and others (2024) |
| Interpretive | 2024 | Wei and others (2025) |
| MBES | 2019 | Stalk and others (2020) |
| Seismic chirp | 2019 | Forde and others (2021) |
| SBES | 2019 | Stalk and others (2020) |
| MBES | 2021 | Stalk and others (2022b) |
| MBES | 2023 | Stalk and others (2024) |
| Interpretive | 2021 | Wei and others (2021) |
| Interpretive | 2022 | Wei and Miselis (2022) |
| SBES | 2014 | Nelson and others (2016) |
| Seismic chirp | 2014 | Forde and others (2024) |
| SBES | 2015 | Nelson and others (2017) |
| Interpretive | 2017 | Locker and others (2017) |
| Seismic chirp | 2018 | Forde and others (2019) |
| SBES | 2018 | Stalk and others (2018) |
Table 2.
Depth of closure (DoC) values and boundaries used at each study site and the U.S. Army Corps of Engineers Wave Information Study (WIS) stations used in this study (Kraus and others, 1998; Brutsché and others, 2016).[m, meter]
Setting
The study sites discussed in this report are barrier environments along the mid-Atlantic shoreline and differ in wave and tidal influences, population density, coastal engineering activities, and island extent. The southernmost study site, Seven Mile Island, N.J. (fig. 1B), is a mixed-energy barrier island centered in a littoral cell with longshore transport from north to south (Wei and others, 2025). The area is heavily populated except for Stone Harbor Point Natural Conservation Area at its southern end, which is highly dynamic, uninhabited, and is the littoral endpoint of the barrier (Nordstrom and others, 2002; Barone, 2016). The island has undergone moderate coastal engineering, including repeat beach renourishment, dune building, and emplacement of a stabilizing hard structure at the northern end of the island, adjacent to Townsends Inlet (Nordstrom and others, 2002; Barone, 2016). Seven Mile Island has the shortest alongshore extent of the three sites, with a shoreline length of 11.39 kilometers (km).
Rockaway Beach peninsula, the westernmost barrier spit in New York (fig. 1C), is a sediment-starved, wave-dominated barrier island at the end of the New York Bight littoral cell (Wei and others, 2021; Wei and Miselis, 2022). The peninsula is heavily populated and has been heavily modified with beach renourishment, jetties, groins, and a large jetty at Rockaway Inlet, the western terminus and littoral endpoint of the peninsula (USACE, 2016, 2019). On its eastern end, the peninsula is separated from the Long Beach barrier island by East Rockaway Inlet, which is adjacent to the peninsula’s mainland attachment point. The peninsula has an alongshore extent of 15.79 km.
The northeasternmost study site is Fire Island, N.Y. (fig. 1D), a wave-dominated barrier island updrift from Rockaway Beach peninsula with longshore transport from east to west. The island is centrally located within the New York Bight littoral cell. Fire Island is lightly to moderately inhabited, with communities intermittently distributed along the length of the shoreline. Unlike the other two sites, large portions of Fire Island are uninhabited and part of the Fire Island National Seashore, including the Otis Pike High Dunes Wilderness area, which spans approximately 11 km of the island. Several beach nourishment projects have occurred within the communities, but there are few emplaced groins or jetties along the island to impede longshore transport. The study area at Fire Island does not include the littoral end of the island and does not cover the length of the entire island (~50 km) between Fire Island Inlet and Moriches Inlet, but instead spans 31 km of the shoreline from east of the Fire Island Lighthouse to west of the boundary of Smith Point County Park (fig. 1D). For more comprehensive information about the wave climate, geomorphic setting, and geologic framework of these islands, consult the following publications and references included therein: Wei and others (2025) (Seven Mile Island); Wei and others (2021) and Wei and Miselis (2022) (Rockaway Beach peninsula); Leatherman (1985), Schwab and others (2000, 2013, 2014), Locker and others (2017); and Ciarletta and others (2024) (Fire Island).
Methods
Previous studies at Seven Mile Island (Wei and others, 2025), Rockaway Beach peninsula (Wei and others, 2021; Wei and Miselis, 2022), and Fire Island (Locker and others, 2017; Schwab and others, 2013, 2014) interpreted the geologic framework and identified the distribution of sandy shoreface sediments, thereby providing the geologic context for ASV. From a hydrodynamic perspective, available sediment is defined as deposits that can be mobilized in the nearshore environment by waves and currents (Stive and de Vriend, 1995); however, measuring sediment transport using in situ instruments on timescales of years to decades is difficult (Anthony and Aagaard, 2020). To account for these shorter-term changes, this report refines the estimate of ASV beyond a geologic definition by using interannual bathymetry surveys and an estimate of DoC (Hallermeier, 1981) as the upper and offshore volume boundaries, respectively. To do this, the approach used was (1) identify interpreted geologic boundaries that represent the basal boundary of sandy shoreface sediments; (2) subtract the base surface from time-varying seafloor surfaces derived from repeat seafloor high-resolution MBES or SBES surveys; (3) identify the DoC, for each seafloor survey; and (4) calculate the volume of sediment between the base geologic boundary, the seafloor, and the DoC for each time period at each study site.
Interpreted Geologic Boundaries
Depending on the distinct geology at each of the sites, the lower geologic boundary of shoreface sediment availability as interpreted in previous publications represents different features (fig. 2). At Seven Mile Island, the H-P boundary was identified below several other geologic boundaries (Wei and others, 2025) (fig. 3). The H-P boundary can be both the lower boundary of sandy sediment availability and the base of the ASV package when no spatially consistent geologic boundaries can be identified above it, as is the case with the boundary at the Rockaway Beach peninsula shown in figure 4 (Wei and Miselis, 2022). Fire Island, similar to Seven Mile Island, includes other geologic boundaries identified above the H-P boundary (Locker and others, 2017) and represent both the lower boundary of sediment availability and the ASV (fig. 5).
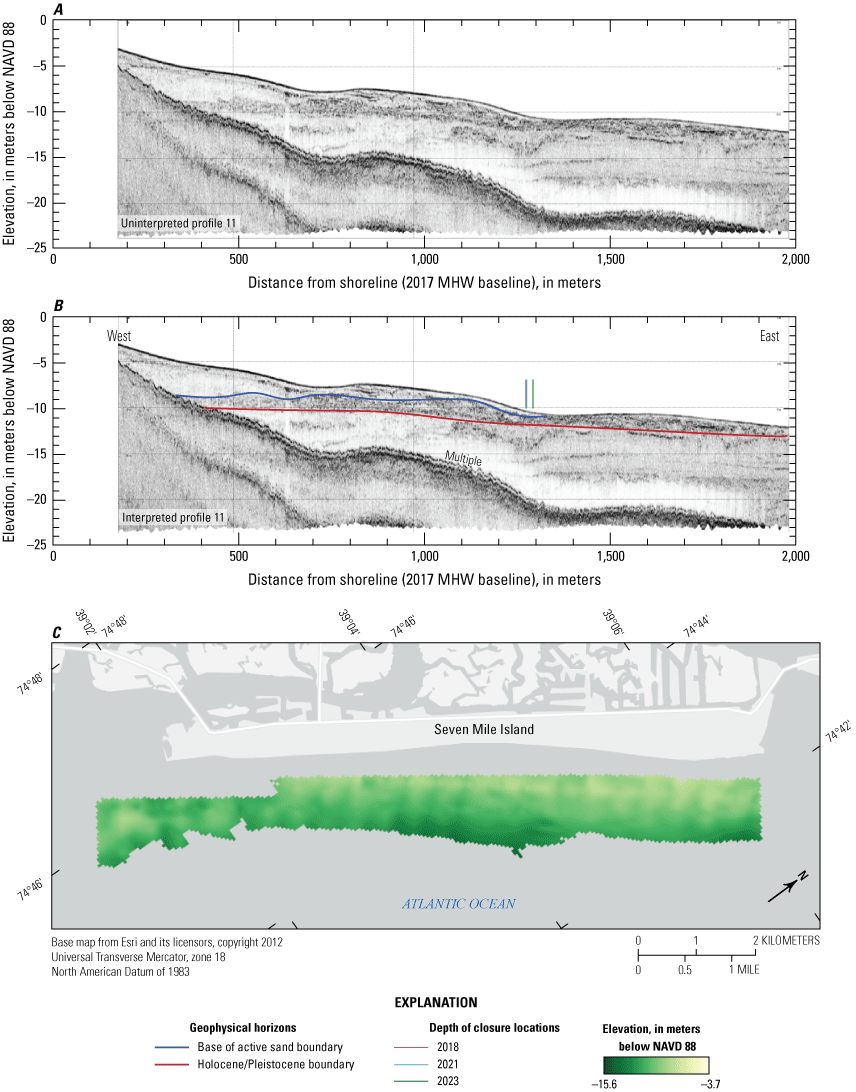
Seven Mile Island A, uninterpreted seismic chirp profile; B, interpreted profile with base of active sand boundary and depth of closure (DoC) locations shown; and C, base of active sand surface clipped to survey extent and seaward to the DoC. Dataset credit for 2022 original interpreted surface is Wei and others (2025). MHW, mean high water; NAVD 88, North American Vertical Datum of 1988.
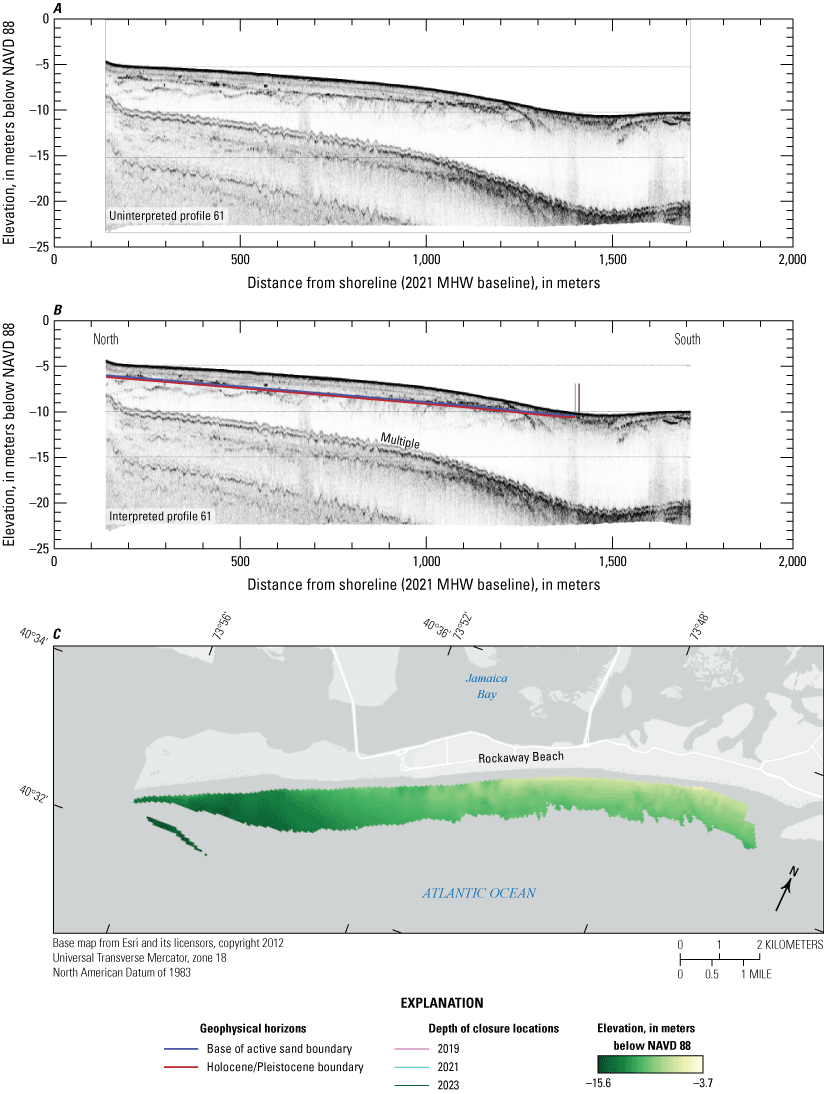
Rockaway Beach peninsula A, uninterpreted seismic chirp profile; B, interpreted profile with base of active sand boundary and depth of closure (DoC) locations labeled; and C, base of active sand surface clipped to survey extent and seaward to the DoC. Dataset credit for 2019 original interpreted surface (Wei and others, 2021; Wei and Miselis, 2022). MHW, mean high water; NAVD 88, North American Vertical Datum of 1988.
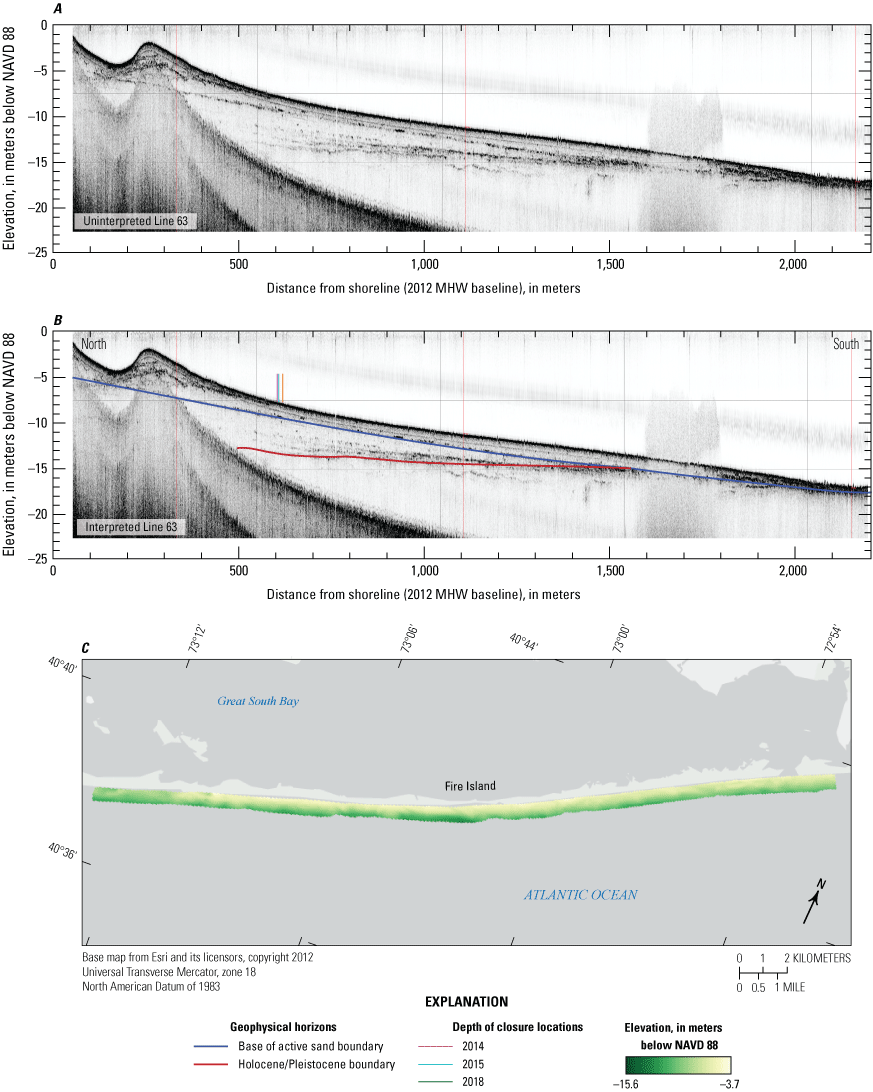
Fire Island A, uninterpreted seismic chirp profile; B, interpreted profile with base of active sand boundary and depth of closure (DoC) locations shown; and C, base of active sand surface clipped to survey extent and seaward to the DoC. Dataset credit for 2014 original interpreted surface is Locker and others (2017). MHW, mean high water; NAVD 88, North American Vertical Datum of 1988.
At Seven Mile Island, the lower ASV boundary (fig. 3) coincides with the base of unit C, which is the uppermost Holocene unit composed predominantly of sand (Wei and others, 2025). At Rockaway Beach peninsula, the basal boundary used in this study (fig. 4) corresponds to the interpreted H-P boundary (Wei and others, 2021; Wei and Miselis, 2022). At Fire Island, the basal boundary used for the ASV (fig. 5) calculations is an interpreted composite boundary (R0 and R2) that separates reworked shoreface sediments from undisturbed sediments (Locker and others, 2017). The Rockaway Beach peninsula and Seven Mile Island boundaries interpreted from chirp profile data were exported as x,y,z data points from the seismic software Kingdom version 2021 (S&P Global, 2021), and the composite boundary at Fire Island x,y,z data points were exported from Chesapeake Technology’s SonarWiz version 10.7.4 software (Chesapeake Technologies, 2024). Each dataset was transformed from the acquisition datum to the North American Datum of 1983 (NAD 83) horizontal datum and North American Vertical Datum of 1988 (NAVD 88) GEIOD 12A (Fire Island) or 12B (Seven Mile Island and Rockaway Beach peninsula) using the National Oceanic and Atmospheric Administration’s (NOAA’s) VDatum software version 4.4.2 software (National Oceanic and Atmospheric Administration, 2025). In Global Mapper (GM) version 25.0 software (Blue Marble Geographics, 2024), each geologic basal boundary x,y,z dataset was gridded at a 50-m cell size following the same methodology used to create bathymetry digital elevation models (DEMs), discussed in the next section.
Bathymetry
Between 2014 and 2023, the shoreface elevations at each of the three study sites were surveyed three times. At Seven Mile Island, MBES bathymetry data were collected in 2018, 2021, and 2023. The 2018 MBES coverage at Seven Mile Island is incomplete in the southernmost part of the survey area closest to shore because of acquisition/weather difficulties encountered during the survey. At Rockaway Beach peninsula, MBES bathymetry were collected in 2019, 2021, and 2023. In 2019, SBES data were collected simultaneously with MBES and used to fill in shallower areas. At Fire Island, only SBES bathymetry data were collected in 2014, 2015, and 2018. The timing of each survey, data acquisition and processing details, and resulting geomorphologic interpretations can be found in the data releases, reports, and manuscripts cited in table 1.
Bathymetry x,y,z data were gridded to create DEMs in GM v.25.0 using the Create Elevation Grid tool with the Triangular Irregular Network algorithm at a 1-m cell size (MBES) and 50-m cell size (SBES) and a grid “no data” buffer distance set at 2 m for MBES data and at “full loose” 1 km for SBES data (figs. 6–8). Upon saving as a georeferenced tagged image file format (GeoTIFF) file from GM, all DEMs were aligned to either a 1- or 50-m blank “snap” raster using the “layer bounds” option to maintain consistency in cell center locations between surveys. Standard deviation raster maps of the three surveys at each site were created in Esri ArcGIS Pro v.3.2.1 using the StdDev tool to show the spatial and temporal variability in seafloor elevations (fig. 9).
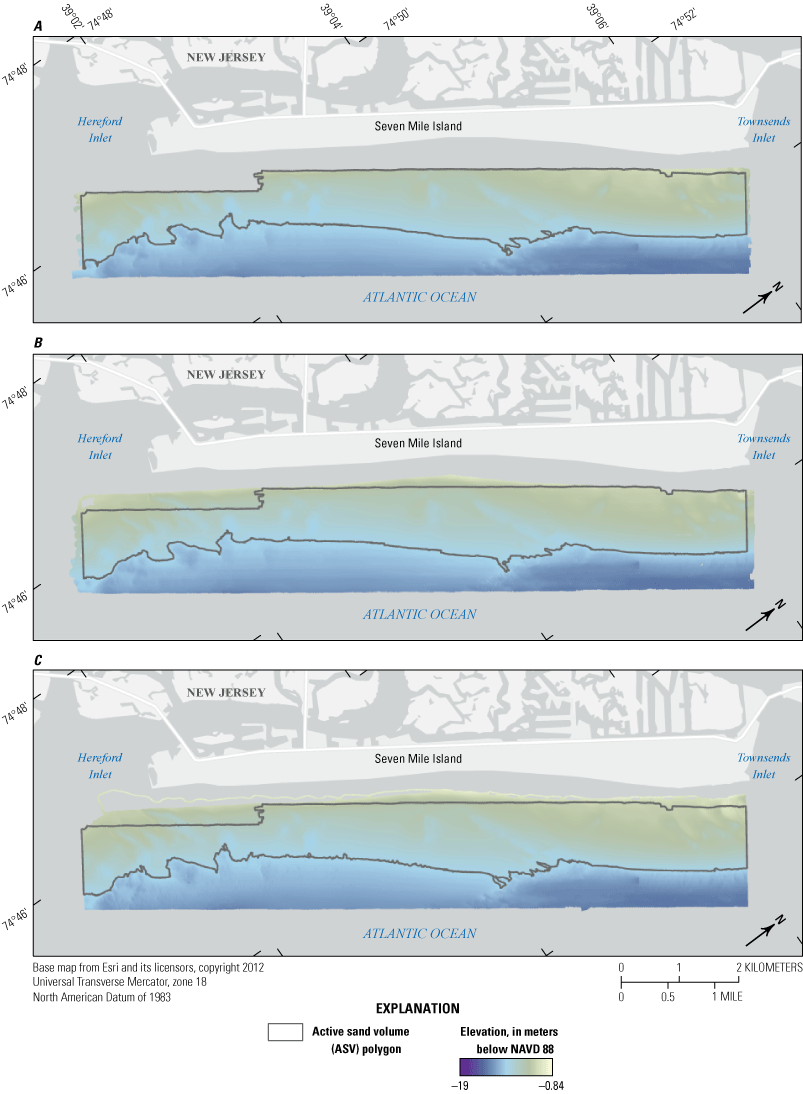
Seven Mile Island bathymetry digital elevation model (DEM) surfaces of data collected in A, 2018; B, 2021; and C, 2023 with the active sand volume (ASV) polygon bound by survey extents and seaward by the depth of closure. The elevation color ramp is the same for all three study sites (figs. 6–8) to show consistent and comparable depths. Dataset credits for 2018, 2021, and 2023 bathymetry are Farmer and others (2019) and Stalk and others (2022a, 2024), respectively. NAVD 88, North American Vertical Datum of 1988.
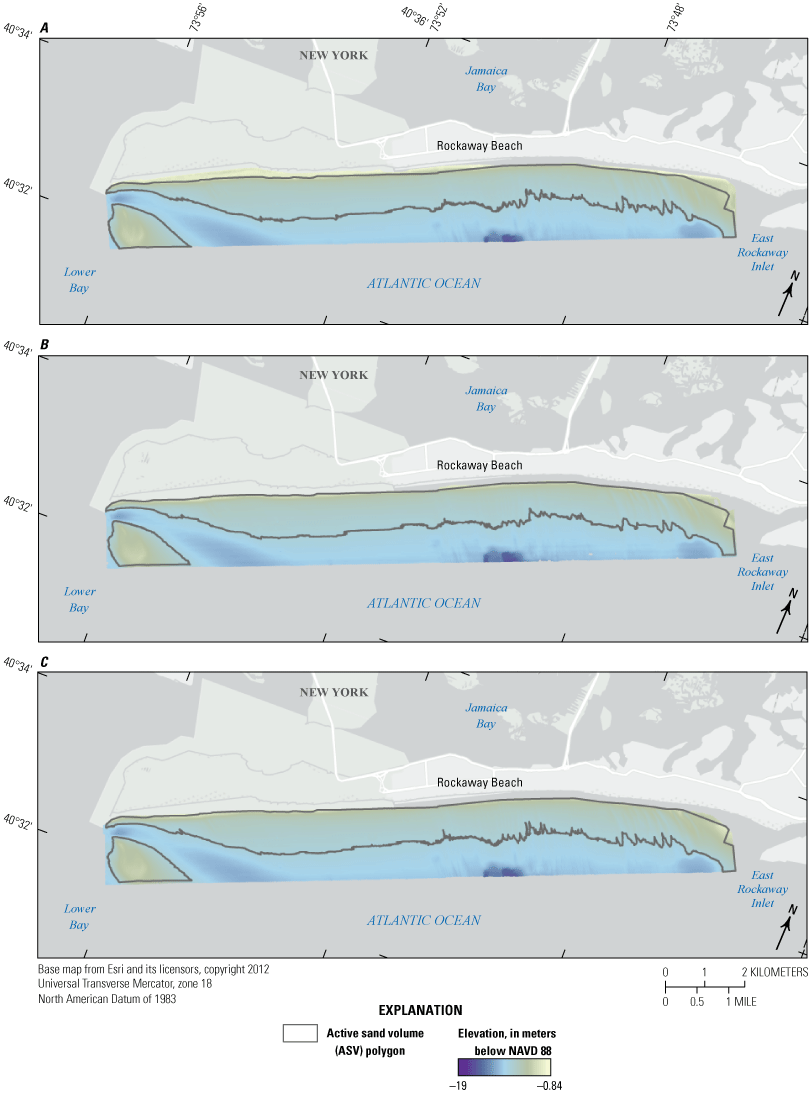
Rockaway Beach peninsula bathymetry digital elevation model (DEM) surfaces of data collected in A, 2019; B, 2021; and C, 2023 with the active sand volume (ASV) polygon bound by survey extents and seaward by the depth of closure. The elevation color ramp is the same for all three study sites (figs. 6–8) to show consistent and comparable depths. Dataset credits for 2019, 2021, and 2023 bathymetry are Stalk and others (2020, 2022b, 2024), respectively. NAVD 88, North American Vertical Datum of 1988.

Fire Island bathymetry digital elevation model (DEM) surfaces of data collected in A, 2014; B, 2015; and C, 2018 with the active sand volume (ASV) polygon bound by survey extents and seaward by the depth of closure. The elevation color ramp is the same for all three study sites (figs. 6–8) to show consistent and comparable depths. Dataset credits for 2018, 2021, and 2023 bathymetry are Nelson and others (2016, 2017) and Stalk and others (2018), respectively. NAVD 88, North American Vertical Datum of 1988.
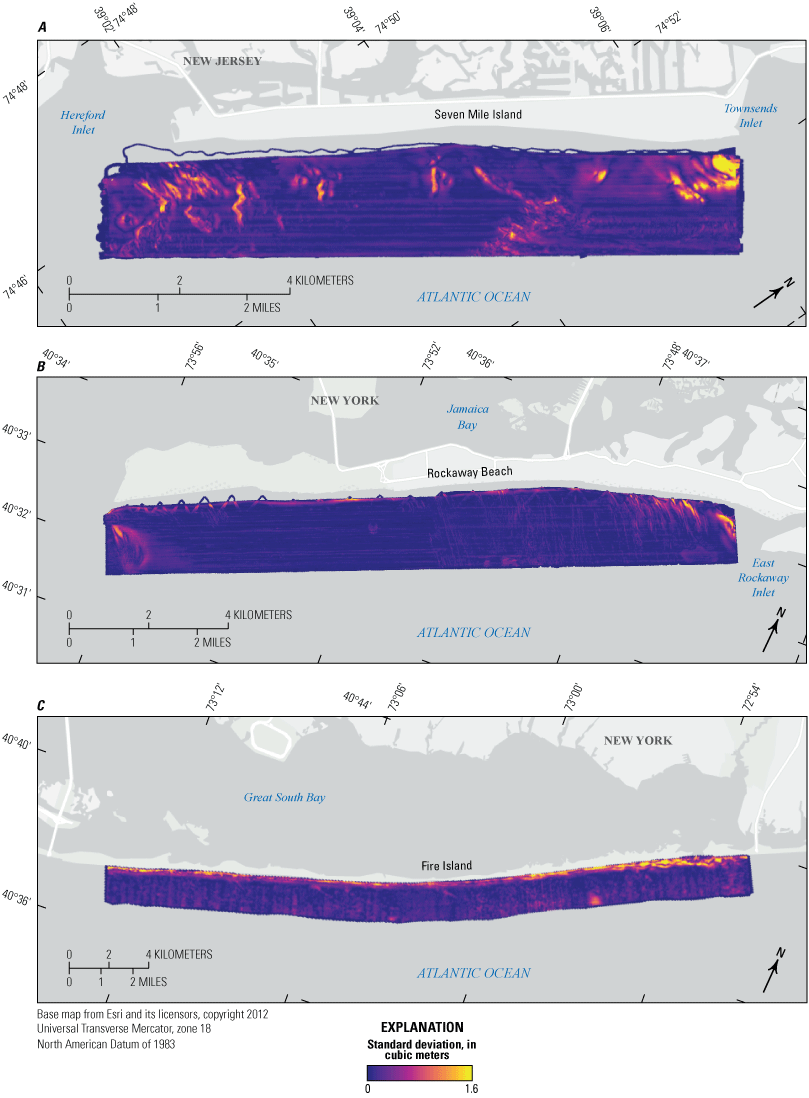
Standard deviation maps of the three bathymetry surveys showing temporal and spatial variability in sediment distribution at the A, Seven Mile Island; B, Rockaway Beach peninsula; and C, Fire Island study sites.
The USGS collected SBES data concurrently with chirp subbottom profile data at Seven Mile Island and Rockaway Beach peninsula. However, because of issues with SBES collection at the Fire Island study site during the 2014 seismic survey, bathymetry data were not collected concurrently at that location. Because the USACE and USGS seismic surveys occurred over two legs in June and July (Forde and others, 2024), higher resolution USGS SBES data only overlapped with the first leg of the chirp survey. During this time, significant migration of nearshore bars occurred that would have affected chirp stratigraphy when the profiles were adjusted to the seafloor. As a result, the chirp profile data were not adjusted to the USGS SBES bathymetry, and instead, the chirp profile data were adjusted to a DEM created from tide-corrected, digitized chirp profile seafloor x,y,z data (Locker and others, 2017). The 2014 SBES data were used in volume calculations for consistency when using the SBES from the other two surveys.
Defining the Active Sand Volume Polygon
As stated earlier, the DoC is the shoreface depth beyond which sediment transport is minimal (Hallermeier, 1978, 1981; Brutsché and others, 2016). The DoC is dependent upon several variables including sediment grain size and wave parameters such as wave height and period (Hallermeier, 1978; Brutsché and others, 2016). This study used the DoC values published by Brutsché and others (2016) based on Hallermeier (1978, 1981) with the entire record of USACE Wave Information Study wave hindcast data available (Kraus and others, 1998) (table 2). To determine the seaward extent of sediment mobility, the elevation contour corresponding to each study site’s DoC was extracted from each survey’s bathymetry DEM using ArcGIS Pro v. 3.2.1. The DoC contour was used as the offshore boundary of the ASV polygon whereas the smallest bathymetry survey extent constrains the inshore, updrift and downdrift polygon boundaries (table 2; figs. 2–8). At Rockaway Beach peninsula, the DoC contour, and therefore the ASV polygon, included parts of the large shoal across the deep channel in the southwest corner of the survey area (figs. 4 and 7).
Volume Calculations and Uncertainty
ASVs at each of the three study sites were computed within GM v.25.0 using the Measure Volume Between Two Surfaces tool. The surface of the base of the active sand boundary was compared with each of the three bathymetric DEM surfaces at each site, totaling nine volume calculations. The tool ingests the two surfaces, clips them to the appropriate ASV polygon, and calculates volume, in cubic meters, as well as the spatial area, in square meters, within which the volume change occurred.
To determine the extent to which measurement uncertainties contributed to volume changes, acquisition (Uacq) and surface (Usurface) uncertainties were quantified. Acquisition uncertainties include inherent instrument errors and Global Positioning System (GPS) excursions, and these errors are reported in each of the bathymetry survey publications listed in table 1. To determine uncertainties associated with gridding (Usurface), we use a method modified from Danielson and others (2016) in which we withhold a percentage of the point data used in the gridded surface to determine the surface uncertainty. Usurface was calculated by using the Esri ArcGIS Pro Subset Features tool, which randomly removes a percentage of the data points (Pi in equation 1) from each bathymetric x,y,z or chirp boundary x,y,z dataset and creates a shapefile (.shp). A subset value of 10 percent was selected. A separate shapefile was created with the remaining 90 percent of the points and was imported into GM for gridding following the same methodology and parameters in GM as described in the bathymetry section for creating surfaces. The surface was then imported back into Esri ArcGIS Pro where the Extract Values to Points tool was used to extract points from the locations at which the random points had been removed (Oi in equation 1). These points were used to calculate the Root Mean Square Error (RMSE) (Usurface) using the following equation:
wherePi
are the predicted or known values of subset data points,
Oi
are the points extracted from the surface, and
n
is the total number of subset points.
For a given surface (for example, bathymetry DEM or geologic surface), survey uncertainty (SUsurface) was calculated by using equations modified from Maloney and others (2018), where the total uncertainty of the acquisition (Uacq) and surface errors (Usurface) was found by using the following equation:
and the normalized survey uncertainty (NSUsurface) as a fraction of the depth range that is accounted for by uncertainty: whereThe variable values and results of calculations shown in equations 1–3 are provided in table 3.
Table 3.
Error variables, survey uncertainties, and normalized survey and uncertainties for individual surfaces.[Elevations are are in meters (m) relative to the North American Vertical Datum of 1988. MBES, multibeam echo sounder; SBES, single-beam echo sounder]
Additionally, we calculate the uncertainty associated with our volume calculations (when two surfaces are differenced) as the square root of the sum of squares of those two surfaces:
The NSUvolume value is the volumetric uncertainty that, when multiplied by 100, provides the percentage of the calculated volume that can be attributed to uncertainty (table 4).
Table 4.
Volumetric uncertainties of bathymetry and surface pairs.[NSU, normalized surface uncertainty; MBES, multibeam echo sounder; SBES, single-beam echo sounder, %, percent]
For each surface pair at each site, the portion of total active sand volume (TASV) accounted for by uncertainty is shown in table 5 and is calculated as volume uncertainty (VU):
Table 5.
Summary of active sand volumes, associated uncertainties, and volume change uncertainty exceedance values.[m3, cubic meter; m2, square meter; NSU, normalized surface uncertainty; NA, not applicable; %, percent; ±, plus-minus]
Finally, to determine if measured volume changes exceed VU, the absolute value of the TASV change between surveys was divided by the average volume uncertainty of the surveys being compared (table 5):
Results
Seafloor elevations and associated DoC contours fluctuate spatially over time. While these variables and boundaries are constantly changing because of nearshore processes, the geologic interpreted base boundaries at each site are assumed to remain at a constant depth over years to decades, and this is supported by our finding that seafloor variability (fig. 9) does not exceed sediment thicknesses (figs. 3–5). Using a lower boundary from interpreted stratigraphy instead of extending the DoC depth boundary landward ensures that the ASVs account for geologic processes (Miselis and McNinch, 2006).
The volume change uncertainty exceedance (VCUE) indicates how effectively the methods capture true volume changes rather than noise associated with acquisition and gridding errors (table 5). For example, if the average volume uncertainty between years is less than measured volume change over that same time period (VCUE > 1), then volume changes can be resolved. On the other hand, if the average volume uncertainty between years is greater than measured volume change (VCUE < 1), then volume changes cannot be resolved. The higher the VCUE value is above one, the more likely volume changes are real and not artifacts associated with data acquisition and processing. Comparisons for the time periods at each site show that volume changes can confidently be resolved with our methodologies. One exception is at Rockaway Beach peninsula between 2021 and 2023, when changes in volume were below uncertainty thresholds. The alongshore extents and, therefore, the two-dimensional spatial areas among the three sites differ. The areas of the ASV polygons that were used to calculate volume change are shown in table 5. The difference in analysis area among the sites is substantial, especially when comparing Seven Mile Island and Rockaway Beach peninsula to the portion of Fire Island examined in this study. Normalizing the total volumes by the change areas shows that both Seven Mile Island and Rockaway Beach Peninsula have approximately 1.5 times the sediment per square meter compared to Fire Island (table 5).
The standard deviation in TASV reflects both changes in seafloor bathymetry and the cross-shore shift in the DoC contours through time (fig. 9 and table 5). Standard deviation in TASV at Fire Island exceeds those of Seven Mile Island and Rockaway Beach peninsula by approximately 4.5 × 10⁶ m3. This variability in total volume may indicate a more dynamic environment at Fire Island relative to the other two sites.
Summary
The active sand volumes (ASVs) in this report are defined as the amount of sediment within the shoreface that may be easily mobilized over time scales of years to decades. The calculated ASVs may represent only a portion of the geologically defined shoreface sediment described in previous publications. The ASV extents were determined from previously interpreted stratigraphic boundaries, seafloor elevations, and the depth of closure at each site. By incorporating the seaward depth of closure boundary, we arrive at a metric that accounts for shoreface geology and the hydrodynamics that mobilize shoreface sediment.
The volumetric uncertainty analysis as seen with exceedance values indicates that the volume changes observed at Seven Mile Island, Rockaway Beach peninsula, and Fire Island are real and not caused by acquisition, processing, or gridding errors. Although the total active sand volumes among the sites appear similar, by accounting for the differing extents of survey area, Seven Mile Island and Rockaway Beach peninsula have similar ASVs that are about 1.5 times greater than the ASV within the study extent at Fire Island. This is the first assessment of ASV for our study sites, and it is expected that this report will help to inform potential future work refining estimates of ASVs for different time scales using different boundaries.
References Cited
Anthony, E.J., and Aagaard, T., 2020, The lower shoreface—Morphodynamics and sediment connectivity with the upper shoreface and beach: Earth-Science Reviews, v. 210, article 103334, accessed March 7, 2025, at https://doi.org/10.1016/j.earscirev.2020.103334.
Blue Marble Geographics, 2024, Global Mapper, version 25.0: Blue Marble Geographics web page accessed February 5, 2025, at https://www.bluemarblegeo.com/global-mapper-pro/.
Brutsché, K.E., Rosati, J., III, Pollock, C.E., and McFall, B.C., 2016, Calculating depth of closure using WIS hindcast data: Vicksburg, Miss., U.S. Army Corps of Engineers, ERDC/CHL CHETN–VI–45, 9 p., accessed March 25, 2024, at https://apps.dtic.mil/sti/citations/AD1006484.
Ciarletta, D.J., Miselis, J.L., Bernier, J.C., and Forde, A.S., 2024, Implications for the resilience of modern coastal systems derived from mesoscale barrier dynamics at Fire Island, New York: Earth Surface Dynamics, v. 12, no. 2, p. 449–475. [Also available at https://doi.org/10.5194/esurf-12-449-2024.]
Chesapeake Technologies, 2024, Sonar Wiz, version 10.7.4: Chesapeake Technologies web page accessed June 5, 2024, at https://chesapeaketech.com/products/sonarwiz-sub-bottom/.
Danielson, J.J., Poppenga, S.K., Brock, J.C., Evans, G.A., Tyler, D.J., Gesch, D.B., Thatcher, C.A., and Barras, J.A., 2016, Topobathymetric elevation model development using a new methodology—Coastal national elevation database: Journal of Coastal Research, v. 76, p. 75–89, accessed March 7, 2025, at https://doi.org/10.2112/SI76-008.
Farmer, A.S., Fredericks, J.J., Reynolds, B.J., and Miselis, J., 2019, Coastal multibeam bathymetry data collected in 2018 offshore of Seven Mile Island, New Jersey: U.S. Geological Survey data release, https://doi.org/10.5066/P9BSJHVL.
Forde, A.S., DeWitt, N.T., Fredericks, J.J., and Miselis, J.L., 2019, Archive of chirp subbottom profile data collected in June 2018 from Fire Island, New York: U.S. Geological Survey data release, https://doi.org/10.5066/P9Q8TVHH.
Forde, A.S., DeWitt, N.T., Wei, E.A., and Miselis, J.L., 2023, Archive of chirp subbottom profile data collected in 2022 from Seven Mile Island, New Jersey: U.S. Geological Survey data release, https://doi.org/10.5066/P9PY4RR0.
Forde, A.S., Miselis, J.L., and Buster, N.A., 2024, Archive of chirp sub-bottom profile geophysical data collected in 2014 from Fire Island, New York: U.S. Geological Survey data release, https://doi.org/10.5066/P13TMXXY.
Forde, A.S., Wei, E.A., DeWitt, N.T., and Miselis, J.L., 2021, Archive of chirp subbottom profile data collected in 2019 from Rockaway Peninsula, New York: U.S. Geological Survey data release, https://doi.org/10.5066/P9ZO8QKJ.
Kinsela, M.A., Hanslow, D.J., Carvalho, R.C., Linklater, M., Ingleton, T.C., Morris, B.D., Allen, K.M., Sutherland, M.D., and Woodroffe, C.D., 2020, Mapping the shoreface of coastal sediment compartments to improve shoreline change forecasts in New South Wales, Australia: Estuaries and Coasts, v. 45, no. 4, p. 1143–1169, accessed March 7, 2025, at https://doi.org/10.1007/s12237-020-00756-7.
Locker, S.D., Miselis, J.L., Buster, N.A., Hapke, C.J., Wadman, H.M., McNinch, J.E., Forde, A.S., and Stalk, C.A., 2017, Nearshore sediment thickness, Fire Island, New York: U.S. Geological Survey Open-File Report 2017–1024, 21 p., accessed October 26, 2023, at https://doi.org/10.3133/ofr20171024.
Lyons, E.O., DeWitt, N.T., Stalk, C.A., Reynolds, B.J., Farmer, A.S., Bernier, J.C., Galbraith, B.A., Wei, E.A., and Miselis, J.L., 2023, Coastal single-beam bathymetry data collected in 2022 off Seven Mile Island, New Jersey: U.S. Geological Survey data release, https://doi.org/10.5066/P9P07T3W.
Maloney, J.M., Bentley, S.J., Xu, K., Obelcz, J., Georgiou, I.Y., and Miner, M.D., 2018, Mississippi River subaqueous delta is entering a stage of retrogradation: Marine Geology, v. 400, p. 12–23, accessed March 7, 2025, at https://doi.org/10.1016/j.margeo.2018.03.001.
Miselis, J.L., and McNinch, J.E., 2006, Calculating shoreline erosion potential using nearshore stratigraphy and sediment volume—Outer Banks, North Carolina: Journal of Geophysical Research, v. 111, 15 p., accessed June 20, 2022, at https://doi.org/10.1029/2005JF000389.
National Oceanic and Atmospheric Administration, 2025, Vertical datum transformation---Interpreting America's elevation data: National Oceanic and Atmospheric Administration website, accessed February 15, 2024, at https://vdatum.noaa.gov/welcome.html.
Nelson, T.R., Miselis, J.L., Hapke, C.J., Brenner, O.T., Henderson, R.E., Reynolds, B.J., and Wilson, K.E., 2017, Coastal bathymetry data collected in May 2015 from Fire Island, New York—Wilderness breach and shoreface: U.S. Geological Survey Data Series 1049, accessed January 13, 2024, at https://doi.org/10.3133/ds1049.
Nelson, T.R., Miselis, J.L., Hapke, C.J., Wilson, K.E., Henderson, R.E., Brenner, O.T., Reynolds, B.J., and Hansen, M.E., 2016, Coastal bathymetry data collected in June 2014 from Fire Island, New York—The wilderness breach and shoreface: U.S. Geological Survey Data Series 1007, accessed January 13, 2024, at https://doi.org/10.3133/ds1007.
Riggs, S.R., Cleary, W.J., and Snyder, S.W., 1995, Influence of inherited geologic framework on barrier shoreface morphology and dynamics: Marine Geology, v. 126, nos. 1–4, p. 213–234, accessed March 7, 2025, at https://doi.org/10.1016/0025-3227(95)00079-E.
Schwab, W.C., Baldwin, W.E., Denny, J.F., Hapke, C.J., Gayes, P.T., List, J.H., and Warner, J.C., 2014, Modification of the Quaternary stratigraphic framework of the inner-continental shelf by Holocene marine transgression—An example offshore of Fire Island, New York: Marine Geology, v. 355, p. 346–360, accessed October 11, 2019, at https://doi.org/10.1016/j.margeo.2014.06.011.
Schwab, W.C., Baldwin, W.E., Hapke, C.J., Lentz, E.E., Gayes, P.T., Denny, J.F., List, J.H., and Warner, J.C., 2013, Geologic evidence for onshore sediment transport from the inner continental shelf—Fire Island, New York: Journal of Coastal Research, v. 29, no. 3, p. 526–544, accessed September 23, 2019, at https://doi.org/10.2112/JCOASTRES-D-12-00160.1.
Schwab, W.C., Thieler, E.R., Allen, J.R., Foster, D.S., Swift, B.A., and Denny, J.F., 2000, Influence of inner-continental shelf geologic framework on the evolution and behavior of the barrier-island system between Fire Island Inlet and Shinnecock Inlet, Long Island, New York: Journal of Coastal Research, v. 16, no. 2, p. 408–422.
S&P Global, 2021, Kingdom, version 2021: S&P Global web page accessed April 16, 2025, at https://www.spglobal.com/commodity-insights/en/products-solutions/upstream-midstream-oil-gas/geoscience-software.
Stalk, C.A., DeWitt, N.T., Levinson, S.C., and Miselis, J.G., 2024, Coastal multibeam bathymetry and backscatter data collected in May 2023 from Seven Mile Island, New Jersey: U.S. Geological Survey data release, https://doi.org/10.5066/P13TUAJH.
Stalk, C.A., DeWitt, N.T., Wei, E.A., Farmer, A.S., Miselis, J.L., and Fredericks, J.J., 2020, Coastal bathymetry and backscatter data collected in September and October 2019 from Rockaway Peninsula, New York: U.S. Geological Survey data release, https://doi.org/10.5066/P9WNJSFN.
Stalk, C.A., Farmer, A.S., Wei, E.A., and Miselis, J.L., 2022a, Coastal multibeam bathymetry and backscatter data collected in May 2021 from Seven Mile Island, New Jersey: U.S. Geological Survey data release, https://doi.org/10.5066/P9M2EQIR.
Stalk, C.A., Miselis, J.L., Nelson, T.R., Reynolds, B.J., Fredericks, J.J., DeWitt, N.T., Farmer, A.S., Wilcox, H.S., and Lemon, M.K., 2018, Coastal bathymetry data collected in June 2018 from Fire Island, New York—Wilderness breach and shoreface: U.S. Geological Survey data release, https://doi.org/10.5066/F7PC30N8.
Stalk, C.A., Reynolds, B.J., Wei, E.A., and Miselis, J.L., 2022b, Coastal bathymetry and backscatter data collected in June 2021 from Rockaway Peninsula, New York: U.S. Geological Survey data release, https://doi.org/10.5066/P9HNK9CJ.
U.S. Army Corps of Engineers [USACE], 2016, Atlantic Coast of New York, East Rockaway Inlet to Rockaway Inlet and Jamaica Bay—Draft integrated Hurricane Sandy general reevaluation report and environmental impact statement: U.S. Army Corps of Engineers, New York District, 270 p., accessed March 25, 2024, at https://www.nan.usace.army.mil/Portals/37/docs/civilworks/projects/ny/coast/Rockaway/RockFeasStudy/1_Rockaway%20Draft%20Integrated%20HSGRR%20and%20EIS .pdf%3Fver%3D2016-08-19-094124-930.
U.S. Army Corps of Engineers [USACE], 2019, Final report—Integrated Hurricane Sandy general reevaluation report and environmental impact statement, Atlantic Coast of New York, East Rockaway Inlet to Rockaway Inlet and Jamaica Bay: U.S. Army Corps of Engineers, New York District, 285 p., accessed March 25, 2024, at https://www.nan.usace.army.mil/Portals/37/docs/civilworks/projects/ny/coast/Rockaway/2020%20Update%20Report/Rock%20Jam%20Bay%20Final%20Report.pdf?ver= 2020-06-01-154654-773.
Wei, E., and Miselis, J., 2022, Geologic framework, anthropogenic impacts, and hydrodynamics contribute to variable sediment availability and shoreface morphology at the Rockaway Peninsula, NY: Journal of Marine Science and Engineering, v. 10, no. 7, article 989, https://doi.org/10.3390/jmse10070989.
Wei, E.A., Miselis, J.L., Buster, N.A., and Forde, A.S., 2025, Geologic framework and Holocene sand thickness offshore of Seven Mile Island, New Jersey: U.S. Geological Survey Scientific Investigation Report 2024–5131, 19 p., accessed March 14, 2025, at https://doi.org/10.3133/sir20245131.
Wei, E.A., Miselis, J.L., and Forde, A.S., 2021, Shoreface and Holocene sediment thickness offshore of Rockaway Peninsula, New York: U.S. Geological Survey Open-File Report 2021–1100, 14 p., accessed November 12, 2023, at https://doi.org/10.3133/ofr20211100.
Conversion Factors
U.S. customary units to International System of Units
Datum
Vertical coordinate information is referenced to the North American Vertical Datum of 1988 (NAVD 88) geoid 12A and B (same other than for Puerto Rico).
Horizontal coordinate information is referenced to the North American Datum of 1983 (NAD 83).
Elevation, as used in this report, refers to distance relative to the vertical datum.
Abbreviations
ASV
active sand volume
DEM
digital elevation model
DoC
depth of closure
GeoTIFF
georeferenced tagged image file format
GM
Global Mapper
GPS
Global Positioning System
H-P
Holocene-Pleistocene
MBES
multibeam echo sounder
NFWF
National Fish and Wildlife Foundation
NOAA
National Oceanic and Atmospheric Administration
SBES
single-beam echo sounder
TASV
total active sand volume
TIN
Triangular Irregular Network
USACE
U.S. Army Corps of Engineers
USGS
U.S. Geological Survey
VCUE
volume change uncertainty exceedance
For more information about this publication, contact
Director, St. Petersburg Coastal and Marine Science Center
U.S. Geological Survey
600 4th Street South
St. Petersburg, FL 33701
For additional information, visit
https://www.usgs.gov/centers/spcmsc
Publishing support provided by
Lafayette Publishing Service Center
Disclaimers
Any use of trade, firm, or product names is for descriptive purposes only and does not imply endorsement by the U.S. Government.
Although this information product, for the most part, is in the public domain, it also may contain copyrighted materials as noted in the text. Permission to reproduce copyrighted items must be secured from the copyright owner.
Suggested Citation
Buster, N.A., Miselis, J.L., Wei, E.A., and Forde, A.S., 2025, Assessment of active sand volumes at Rockaway Beach and Fire Island in New York and Seven Mile Island in New Jersey: U.S. Geological Survey Data Report 1211, 19 p., https://doi.org/10.3133/dr1211.
ISSN: 2771-9448 (online)
Study Area
| Publication type | Report |
|---|---|
| Publication Subtype | USGS Numbered Series |
| Title | Assessment of active sand volumes at Rockaway Beach and Fire Island in New York and Seven Mile Island in New Jersey |
| Series title | Data Report |
| Series number | 1211 |
| DOI | 10.3133/dr1211 |
| Publication Date | May 22, 2025 |
| Year Published | 2025 |
| Language | English |
| Publisher | U.S. Geological Survey |
| Publisher location | Reston, VA |
| Contributing office(s) | St. Petersburg Coastal and Marine Science Center |
| Description | Report: vii, 19 p.; 11 Data Releases |
| Country | United States |
| State | New York, New Jersey |
| Other Geospatial | Fire Island, Rockaway Beach, Seven Mile Island |
| Online Only (Y/N) | Y |