

Selected Water-Quality Data from the Cedar River and Cedar Rapids Well Fields, Cedar Rapids, Iowa, 2017–22
Links
- Document: Report (2.4 MB pdf) , HTML , XML
- Dataset: USGS National Water Information System database - USGS water data for the Nation
- NGMDB Index Page: National Geologic Map Database Index Page (html)
- Download citation as: RIS | Dublin Core
Acknowledgments
The authors would like to acknowledge the City of Cedar Rapids Utilities Water Division who provided funding for this long-term project.
Water-quality samples were collected and analyzed by personnel from the U.S. Geological Survey. Initial versions of this report were substantially improved by suggestions from Kendra Markland and Molly Schreiner of the U.S. Geological Survey.
Abstract
The Cedar River alluvial aquifer is the source of drinking water in Cedar Rapids, Iowa. Production wells are completed in the alluvial aquifer approximately 40 to 80 feet below land surface. The City of Cedar Rapids and the U.S. Geological Survey have studied the groundwater-flow system and water quality of the aquifer in the vicinity of Cedar Rapids since 1992. Results of these studies documented hydrologic conditions, water quality, and geochemistry of the alluvial aquifer and interactions with the Cedar River. Water-quality samples were collected for studies involving well field monitoring, trends, source-water protection, groundwater geochemistry, surface-water–groundwater interaction, and pesticides in groundwater and surface water. Water quality was analyzed for dissolved major ions (boron, bromide, calcium, chloride, fluoride, iron, magnesium, manganese, potassium, silica, sodium, sulfate, and total dissolved solids), dissolved nutrients (ammonia as nitrogen, ammonia plus organic nitrogen as nitrogen, nitrite plus nitrate as nitrogen, nitrite as nitrogen, orthophosphate as phosphorus, and phosphorus), dissolved organic carbon, and selected pesticides. Physical characteristics (alkalinity, dissolved oxygen, pH, specific conductance, and water temperature) were measured on site and recorded for each water sample collected. This report presents the results of routine water-quality data-collection activities from October 2017 through September 2022. Methods of data collection, quality assurance, water-quality analyses, and statistical procedures are presented. Data include the results of water-quality analyses from quarterly sampling from monitoring wells, production wells, two water treatment plants, and the Cedar River at Blairs Ferry Road at Palo, Iowa, streamgage (U.S. Geological Survey station number 05464420), as well as monthly nutrient sampling from the Cedar River and Morgan Creek near Covington, Iowa, streamgage (U.S. Geological Survey station number 05464475).
Introduction
The City of Cedar Rapids, in Linn County, Iowa, obtains its drinking water supply from a shallow alluvial aquifer adjacent to the Cedar River. Forty-five vertical wells and six horizontal collector wells (HCW) are completed at about 40 to 80 feet (ft) below land surface. Vertical wells gradually are being replaced by higher-yielding HCWs, but many of the vertical wells are used regularly or are in standby operation. Adequate quantities of generally high-quality water have been obtained from the alluvial aquifer since the resource was developed in 1962.
Population growth and industrial development have increased the demand for water; Cedar Rapids pumped an average of 39.3 million gallons per day (Mgal/d) from the alluvial aquifer in 2018, 38.0 Mgal/d in 2019, 36.7 Mgal/d in 2020, 40.0 Mgal/d in 2021, and 38.7 Mgal/d in 2022. A record high daily demand of 53.73 Mgal/d was recorded on June 16, 2021 (C. Knapp, City of Cedar Rapids Water Department, written commun., June 2023). To document the quantity and quality of water available from the Cedar River and the alluvial aquifer, the City of Cedar Rapids and the U.S. Geological Survey (USGS) carried out a multidiscipline study of the Cedar River alluvial aquifer flow system and its interaction with the underlying Silurian-Devonian aquifer and adjacent Cedar River in the vicinity of the Cedar Rapids well fields since 1992. Additionally, the cooperative study was intended to document the physical extent of the aquifer, model flow into the aquifer from the adjacent Cedar River and underlying bedrock aquifers, and document how use of water from the aquifer affects the quality of water in the aquifer.
Previous Investigations
Results from the long-term multidiscipline cooperative study between the City of Cedar Rapids Water Department and the USGS have been published in data and interpretative reports. Water-quality data collected as part of this study were previously summarized at 5-year intervals in data reports by Schulmeyer and others (1995), Schnoebelen and Schulmeyer (1996), Boyd and others (1999), Littin and Schnoebelen (2010), Littin (2012), and Meppelink and others (2019).
Data collected during this study were used to understand the hydrology and water-quality characteristics of the alluvial aquifer and the interaction of aquifer water with the Cedar River. Schulmeyer (1995) analyzed the effect of the Cedar River on the quality of groundwater near the well fields. Schnoebelen and Schulmeyer (1996) documented hydrogeologic data collected and compiled from October 1992 to March 1996. Schulmeyer and Schnoebelen (1998) described the hydrogeology near the well fields, documented a groundwater-flow model constructed to simulate regional groundwater flow under steady-state conditions, identified sources of water to the well fields, and assessed temporal and spatial variations of selected water-quality constituents and properties. Boyd (1998) characterized groundwater flow near the well fields using selected environmental isotopes and tracers. Boyd (2000) evaluated the occurrence and distribution of concentrations of selected pesticides in the alluvial aquifer and Cedar River following springtime application of these pesticides to upstream cropland areas.
Kalkhoff (2018) documented spatial and temporal differences in nitrogen and phosphorus transport from the Cedar River Basin during 2000 to 2015 that can assist in documenting progress of efforts by the City of Cedar Rapids in the Middle Cedar Partnership Project, the Iowa Department of Natural Resources Watershed Management Authority in the upper and middle Cedar River, and the University of Iowa Watershed Approach in the middle Cedar River Basin to reduce downstream flooding and improve water quality. Garrett (2021) developed and documented a model based on real-time turbidity measurements that provided information to evaluate progress of nutrient reduction efforts in the Cedar River Basin. Most recently, Kalkhoff (2021) summarized the effect of pumping on spatial and temporal hydrologic and water-quality variability of the Cedar River alluvial aquifer in Linn County, Iowa, from 1990 to 2019.
During water years 2018 through 2022, geophysical data (Deszcz-Pan and others, 2018; Johnson and others, 2020) were collected to refine the lithology and extent of the aquifer (Valder and others, 2018), and an updated groundwater-flow model to simulate effects of drought on water availability was developed (Haj and others, 2021).
Purpose and Scope
This report presents the results of water-quality data-collection activities in water years 2018 through 2022 (October 2017 through September 2022) for a multidiscipline study of the Cedar River alluvial aquifer completed by the USGS, in cooperation with the City of Cedar Rapids Utilities Water Division. Selected water-quality constituents were monitored continuously in the Cedar River and Morgan Creek, and water levels were monitored continuously in selected wells during the 2018–22 period (USGS, 2023a). Only water-quality data from periodic samples are summarized in this report; all data are publicly available in the USGS Water Data for the Nation database (USGS, 2023a). Data presented in this report include results of water-quality analyses and physical characteristics of surface water flowing into Cedar Rapids from the Cedar River and Morgan Creek. Water quality within the Cedar River alluvial aquifer was determined by periodically sampling two monitoring wells, seven production wells in the Cedar Rapids well fields, and raw water entering the two drinking water treatment plants. Samples were analyzed for selected physical characteristics at the time of collection, constituents that included nitrate as nitrogen, selected pesticides of interest for drinking water supply, and major ions to document the basic water chemistry in the surface and groundwater in the study area.
Description of the Study Area
Cedar Rapids is within Linn County in east-central Iowa. Water for the City of Cedar Rapids is supplied from three well fields (Seminole, East, and West) along the Cedar River (fig. 1). The City of Cedar Rapids had a population of about 137,700 in 2020 (U.S. Census Bureau, 2023). The Cedar River flows from the northwest to the southeast in the study area (fig. 1) and drains 6,342 square miles upstream from the Cedar River at Blairs Ferry Road at Palo, Iowa, streamgage (USGS station number 05464420; hereafter referred to as “CRPalo streamgage”; fig. 1). Morgan Creek flows from the southwest to northeast in the study area and drains 16.7 square miles in Linn and Benton Counties upstream from the Morgan Creek near Covington, Iowa, streamgage (USGS station number 05464475; hereafter referred to as “MorgCr streamgage”). Morgan Creek flows into the Cedar River upstream from the Seminole well field (fig. 1). Upstream land use in the Cedar River and Morgan Creek Basins is greater than 90 percent agriculture, which is dominated by corn and soybean production (Iowa Department of Natural Resources, 2006). Livestock raised in Cedar River and Morgan Creek Basins upstream from the study area include cattle and hogs. Annual precipitation in the Cedar Rapids, Iowa, area was as follows: 26.09 in. (2017), 40.65 in. (2018), about 37.5 in. (2019), 31.55 in. (2020), 23.69 in. (2021), and 28.36 in. in 2022 (National Oceanic and Atmospheric Administration, 2025).
Extreme daily mean flows recorded at the CRPalo streamgage during this reporting period were a maximum of 61,700 cubic feet per second (ft3/s) on March 18, 2019, and minimum of 525 ft3/s on December 26, 2017 (U.S. Geological Survey, 2023a). These extreme flows compare to the long-term (1903–2022) maximum daily mean flow of 138,000 ft3/s on June 13, 2008, and minimum of 140 ft3/s on November 18, 1989, at the downstream streamgage at Cedar Rapids (USGS station number 05464500) (U.S. Geological Survey, 2023a).
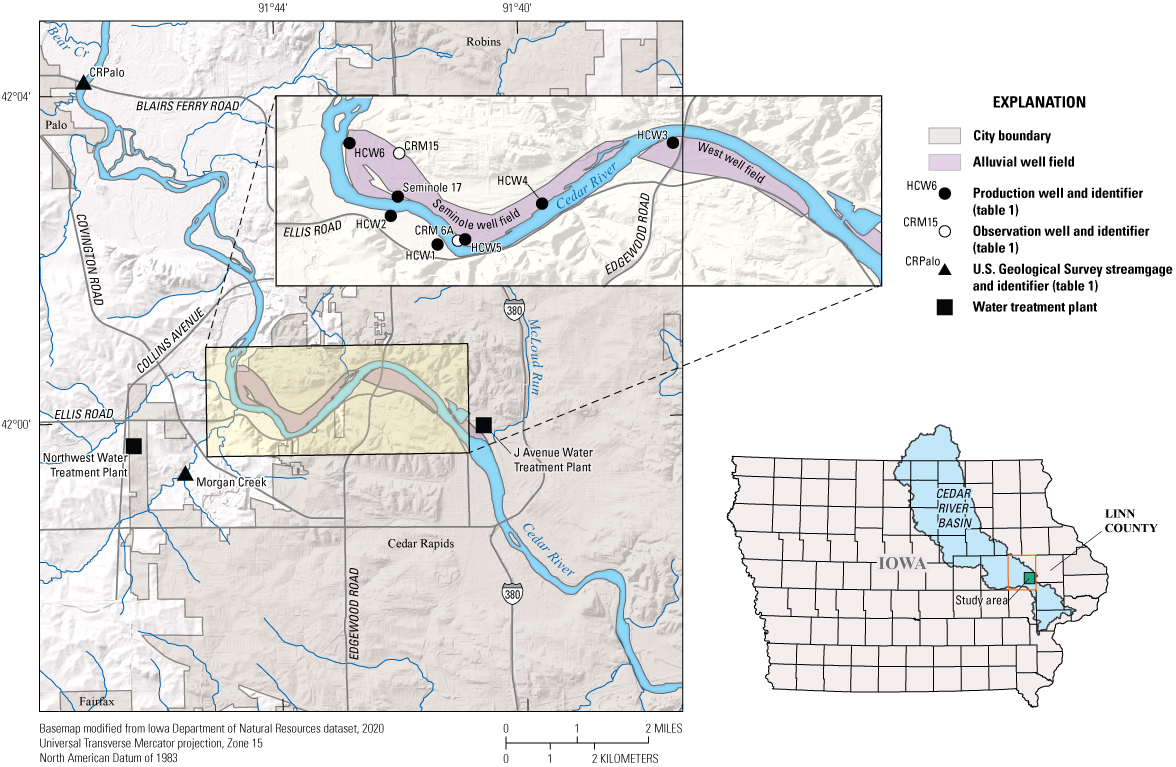
Map showing study area with alluvial well fields and locations of well, stream, and water treatment plant sampling sites, Cedar Rapids, Iowa, 2017–22.
Hydrogeologic units in and near the Cedar Rapids well fields include unconsolidated surficial deposits of loess, glacial till, and Cedar River alluvium (alluvial aquifer), underlain by Silurian and Devonian carbonate bedrock. The Cedar River floodplain ranges between about 1,000 and 3,300 ft wide in the study area and is bounded by steep bluffs that rise nearly 200 ft above the river valley, exposing bedrock in some places. The upland topography is characterized by rolling hills of low relief typically formed in loess and glacial till. The alluvial aquifer ranges from 5 to 95 ft thick near the well fields, with the thickest parts nearest to the present-day location of the Cedar River and the thinnest alluvium adjacent to the valley walls. The alluvial aquifer is characterized by a sequence of coarse sand and gravel at the base, grading upward to fine sand, silt, and clay near the surface. Bedrock in the study area consists primarily of jointed and fractured Paleozoic limestone and dolomite, with interbedded chert and shale (Schulmeyer and Schnoebelen, 1998). The buried bedrock surface has its own complicated erosional topography with multiple superimposed incised channel networks reflecting the area’s glacial history. This Silurian-Devonian sequence has a maximum thickness of about 700 ft in the study area, and although no production wells have been completed in this aquifer, it is used locally for private and industrial water supply. The unconsolidated surficial deposits in the Cedar River Valley, underlying Devonian and Silurian carbonate bedrock, and deeper hydrogeologic units are described in detail by Hansen (1970), Wahl and Bunker (1986), and Schulmeyer and Schnoebelen (1998).
The Cedar River is in direct hydraulic connection with the alluvial aquifer (Turco and Buchmiller, 2004), and the alluvial aquifer is recharged by infiltration from the river, as well as by precipitation and seepage from underlying and adjacent hydrogeologic units. In areas affected by production well pumping, groundwater flows from the Cedar River toward the well fields, whereas in other areas, groundwater generally flows toward the river. Hansen (1970) calculated an approximate transmissivity of the alluvial aquifer to be about 20,000 square feet per day (ft2/d), whereas Schulmeyer (1995) determined that transmissivity varies between 1,500 and 19,000 ft2/d, depending on the physical properties of the alluvium. In May 2006, a contractor to the City of Cedar Rapids performed an aquifer test using Seminole 10 (an abandoned well located on the edge of the riverbank) that yielded a transmissivity value of approximately 15,000 ft2/d (R. Hesemann, Cedar Rapids Water Department, oral commun., March 2007).
Methods of Study
Samples for water-quality analysis were collected from the Cedar River, monitoring wells within the well fields, production wells, and the two Cedar Rapids drinking water treatment plants (table 1). Data include results of water-quality analyses and physical characteristics measured at the time of sample collection. Well locations used for sampling are shown in figure 1. Summary statistics were compiled for water-quality samples. In addition, methods of quality assurance (QA) of samples are discussed, and data on quality-control (QC) samples are presented.
Table 1.
Information on water-quality data collection sites, Cedar Rapids, Iowa, 2017–22.[ID, U.S. Geological Survey site identification number; S, surface water; C, common ions and trace elements; N, nutrients; P, pesticides; --, no data or not applicable; H, Ranney well; A, alluvial; M, monitoring well; SD, Silurian Devonian; T, treatment plant inflow; V, vertical well]
Well Construction and Nomenclature
Wells sampled during the study included 2-inch outer-diameter monitoring wells. The monitoring wells were installed using hollow-stem auger drilling techniques and completed with polyvinyl-chloride flush-joint casing. Bentonite grout was installed around the casing 6 to 8 ft below land surface, and the wells were capped with a cement pad at the surface. Well depths ranged from 18 to 97 ft. Well-construction information for all wells is listed in table 1.
Monitoring wells are named according to a convention that includes the year the well was installed (for example, 1993), the agency identifier (USGS), the local project identifier (CRM, for Cedar Rapids Monitoring), and a unique incremental number (beginning with number 1). For example, well 1993USGS CRM–3 is the third monitoring well installed by the USGS for this project. For convenience in this report, all sites have been given a short name (table 1).
Water-Quality Sampling
Water-quality samples were collected from the Cedar River, Morgan Creek, monitoring wells, production wells, and inflow to two Cedar Rapids drinking water treatment plants (raw water composites from multiple production wells). Water-quality samples were collected from October 2017 through September 2022 and included quarterly water samples and monthly nutrient sampling at the Cedar River and, starting in October 2018, monthly samples at Morgan Creek. Samples were collected from HCWs, vertical wells, and monitoring wells on a quarterly basis. Samples that were a composite of water from vertical wells and HCWs were also collected quarterly at the Cedar Rapids Water Division (hereafter referred to as the “J Avenue plant” and Cedar Rapids Northwest (hereafter referred to as the “Northwest plant”) water treatment plants.
This reporting period was one of transition for some sites and the overall project. Historically, Cedar River samples were collected downstream from Seminole Park at either the Edgewood Road bridge or at a jetty at Mohawk Park. Mohawk Park is approximately 1 river mile downstream from the Edgewood Road bridge. Starting in September 2016, Cedar River sample collection was moved upstream from the city to the CRPalo streamgage. Water quality at the CRPalo streamgage is representative of that flowing into the Cedar Rapids metropolitan area, whereas water in the Cedar River at Mohawk Park or Edgewood Road may have been affected by urban runoff. The first sample collected at the CRPalo streamgage was a flood sample; subsequent samples were either full quarterly samples or monthly nutrient-only samples. During this period, Ranney 5 became operational and was added to the sampling effort. The construction of Ranney 5, however, caused damage to CRM–6A, which removed it from the sampling plan after a single sample and replicate had been collected in November 2018. To offset that loss, a monitoring well, CRM–15, located in a recharge area near the edge of the Cedar River alluvial aquifer that is minimally affected by production well pumping (fig. 1) was added to the sampling plan in February 2020.
The two treatment plants have different operating capacities, and the number of wells sampled by the USGS per plant is not equal. The Northwest plant operates at roughly one-half the scale of the J Avenue plant. The J Avenue plant has a maximum daily output capacity of 40 Mgal/d, whereas the Northwest plant maximum daily output capacity is 20 Mgal/d. Of the production wells sampled for this project, Ranneys 1, 2, and 6 and Seminole 17 are valved to the Northwest plant. Ranneys 3, 4, and 5 are valved to the J Avenue plant. As necessary, Ranney 6 can be valved to the J Avenue plant instead of the Northwest plant for water-quality or water-quantity issues (C. Knapp, City of Cedar Rapids Water Department, written commun., April 2024). For the purposes of this report, because Ranney 6 is typically valved to the Northwest plant, data for Ranney 6 are included in the data tables grouped with data from the Northwest plant. Likewise, because Ranney 5 is typically valved to the J Avenue plant, data for Ranney 5 are in the data tables grouped with data for the J Avenue plant.
Before collecting water samples, monitoring wells are pumped to remove approximately three wellcasing volumes of water. Water samples were collected using either a stainless-steel submersible Fultz pump with fluoropolymer tubing or a Geopump peristaltic pump with C-Flex tubing. All samples were collected after field measurements of dissolved oxygen, pH, specific conductance, turbidity, and water temperature stabilized. These field measurements are summarized in table 2, along with alkalinity, bicarbonate, and carbonate data. Field values were measured in a flow-through chamber for all groundwater sites. Production wells were sampled after they had been pumping for at least 1 hour to obtain a representative sample from the aquifer. Samples from production wells were obtained from a spigot near the pump. Raw combined water samples were collected from the water treatment plants.
Table 2.
Physical characteristics, nutrients and dissolved organic carbon, and major ions analyzed for in water-quality samples from Morgan Creek, Cedar River, and Cedar Rapids wells, 2017–22.[Data are from the U.S. Geological Survey Water Data for the Nation database (U.S. Geological Survey, 2023a); CASRN, Chemical Abstract Service Registry Number; LRL, laboratory reporting level; CaCO3, calcium carbonate; --, not applicable; mg/L, milligram per liter; µS/cm, microsiemen per centimeter; N, nitrogen; P, phosphorus; µg/L, microgram per liter]
Surface-water samples were collected according to protocols detailed in U.S. Geological Survey (variously dated, 2023b) and Wilde (2002) and are summarized here. At the CRPalo streamgage, water-quality samples were collected using equal-width increment methods (U.S. Geological Survey, variously dated) to ensure the sample was representative of water in the entire cross section of the river. Field measurements were collected at a minimum of 10 equidistant points at the surface across the width of the river using a multiparameter sonde. Measurements were made across the total width to document potential variability. Field measurements were obtained using a multiparameter Yellow Springs Instruments EXO2, Eureka Manta 2, or a Eureka Manta 35 sonde. The recorded sample value of dissolved oxygen, pH, specific conductance, turbidity, and water temperature were the median value of the measurements made at the 10 points. Samples were collected at the same points of the cross section where the sonde measurements were made. All samples were combined into a churn splitter for sample processing. For Morgan Creek, all field measurements and samples were vertical center of flow because the stream is narrow, shallow, and well-mixed.
Groundwater samples were collected according to protocols detailed in U.S. Geological Survey (variously dated; 2023b) and Wilde (2002), with the following adaptations. To maintain sampling consistency across the history of the project, all groundwater samples were not processed with clean hands/dirty hands techniques utilizing a sampling chamber and two individuals. Instead, deviation from the standard protocol was that a single person collected, processed, and preserved samples. Raw (unfiltered) samples and pesticides were collected from the pump outlet or production well tap. Filtered samples were collected by connecting a filter directly to the pump outlet tubing and were filtered in situ. Samples from wells were collected to ensure the sample water was representative of that in the aquifer, which meant that production wells had been pumping an extended time before sample collection and that monitoring wells were pumped to remove about three well casing volumes of water before the sample was collected.
All surface-water samples from the Cedar River and Morgan Creek were collected and processed using clean hands/dirty hands techniques, except for samples collected between March 2020 and June 2020 owing to restrictions placed on personnel as a result of the COVID–19 pandemic. As indicated in the “Quality Assurance and Quality Control” section of this report, the adaptation for groundwater sampling did not adversely affect the samples.
Sample Preparation and Laboratory Analysis
Water samples for analysis of nutrients and major ions were filtered through a 0.45-micrometer (µm) pore size Aquaprep polycarbonate disk or Pall capsule filter in the field. Water samples for pesticide analysis in 2018 and 2019 were filtered through a 47-millimeter (mm) diameter, 0.7-µm pore size glass-fiber filter in a Teflon filter holder into a 1-liter (L) baked glass bottle. Starting in 2020, pesticide samples were filtered using a 25-mm diameter, 0.7-µm pore size borosilicate glass-fiber syringe tip filter into a baked glass 20 milliliter (mL) vial. After collection, water samples were kept chilled until shipped overnight to the USGS National Water-Quality Laboratory in Denver, Colorado, for analysis.
Samples were analyzed to determine nutrient concentrations using colorimetric methods (Patton and Kryskalla, 2011) for dissolved species and alkaline persulfate digestion (Patton and Kryskalla, 2003) for unfiltered samples. Analytical methods used for major ions are described by Fishman (1993). Inductively coupled plasma–atomic emission spectrometry was used to determine boron concentrations (Struzeski and others, 1996). The high-temperature combustion method was used to determine the total organic carbon concentration in samples (ASTM International, 2019).
Nutrients, dissolved organic carbon, physical characteristics, and major ions from water-quality samples, the Chemical Abstract Service Registry Number, laboratory reporting limits (LRL), and reporting units are listed in table 2. Pesticides from water-quality samples, followed by the Chemical Abstract Service Registry Number, and LRLs are listed in table 3. The LRL is used to specify the lowest quantifiable value for constituents listed in tables 2 and 3. The LRL is defined more rigorously by statistics than the older minimum reporting level that it replaces (Oblinger Childress and others, 1999).
Table 3.
Selected pesticides analyzed in water-quality samples from the Cedar River and Cedar Rapids wells, 2017–22.[Data are from the U.S. Geological Survey Water Data for the Nation database (U.S. Geological Survey, 2023a); CASRN, Chemical Abstract Service Registry Number; LRL, laboratory reporting level; GC/MS, analytical method gas chromatograph/mass spectrometry (Sandstrom and others, 2001); µg/L, microgram per liter; LC–MS/MS, analytical method liquid chromatography /tandem mass spectrometry (Sandstrom and others, 2015);] ng/L, nanogram per liter; --, not applicable
During this period of record, the analytical method for pesticides was changed from a C–18 solid-phase extraction and gas chromatography/mass spectrometry method (Sandstrom and others, 2001) to direct aqueous-injection liquid chromatography–tandem mass spectrometry (LC–MS/MS) in December 2019 (Sandstrom and others, 2015). The analysis was changed to analyze for a broader range of constituents at a lower LRL (table 3). The LC–MS/MS analytical method includes more than 200 fungicides, herbicides, insecticides, and associated transformation products (TPs) with results at similar or lower concentrations than previously available methods. The pesticides represent a broad range of chemical classes and were selected based on criteria such as current-use intensity, probability of occurrence in streams and groundwater, and toxicity to humans or aquatic organisms (Sandstrom and others, 2015)
Quality Assurance and Quality Control
To properly interpret water-quality data and to verify these data are reliable and accurate, QA procedures are followed and QC samples are collected in addition to the environmental samples. In general, QA includes using correct procedures and protocols, proper documentation (log books and field sheets) and approved analytical methods. The QC samples typically are used in the estimation of the magnitude of bias and variability of the environmental samples. Bias is systematic error that can “skew” results in either a positive or negative direction. The most common source of positive bias in water-quality studies is contamination of samples from airborne gases and particulates or inadequately cleaned sampling equipment between uses and locations. Variability is the degree of random error of independent measurements of the sample quantity. Variability may be the result of errors in laboratory analytical procedures or in collection of samples in the field. The QA/QC procedures are followed to ensure the data collected meet standards of reliability and accuracy.
The QA/QC procedures for the study followed USGS protocols (U.S. Geological Survey, variously dated) and other USGS guidelines (Mueller and others, 1997) and included documenting any deviations made in the field. Approximately 5 percent of the total samples collected for the study were analyzed for QC including equipment blanks, field blanks, and replicates. Generally, field blanks are used to estimate sample bias, whereas replicates are used to estimate sample variability.
A field blank is a water sample that is intended to be free of the analytes of interest. Two types of commercially available blank waters were used for equipment and field blanks. Organic blank water (OBW) and inorganic blank water (IBW) are certified by the manufacturer (Ricca) to be free of either organic compounds (OBW) or inorganic compounds (IBW). In the case of equipment blanks, blank water was passed through all sampling equipment in a “clean environment,” such as the laboratory, to examine the cleanliness of the equipment before sampling. A field blank is a specific type of blank sample collected in the field and is used to demonstrate that (1) equipment has been adequately cleaned to remove contamination introduced by samples obtained at the previous site; (2) sample collection and processing have not resulted in contamination; and (3) sample handling, transport, and laboratory analysis have not introduced contamination (Mueller and others, 1997). Field blank samples of the OBW and IBW were collected by passing water through all pumps, filter holders, and filters to verify the cleanliness of sampling equipment and technique. Field blank sample concentrations of inorganic constituents typically were at or below the LRL. For this dataset, calcium, chloride, dissolved organic carbon, ammonia, nitrite as nitrogen, nitrite, and phosphorus were all detected in field blank samples. Of the 11 detections in field blank samples, eight of them were close to the reporting levels and three were unexplainable. There were no detections of organic constituents in field blank samples.
Replicates are two or more samples collected or processed so that the samples are considered essentially identical in composition. All replicate samples for groundwater and surface-water point samples were collected as sequential samples (that is, they were collected one after the other, utilizing the same techniques and filters, as necessary). All composited surface-water samples were collected as split replicates (that is, they were collected in and processed from the same container but were processed as replicates at the laboratory). For the purposes of this report, the terms “environmental sample” and “replicate sample” are used to identify a particular sample in a replicate pair.
One objective of collecting replicate pairs was to estimate the precision of constituent concentrations determined by sample processing and analysis. Analytical results of organic constituents generally are more variable than those of inorganic constituents. Replicate pairs were compared by using relative percent differences (RPD). The RPD between sample pairs was calculated using the following equation:
whereabs
is the absolute value;
S1
is equal to the concentration in the environmental sample, in micrograms per liter or milligrams per liter; and
S2
is equal to the concentration in the replicate sample, in the same units as S1.
A large relative percent difference can indicate greater variability between samples. Variability for all constituents in the replicate samples generally was within 10 percent of the environmental samples. As shown in table 4, the maximum RPD for nutrients ranged from 0.00 to 7.14 percent, the maximum RPD for organic carbon and major ions ranged from 0.46 to 49.0 percent, and the maximum RPD for pesticides ranged from 0.46 to 104 percent. It should be noted that when comparing low concentrations between replicate pairs, the RPD can appear relatively large because slight differences (common at the lowest detection levels) can result in higher RPDs. For example, an environmental value of 0.029 milligram per liter (mg/L) for bromide with a replicate value of 0.024 mg/L has an RPD of 9.4 percent, although the absolute difference between the pair was 0.005 mg/L. The median RPD for nutrients ranged from 0.00 to 1.14, the median RPD for organic carbon and major ions ranged from 0.00 to 14.0, and the median RPD for pesticides ranged from 0.00 to 18.3.
Table 4.
Replicate water-quality data for nutrients, major ions, and pesticides in groundwater and surface-water samples, Cedar Rapids, Iowa, 2018–22.[Data are from the U.S. Geological Survey Water Data for the Nation database (U.S. Geological Survey, 2023a); N, nitrogen; P, phosphorus; SiO2, silicon dioxide; CaCO3, calcium carbonate]
Surrogates were added to all environmental and quality-control samples for pesticide analysis before sample preparation in the laboratory. A surrogate has physical and chemical properties similar to those of the analytes of interest but is not normally present in environmental samples. Surrogates provide QC by monitoring matrix effects and gross processing errors (Wershaw and others, 1987) and help control for bias, either positive or negative. Surrogate recoveries of organic chemicals are expressed in percent and typically range from 80 to 120 percent. Three surrogates—carbendazim-d4, 2,4-D-d3, and alachlor-d13—had a combined 14 recoveries of 0. The minimum median recovery for all sites and surrogates was 48.8, and the maximum was 110.5. Surrogate recoveries that consistently are less than 70 percent may indicate that many targeted compounds may be present in greater concentrations than reported. Minimum, maximum, and median surrogate percent recoveries are listed in table 5.
Table 5.
Analytical recovery of selected pesticide surrogates for Cedar River and groundwater samples, Cedar Rapids, Iowa, 2017–22.[Data are from the U.S. Geological Survey Water Data for the Nation database (U.S. Geological Survey, 2023a); NWWTP, Cedar Rapids Northwest Water Treatment Plant; JAve, Cedar Rapids Water Division (raw composite water); GC/MS, gas chromatograph/mass spectrometry (Sandstrom and others, 2001); Min, minimum; --, not applicable; Max, maximum; Med, median; LC–MS/MS, liquid chromatography/tandem mass spectrometry (Sandstrom and others, 2015)]
Water-Quality Data for Cedar River and Cedar Rapids Well Fields
The results of the water-quality samples collected from October 2017 through September 2022 are summarized in tables 6–8. Data compiled are from samples collected from the Cedar River, production wells, monitoring wells, and the two water treatment plants with quarterly monitoring. Other water-quality data were obtained from monthly nutrient sampling on the Cedar River and Morgan Creek.
Water-quality data were used to assess the quality of water in the Cedar River alluvial aquifer and the Cedar River. The Cedar River is the major influence on water quality in the Cedar River alluvial aquifer because of induced infiltration from the river because of the pumping of wells (Schulmeyer and Schnoebelen, 1998; Boyd and others, 1999; Turco and Buchmiller, 2004; Kalkhoff, 2021; Haj and others, 2023). Agricultural chemicals (nutrients and pesticides) are of concern because of the predominance of agricultural land use (90 percent and greater) in the Cedar River Basin. An 11.6-mile reach of the Cedar River between the confluence with Bear Creek, which is upstream from the CRPalo streamgage, and the confluence with McLoud Run in Cedar Rapids, is shown on the Iowa Department of Natural Resources 2022 water quality assessments impaired waters map (Iowa Department of Natural Resources, 2025). For this segment of the river, a total maximum daily load limit was established for nitrate by the Iowa Department of Natural Resources (2006).
Physical Characteristics, Nutrients, and Major Ions
Physical characteristics were measured at each sampling site when a water-quality sample was collected. Physical characteristics reported include temperature, pH, dissolved oxygen, specific conductance, turbidity, alkalinity, bicarbonate, and carbonate. Summary statistics for the physical characteristics of sample water from individual sites are listed in table 6.
Table 6.
Summary statistics for physical characteristics of surface-water and groundwater samples Cedar Rapids, Iowa, 2017–22.[Data are from the U.S. Geological Survey Water Data for the Nation database (U.S. Geological Survey, 2023a); NWWTP, Cedar Rapids Northwest Water Treatment Plant; JAve, Cedar Rapids Water Division (raw composite water); °C, degrees Celsius; Min, minimum; --, not applicable; Max, maximum; Med, median; mg/L, milligram per liter; <, less than; µS/cm, microsiemen per centimeter at 25 degrees Celsius; FNU, formazin nephelometric units; CaCO3, calcium carbonate. Shortened names for sites defined in table 1]
Nutrient data were compiled for ammonia as nitrogen, nitrite as nitrogen, nitrite plus nitrate as nitrogen, orthophosphate as phosphorus, ammonia plus organic nitrogen as nitrogen, and phosphorus. Dissolved organic carbon data are summarized with the nutrient data. Major ion data were compiled for total dissolved solids, iron, manganese, fluoride, calcium, magnesium, silica, sodium, chloride, sulfate, boron, potassium, and bromide. Major ion data are required for characterization of water chemistry and geochemical modeling. Nutrient and major ion concentration summary statistics for surface water and groundwater are listed in table 7.
Table 7.
Summary statistics for nutrient and major ion concentrations in surface-water and groundwater water samples, Cedar Rapids, Iowa, 2017–22.[Data are from the U.S. Geological Survey Water Data for the Nation database (U.S. Geological Survey, 2023a); NWWTP, Cedar Rapids Northwest Water Treatment Plant; JAve, Cedar Rapids Water Division (raw composite water); N, nitrogen; mg/L, milligram per liter; Min, minimum; <, less than; --, not applicable µg/L, microgram per liter; Max, maximum; Med, median; E, estimated. Shortened names for sites defined in table 1]
Pesticides
Pesticides are used to control unwanted vegetation, insects, and other pests in agricultural and urban areas. Typically, large amounts (thousands of pounds per year) of common herbicides are applied during the growing season in the Cedar River Basin to corn and soybean crops (Schnoebelen and others, 2003). In 2019, the most recent pesticide-use data available indicated glyphosate, acetochlor, atrazine, and metolachlor were the most commonly used herbicides in Iowa (U.S. Geological Survey, 2024). Insecticides are detected less often in water, most likely because they are used in smaller amounts than herbicides, have shorter persistence, and are selectively applied during periods of reduced runoff (Schnoebelen and others, 2003). Pesticide TPs are formed when a parent pesticide compound breaks down or degrades. TPs often have been detected at higher concentrations than their parent compounds (Kolpin and others, 2000, 2004; Schnoebelen and others, 2003). There were 123 TPs analyzed using the gas chromatography/mass spectrometry and LC–MS/MS analytical methods during the 2017 to 2022 time period. The complete list of pesticides and TPs analyzed are included in table 4. Summary statistics for pesticides detected in samples are summarized in table 8.
Table 8.
Summary statistics for detected pesticides in Cedar River and groundwater samples, Cedar Rapids, Iowa, 2017–22.[Data are from the U.S. Geological Survey Water Data for the Nation database (U.S. Geological Survey, 2023a); NWWTP, Cedar Rapids Northwest Water Treatment Plant; JAve, Cedar Rapids Water Division (raw composite water); Max, maximum detected concentration, in nanograms per liter; --, not applicable; E, estimated; Detect, frequency of detection; refer to table 3 for laboratory reporting levels; pesticides analyzed using liquid chromatography/tandem mass spectrometry (Sandstrom and others, 2015). Shortened names for sites defined in table 1]
Summary
The Cedar River alluvial aquifer is the primary source of drinking water in Cedar Rapids, Iowa. Production wells are completed in the alluvial aquifer about 40 to 80 feet below land surface. A cooperative effort began in 1992 between the U.S. Geological Survey and the City of Cedar Rapids to study the groundwater-flow system and water quality of the aquifer. Water-quality samples were collected for studies involving well field monitoring, trends, source-water protection, groundwater geochemistry, surface-water–groundwater interaction, and pesticides in groundwater and surface water. Water-quality was analyzed for dissolved major ions (boron, bromide, calcium, chloride, fluoride, iron, magnesium, manganese, potassium, silica, sodium, sulfate, and total dissolved solids), dissolved nutrients (ammonia as nitrogen, ammonia plus organic nitrogen as nitrogen, nitrite plus nitrate as nitrogen, nitrite as nitrogen, orthophosphate as phosphorus, and phosphorus), dissolved organic carbon, and selected pesticides. Physical characteristics (alkalinity, dissolved oxygen, pH, specific conductance, turbidity, and water temperature) were measured onsite and recorded for each water sample collected. This report presents the results of routine water-quality data-collection activities from water years 2017 through 2022. Methods of data collection, quality assurance, water-quality analyses, and statistical procedures are presented. Data include the results of water-quality analyses from quarterly sampling of observation wells, production wells, and two drinking water treatment plants, and monthly nutrient sampling from the Cedar River and Morgan Creek.
References Cited
ASTM International, 2019, Standard test method for total carbon and organic carbon in water by high temperature catalytic combustion and infrared detection: ASTM International, accessed September 2025 at https://doi.org/10.1520/D7573-18AE01.
Boyd, R.A., 1998, Characterizing groundwater flow in the municipal well fields of Cedar Rapids, Iowa, with selected environmental tracers: Journal of the American Water Resources Association, v.34, no. 3, p. 507–518. [Also available at https://doi.org/10.1111/j.1752-1688.1998.tb00950.x.]
Boyd, R.A., 2000, Herbicides and herbicide degradates in shallow ground water and the Cedar River near a municipal well field, Cedar Rapids, Iowa: Science of the Total Environment, v. 248, p. 241–253. [Also available at https://doi.org/10.1016/S0048-9697(99)00546-X.]
Boyd, R.A., Kuzniar, R.L., and Schulmeyer, P.M., 1999, Selected hydrologic data from the Cedar Rapids area, Linn County, Iowa, April 1996 through March 1999: U.S. Geological Survey Open File Report 99–461, 214 p. [Also available at https://doi.org/10.3133/ofr99461.]
Deszcz-Pan, M., Smith, D.V., Smith, B.D., Haj, A.E., and Johnson, M.R., 2018, Airborne electromagnetic and magnetic survey data and inverted resistivity models, Cedar Rapids, Iowa, May 2017: U.S. Geological Survey data release, accessed July 2024 at https://doi.org/10.5066/P9BS882S.
Fishman, M.J., ed., 1993, Methods of analysis by the U.S. Geological Survey National Water Quality Laboratory—Determination of inorganic and organic constituents in water and fluvial sediments: U.S. Geological Survey Open-File Report 93–125, 217 p. [Also available at https://doi.org/10.3133/ofr93125.]
Garrett, J.D., 2021, Total phosphorus loadings for the Cedar River at Palo, Iowa, 2009–20: U.S. Geological Survey Scientific Investigations Report 2021–5127, 15 p. [Also available at https://doi.org/10.3133/sir20215127.]
Haj, A.E., Gruhn, L.R., and Kalkhoff, S.J., 2023, One Ranney well can make a difference: the impacts of a radial collector well on water quantity and quality in the Cedar River alluvial aquifer: Groundwater Monitoring & Remediation vol. 43. no. 2, pp. 51-60, available online at https://doi.org/10.1111/gwmr.12560
Haj, A.E., Ha, W.S., Gruhn, L.R., Bristow, E.L., Gahala, A.M., Valder, J.F., Johnson, C.D., White, E.A., and Sterner, S.P., 2021, Conceptual and numerical groundwater flow model of the Cedar River alluvial aquifer system with simulation of drought stress on groundwater availability near Cedar Rapids, Iowa, for 2011 through 2013: U.S. Geological Survey Scientific Investigations Report 2021–5065, 59 p. [Also available at https://doi.org/10.3133/sir20215065.]
Hansen, R.E., 1970, Geology and ground-water resources of Linn County, Iowa: Iowa Geological Survey Water-Supply Bulletin 10, 67 p., accessed May 7, 2024 at https://www.iihr.uiowa.edu/igs/publications/uploads/WSB-10.pdf.
Iowa Department of Natural Resources, 2006, Total maximum daily load for nitrate, Cedar River, Linn County, Iowa: Watershed Improvement Section, 55 p., accessed May 20, 2025, at https://publications.iowa.gov/id/eprint/52454.
Iowa Department of Natural Resources, 2025, 2022 Impaired waters map: Iowa Department of Natural Resources ADBNet, accessed June 9, 2025, at https://programs.iowadnr.gov/adbnet/Assessments/Summary/2022/Impaired/Map.
Johnson, C.D., Bristow, E.L., White, E.A., Gruhn, L.R., Pappas, K.L., Phillips, S.N., and Lane, J.W., Jr., 2020, Geophysical data collected in the Cedar River Floodplain, Cedar Rapids, Iowa, 2015–2017: U.S. Geological Survey data release, accessed July 2024 at https://doi.org/10.5066/P9YXJDHX.
Kalkhoff, S.J., 2018, Transport of nitrogen and phosphorus in the Cedar River Basin, Iowa and Minnesota, 2000–15: U.S. Geological Survey Scientific Investigations Report 2018–5090, 44 p. [Also available at https://doi.org/10.3133/sir20185090.]
Kalkhoff, S.J., 2021, Hydrologic and water-quality conditions in the Cedar River alluvial aquifer, Linn County, Iowa, 1990–2019: U.S. Geological Survey Scientific Investigations Report 2021–5110, 61 p. [Also available at https://doi.org/10.3133/sir20215110.]
Kolpin, D.W., Thurman, E.M., and Linhart, S.M., 2000, Finding minimal herbicide concentrations in ground water? Try looking for degradates: Science of the Total Environment, v. 248, p. 115–122. [Also available at https://doi.org/10.1016/S0048-9697(99)00535-5.]
Kolpin, D.W., Schnoebelen, D.J., and Thurman, E.M., 2004, Degradates provide insight to spatial and temporal trends of herbicides in ground water: Ground Water, v. 42, no. 4, p. 601–608. [Also available at https://doi.org/10.1111/j.1745-6584.2004.tb02628.x.]
Littin, G.R., 2012, Selected water-quality data from the Cedar River and Cedar Rapids well fields, Cedar Rapids, Iowa, 2006–10: U.S. Geological Survey Data Series 657, 32 p. [Also available at https://doi.org/10.3133/ds657.]
Littin, G.R., and Schnoebelen, D.J., 2010, Selected water-quality data from the Cedar River and Cedar Rapids well fields, Cedar Rapids, Iowa, 1999–2005: U.S. Geological Survey Data Series 494, 52 p. [Also available at https://doi.org/10.3133/ds494.]
Meppelink, S.M., Stelzer, E.A., Bristow, E.L., and Littin, G.R., 2019, Selected water-quality data from the Cedar River and Cedar Rapids well fields, Cedar Rapids, Iowa, 2008–17: U.S. Geological Survey Data Series 1110, 49 p. [Also available at https://doi.org/10.3133/ds1110.]
Mueller, D.K., Martin, J.D., and Lopes, T.J., 1997, Quality-control design for surface-water sampling in the National Water-Quality Assessment Program: U.S. Geological Survey Open-File Report 97–223, 17 p. [Also available at https://doi.org/10.3133/ofr97223.]
National Oceanic and Atmospheric Administration, 2025, NOWData—NOAA online weather data, Cedar Rapids area: National Oceanic and Atmospheric Administration, National Weather Service website, accessed May 27, 2025, at https://www.weather.gov/wrh/Climate?wfo=dvn.
Oblinger Childress, C.J., Foreman, W.T., Connor, B.F., and Maloney, T.J., 1999, New reporting procedures based on long-term method detection levels and some considerations for interpretations of water-quality data provided by the U.S. Geological Survey National Water Quality Laboratory: U.S. Geological Survey Open-File Report 99–193, 19 p. [Also available at https://doi.org/10.3133/ofr99193.]
Patton, C.J., and Kryskalla, J.R., 2003, Methods of analysis by the U.S. Geological Survey National Water Quality Laboratory—Evaluation of alkaline persulfate digestion as an alternative to Kjeldahl digestion for determination of total and dissolved nitrogen and phosphorus in water: U.S. Geological Survey Water-Resources Investigations Report 2003–4174, 33 p. [Also available at https://doi.org/10.3133/wri034174.]
Patton, C.J., and Kryskalla, J.R., 2011, Colorimetric determination of nitrate plus nitrite in water by enzymatic reduction, automated discrete analyzer methods: U.S. Geological Survey Techniques and Methods, book 5, chap. B8, 34 p. [Also available at https://doi.org/10.3133/tm5B8.]
Sandstrom, M.W., Stroppel, M.E., Foreman, W.T., and Schroeder, M.P., 2001, Methods of analysis by the U.S. Geological Survey National Water Quality Laboratory—Determination of moderate-use pesticides and selected degradates in water by C-18 solid-phase extraction and gas chromatography/mass spectrometry: U.S. Geological Survey Water-Resources Investigations Report 2001–4098, 70 p. [Also available at https://doi.org/10.3133/wri20014098.]
Sandstrom, M.W., Kanagy, L.K., Anderson, C.A., and Kanagy, C.J., 2015, Determination of pesticides and pesticide degradates in filtered water by direct aqueous-injection liquid chromatography-tandem mass spectrometry: U.S. Geological Survey Techniques and Methods, book 5, chap. B11, 54 p. [Also available at https://doi.org/10.3133/tm5B11.]
Schnoebelen, D.J., Kalkhoff, S.J., Becher, K.D., and Thurman, E.M., 2003, Water-quality assessment of the eastern Iowa Basins: Selected pesticides and pesticide degradates in streams, 1996–98: U.S. Geological Survey Water Resources Investigations Report 2003–4075, 62 p. [Also available at https://doi.org/10.3133/wri034075.]
Schnoebelen, D.J., and Schulmeyer, P.M., 1996, Selected hydrogeologic data from the Cedar Rapids area, Benton and Linn Counties, Iowa, October 1992 through March 1996: U.S. Geological Survey Open File Report 96–471, 172 p. [Also available at https://doi.org/10.3133/ofr96471.]
Schulmeyer, P.M., Barnes, K.K., and Squillace, P.J., 1995, Hydrologic data from the lower Cedar River Basin, Iowa, 1989-91: U.S. Geological Survey Open File Report 94–711–W, 116 p. [Also available at https://doi.org/10.3133/ofr94711W.]
Schulmeyer, P.M., 1995, Effect of the Cedar River on the quality of ground-water supply for Cedar Rapids, Iowa: U.S. Geological Survey Water-Resources Investigations Report 94–4211, 68 p. [Also available at https://doi.org/10.3133/wri944211.]
Schulmeyer, P.M., and Schnoebelen, D.J., 1998, Hydrogeology and water quality in the Cedar Rapids area, Iowa, 1992–96: U.S. Geological Survey Water-Resources Investigations Report 97–4261, 77 p. [Also available at https://doi.org/10.3133/wri974261.]
Struzeski, T.M., DeGiacomo, W.J., and Zayhowski, E.J., 1996, Methods of analysis by the U.S. Geological Survey National Water Quality Laboratory—Determination of dissolved aluminum and boron in water by inductively coupled plasma-atomic emission spectrometry: U.S. Geological Survey Open-File Report 96–149, 17 p. [Also available at https://doi.org/10.3133/ofr96149.]
Turco, M.J., and Buchmiller, R.C., 2004, Simulation of ground-water flow in the Cedar River alluvial aquifer flow system, Cedar Rapids, Iowa: U.S. Geological Survey Scientific Investigations Report 2004–5130, 39 p. [Also available at https://doi.org/10.3133/sir20045130.]
U.S. Census Bureau, 2023, QuickFacts, Cedar Rapids city, Iowa: accessed June 2023 at https://www.census.gov/quickfacts/cedarrapidscityiowa.
U.S. Geological Survey, variously dated, National field manual for the collection of water-quality data: U.S. Geological Survey Techniques of Water-Resources Investigations, book 9, chap. A4, 166 p., online at https://doi.org/10.3133/twri09A4
U.S. Geological Survey, 2023a, USGS water data for the Nation: U.S. Geological Survey National Water Information System database, accessed June 7, 2023, at https://doi.org/10.5066/F7P55KJN.
U.S. Geological Survey, 2023b, Guidelines for field-measured water-quality properties (version 1.1, July 17, 2023): U.S. Geological Survey Techniques and Methods, book 9, chap. A6.0, 22 p. [Also available at https://doi.org/10.3133/tm9A6.0.]
U.S. Geological Survey, 2024, Pesticide national synthesis project estimated annual agricultural pesticide use: U.S. Geological Survey web page, accessed May 20, 2025, at https://water.usgs.gov/nawqa/pnsp/usage/maps/county-level/.
Valder, J.F., Haj, A.E., Bristow, E.L., and Valseth, K.J., 2018, Delineation of selected lithologic units using airborne electromagnetic data near Cedar Rapids, Iowa (ver. 1.1, February 2019): U.S. Geological Survey Scientific Investigations Map 3423, 2 sheets, 9-p. pamphlet, accessed July 2024 at https://doi.org/10.3133/sim3423.
Wahl, K.D., and Bunker, B.J., 1986, Hydrology of carbonate aquifers in southwestern Linn County and adjacent parts of Benton, Iowa, and Johnson Counties, Iowa: Iowa Geological Survey, Water Supply Bulletin no. 15, 56 p., accessed May 20, 2025, at https://publications.iowa.gov/id/eprint/25804.
Wershaw, R.L., Fishman, M.J., Grabbe, R.R., and Lowe, L.E., eds., 1987, Methods for the determination of organic substances in water and fluvial sediments: U.S. Geological Survey Techniques of Water-Resources Investigations, book 5, chap. A3, 80 p. [Also available at https://doi.org/10.3133/twri05A3.]
Wilde, F.D, 2002, Processing of water samples: Techniques of Water-Resources Investigations, book 09, chap. A5., 166 p. [Also available at https://doi.org/10.3133/twri09A5.]
Conversion Factors
U.S. customary units to International System of Units
Datums
Horizontal coordinate information is referenced to the Universal Transverse Mercator projection, Zone 15, North American Datum of 1983.
Supplemental Information
Specific conductance is given in microsiemens per centimeter at 25 degrees Celsius (µS/cm at 25 °C).
Concentrations of chemical constituents in water are given in milligrams per liter (mg/L), micrograms per liter (µg/L), or nanograms per liter (ng/L).
Abbreviations
CRM
Cedar Rapids Monitoring
HCW
horizontal collector wells
IBW
inorganic blank water
LC–MS/MS
liquid chromatography–tandem mass spectrometry
LRL
laboratory reporting limit
OBW
organic blank water
QA
quality assurance
QC
quality control
RPD
relative percent difference
TP
transformation product
USGS
U.S. Geological Survey
For more information about this publication, contact:
Director, USGS Central Midwest Water Science Center
400 South Clinton Street, Suite 269
Iowa City, IA 52240
319–337–4191
For additional information, visit: https://www.usgs.gov/centers/cm-water
Publishing support provided by the
USGS Science Publishing Network,
Rolla Publishing Service Center
Disclaimers
Any use of trade, firm, or product names is for descriptive purposes only and does not imply endorsement by the U.S. Government.
Although this information product, for the most part, is in the public domain, it also may contain copyrighted materials as noted in the text. Permission to reproduce copyrighted items must be secured from the copyright owner.
Suggested Citation
Meppelink, S.M., and Kalkhoff, S.J., 2026, Selected water-quality data from the Cedar River and Cedar Rapids well fields, Cedar Rapids, Iowa, 2017–22: U.S. Geological Survey Data Report 1224, 34 p., https://doi.org/10.3133/dr1224.
ISSN: 2771-9448 (online)
Study Area
| Publication type | Report |
|---|---|
| Publication Subtype | USGS Numbered Series |
| Title | Selected water-quality data from the Cedar River and Cedar Rapids well fields, Cedar Rapids, Iowa, 2017–22 |
| Series title | Data Report |
| Series number | 1224 |
| DOI | 10.3133/dr1224 |
| Publication Date | April 08, 2026 |
| Year Published | 2026 |
| Language | English |
| Publisher | U.S. Geological Survey |
| Publisher location | Reston, VA |
| Contributing office(s) | Central Midwest Water Science Center |
| Description | Report: vii, 34 p.; Dataset |
| Country | United States |
| State | Iowa |
| City | Cedar Rapids |
| Other Geospatial | Cedar Rapids Well Fields, Cedar River |
| Online Only (Y/N) | Y |
| Additional Online Files (Y/N) | N |