

Maryland and Landsat
Links
- Document: Report (4.61 MB pdf) , HTML , XML
- Version History: Version History (4.01 kB txt)
- Download citation as: RIS | Dublin Core
Abstract
Maryland, called “America in Miniature,” encompasses nearly every geographical feature in the United States except a desert. Water dominates the State, whose borders run along much of Chesapeake Bay. The bay is the country’s largest estuary, where freshwater from watershed tributaries mingles with the ocean’s saltwater and teems with life.
The Chesapeake Bay faces threats from erosion, pollution, rising sea levels, and natural disasters. Because the Chesapeake Bay is prominent in Maryland’s history, economy, natural diversity, and way of life, protecting its waters and ecosystems is a priority for the State. Landsat imagery helps with a number of these efforts. Maryland also has a special relation with Landsat satellites; the USGS manages their flight operations out of NASA’s Goddard Space Flight Center in Greenbelt.
Here are several ways Landsat data have been benefiting Maryland.
Lowering Pollutants Entering Chesapeake Bay
Land cover data provided by Landsat satellites are helping Maryland and other States whose water drains into the Chesapeake Bay watershed to set their specific total maximum daily loads (TMDLs) of pollutants. TMDLs are estimates of the amount of certain pollutants that a body of water could handle before its quality is adversely affected. TMDLs can include excess nutrients, sediments, and contaminants. Landsat data help identify areas for targeting nonpoint source pollution, looking in part at the type of surface that the runoff travels over, such as pavement or cropland or forest (USGS, 2017).
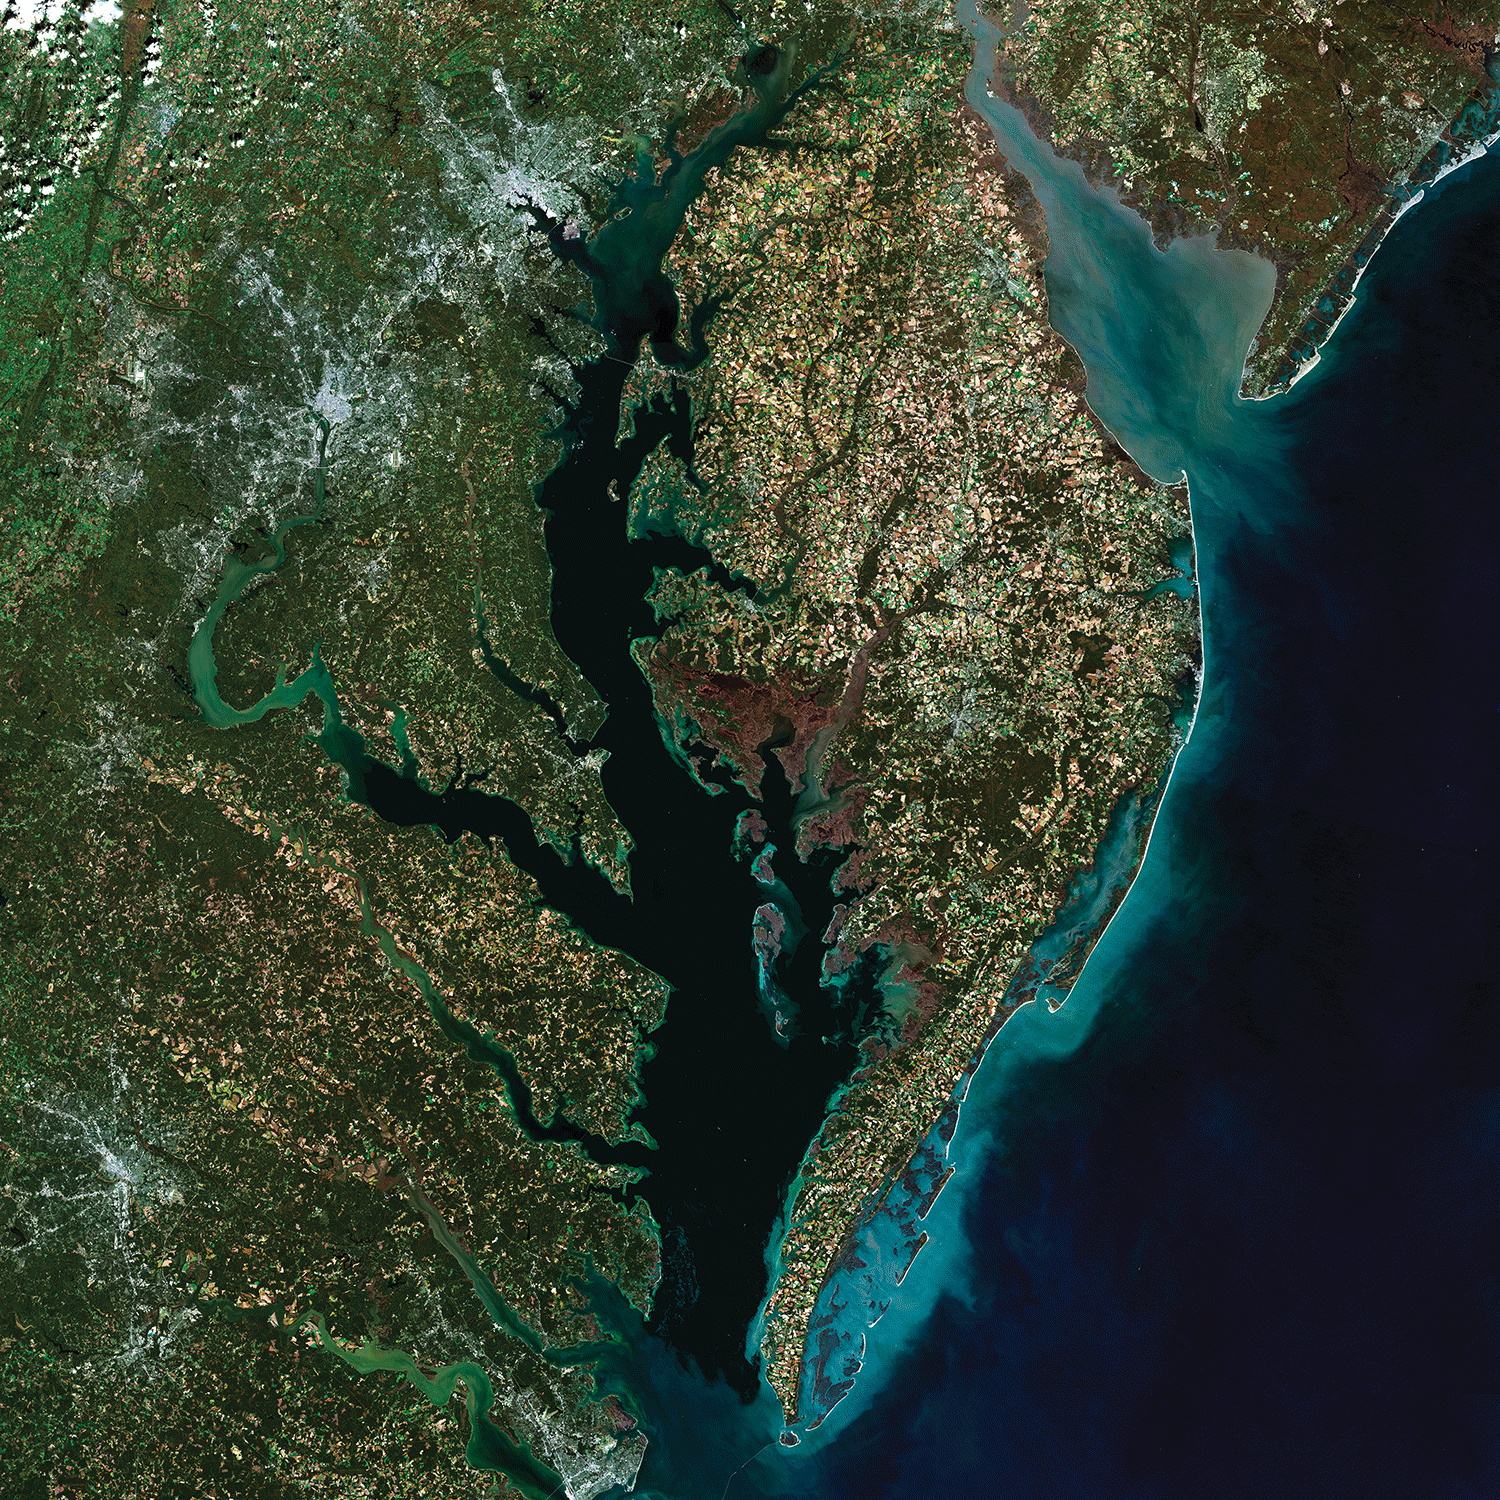
This image of the Chesapeake Bay, America’s largest estuary, was created using Provisional Surface Reflectance data from five Landsat 8 scenes acquired in October and November 2014.
Helping Farmers Reduce Runoff
Images from Landsats 5 and 8 were used recently to help create a tool for the Maryland Department of Agriculture (MDA) to monitor and analyze the effectiveness of winter cover crops. The MDA provides a subsidy to encourage farmers to plant winter cover crops that help prevent erosion and runoff. The new tool allows the MDA to check the effectiveness of the cover crops, without requiring a site visit, and can help identify ways to improve the use of cover crops (Voiland, 2017).
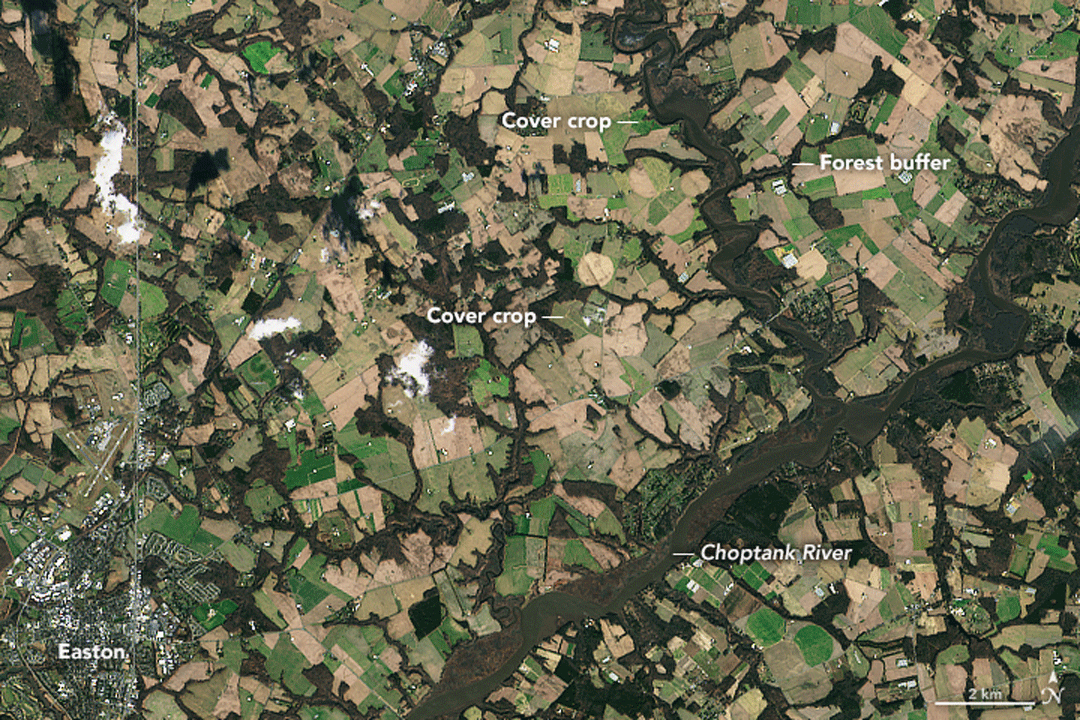
The Operational Land Imager on Landsat 8 captured a natural-color image on January 5, 2015, that shows winter cover crops being grown on farmland along Tuckahoe Creek and the Choptank River on the Delmarva Peninsula.
Assessing Coastal Wetlands
Landsat images are being used by the USGS to help assess the status of coastal wetlands. Long-term climate change-related processes, such as rising sea levels, can change wetlands, but so can sudden storms. For example, Assateague Island, a barrier island famed for its wild horses off the coast of Maryland, had significant erosion, saltwater overwash, and deposition from Hurricane Sandy. The use of Landsat data to understand the connections among ocean coastlines and the shorelines of estuaries and barrier islands, including interior wetlands, can help coastal land managers make decisions and predictions about the effects of future events (Douglas and others, 2018).

A band of Assateague Island National Seashore’s famed wild horses stand in a saltmarsh. Photograph credit: U.S. National Park Service.
Mapping High-Tide Flooding
Rising sea levels have increased the frequency of flooding caused by higher-than-historically normal tide levels along Maryland’s shoreline. The Landsat 7 and 8 satellites have helped with mapping of flooding caused by these high tides. In Annapolis, one site prone to such floods, water can fill streets and parking lots and even affect the U.S. Naval Academy. Compounding factors for these high tides include moon phases, wind direction, and land subsidence (Marder, 2020).

The U.S. Naval Academy is located along the Chesapeake Bay in Annapolis, Maryland. The campus has taken measures to minimize flooding damages, but in high-tide flooding, Ramsay Road routinely floods. Photograph credit: U.S. Naval Academy.
National Land Imaging Program Benefits—Maryland
The U.S. Geological Survey (USGS) National Land Imaging Program provides a wide range of satellite imagery and other remotely sensed and geospatial data to Government, commercial, academic, and public users. Those users can get worldwide access to Landsat satellite data through the National Land Imaging Program-funded USGS Earth Resources Observation and Science (EROS) Center.
Landsat—Critical Information Infrastructure for the Nation
Landsat is the most widely used land remote sensing data source within Federal civilian agencies. Local, State, Tribal, and Federal agencies use Landsat to monitor and forecast a wide range of land surface phenomena. Information from Landsat contributes to day-to-day decisions on land, water, and resource use that protect life and property; safeguard the environment; advance science, technology, and education; support climate change resiliency; and grow the U.S. economy. Landsat’s imagery provides a landscape-level view of land surface, inland lake, and coastal processes, both natural and human-induced. Landsat enables us to better understand the scope, nature, and speed of change to the natural and built environment.
Businesses draw upon Landsat data to provide customer-specific applications to improve logistics, resource allocation, and investment decisions. Commercial space imaging firms leverage Landsat data to refine product offerings and support new information services. A 2017 USGS study determined the total annual economic benefit of Landsat data in the United States. to be $2.06 billion, far surpassing its development and operating costs (Straub and others, 2019).
Landsat 8 and Landsat 9 provide 8-day repeat coverage of the Earth’s land surfaces. The National Aeronautics and Space Administration (NASA) and the USGS are currently reviewing the findings from a joint Architecture Study Team, which will inform the design and implementation approach for Landsat Next, the follow-on mission to Landsat 9. Landsat 9 and its successors are planned to provide a sustainable, space-based system to extend the 50-year Landsat series of high-quality global land imaging measurements—the world’s longest time series of the Earth’s land surface.
The long-term availability of consistent and accurate Landsat data, combined with a no-cost data policy, allows users to analyze extensive geographic areas and better understand and manage long-term trends in land surface change. New cloud computing and data analytics technologies use Landsat data in a wide range of decision-support tools for Government and industry. Much like global positioning systems and weather data, Landsat data are used every day to help us better understand our dynamic planet.
References Cited
Douglas, S.H., Bernier, J.C., and Smith, K.E.L., 2018, Analysis of multi-decadal wetland changes, and cumulative impact of multiple storms 1984 to 2017: Wetlands Ecology and Management, v. 26, p. 11211142.[ [Also available at https://doi.org/10.1007/s11273-018-9635-6.]
Marder, J., 2020, Beating back the tides: National Aeronautics and Space Administration web page, accessed April 2021 at https://www.nasa.gov/feature/esnt/2020/beating-back-the-tides.
Straub, C.L., Koontz, S.R., and Loomis, J.B., 2019, Economic valuation of Landsat imagery: U.S. Geological Survey Open-File Report 2019–1112, 13 p. [Also available at https://doi.org/10.3133/ofr20191112.]
U.S. Geological Survey, [USGS], 2017, Mapping Chesapeake’s future from today’s land use: U.S. Geological Survey web page, accessed April 2021 at https://www.usgs.gov/news/featured-story/mapping-chesapeakes-future-todays-land-use.
Voiland, A., 2017, Satellites eye winter cover crops: National Aeronautics and Space Administration Earth Observatory web page, accessed April 2021 at https://earthobservatory.nasa.gov/images/90095/satellites-eye-winter-cover-crops.
For additional information on Landsat, please contact:
Program Coordinator
USGS National Land Imaging Program
12201 Sunrise Valley Drive
Reston, VA 20192
703–648–4567
The Landsat series is a joint effort of USGS and NASA. NASA develops and launches the spacecraft; USGS manages satellite operations, ground reception, data archiving, product generation, and data distribution. Funding for the National Land Imaging Program’s Landsat operations and data management is provided through the USGS.
Disclaimers
Any use of trade, firm, or product names is for descriptive purposes only and does not imply endorsement by the U.S. Government.
Although this information product, for the most part, is in the public domain, it also may contain copyrighted materials as noted in the text. Permission to reproduce copyrighted items must be secured from the copyright owner.
Suggested Citation
U.S. Geological Survey, 2021, Maryland and Landsat (ver. 1.1, January 2023): U.S. Geological Survey Fact Sheet 2021–3022, 2 p., https://doi.org/10.3133/fs20213022.
ISSN: 2327-6932 (online)
ISSN: 2327-6916 (print)
Study Area
| Publication type | Report |
|---|---|
| Publication Subtype | USGS Numbered Series |
| Title | Maryland and Landsat |
| Series title | Fact Sheet |
| Series number | 2021-3022 |
| DOI | 10.3133/fs20213022 |
| Edition | Version 1.0: April 26, 2021; Version 1.1: January 18, 2023 |
| Publication Date | April 26, 2021 |
| Year Published | 2021 |
| Language | English |
| Publisher | U.S. Geological Survey |
| Publisher location | Reston, VA |
| Contributing office(s) | Earth Resources Observation and Science (EROS) Center |
| Description | 2 p. |
| Country | United States |
| State | Maryland |
| Online Only (Y/N) | N |