California and Landsat
Links
- Document: Report (3.14 MB pdf) , HTML , XML
- Version History: Version History (4.01 kB txt)
- Download citation as: RIS | Dublin Core
Abstract
California has remarkable geographic diversity, from 1,100 miles of Pacific shoreline to 33 million acres of trees, including its famous redwood forests along the Pacific Coast Highway, U.S. Route 101. And although California’s nickname is “The Golden State,” it may also deserve the title of “The Extreme State.” Mount Whitney, the highest peak in the conterminous United States, stands at 14,494 feet above sea level in the Sierra Nevada mountain range. Just 2.5 hours away by car, Death Valley’s Badwater Basin boasts the lowest point in the United States: 282 feet below sea level. Although hundreds of inches of snow fall on Mount Whitney each year, the rainfall in Death Valley, commonly called the hottest place on Earth, average less than 2 inches.
California is the most populous U.S. State with 39 million residents, 26 million of whom live near the coast. It’s also the most agriculturally productive State, raising a variety of fruits, vegetables, nuts, grains, grasses, and flowers in addition to dairy and livestock. Although climate change affects many of these people, production, and places, Landsat can help agencies and residents monitor their landscapes and plan for a resilient future.
Here are just a few examples of how Landsat benefits California.
Watching Where the Water Goes
With growing populations, a higher demand for agriculture, and increasing temperatures caused by climate change, fresh water is a precious and highly regulated commodity in California’s cities and countryside, and agricultural use consumes nearly 80 percent of the State’s water supply. Periodic droughts emphasize competition for the limited resource and illustrate the need to develop solutions to shortages. Landsat has been instrumental in creating tools for measuring irrigation water use through evapotranspiration (ET), or the movement of water into the atmosphere via evaporation and plant transpiration. An ET toolkit that resulted from the partnership of the National Aeronautics and Space Administration (NASA), the U.S. Department of Agriculture (USDA), Utah State University, and the E&J Gallo Winery in California’s Central Valley is just one example. Landsat has been key to that effort, which helps the winery make timely decisions about grape irrigation schedules and helps save water and money (NASA, 2020).

USDA Agricultural Research Service (ARS) scientists developed computer models that use satellite data to map grapevine water use and stress and are collaborating with E&J Gallo Winery. Photograph credit: Jessica Griffiths, USDA ARS; used with permission.
Revealing More About Wildfires
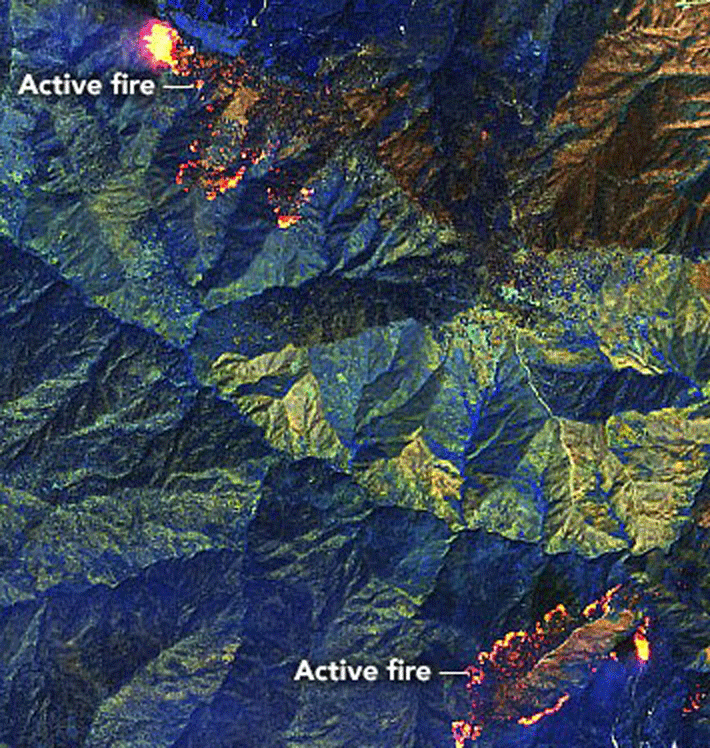
Fires in the western United States have been increasing in size. The August Complex fire in 2020—which burned more than 1 million acres in Glenn, Lake, Mendocino, Tehama, Trinity, and Shasta Counties of northern California—was by far the largest California fire in modern recordkeeping history. Although Landsat can capture an image of wildfires burning, its data provide far more than pictures. Landsat data are used by the USDA Forest Service and the USGS EROS Center to map burn severity, or the degree to which a fire has changed an area. This information is folded into programs such as the multi-agency partnership LANDFIRE, which maps vegetation type using Landsat, building layers of geographic information system (GIS) data used by a range of State and Federal fire agencies, land managers, and scientists to better understand the ecological makeup of the landscape. Another multi-agency partnership, Burned Area Emergency Response, uses the burn severity information to help identify and address threats that could arise after a fire, such as landslides or flooding (Monitoring Trends in Burn Severity, 2021).

The August Complex Fire in California started August 17, 2020, took nearly 3 months to contain and burned more than 1 million acres. This Landsat image acquired September 1, 2020, reveals the intensity of the northern part of the fire via shortwave and near-infrared data. The hottest parts of the fire appear yellow; previously burned areas are dark brown. Image credit: NASA; used with permission.
Classifying Vegetation for More Than 40 Years
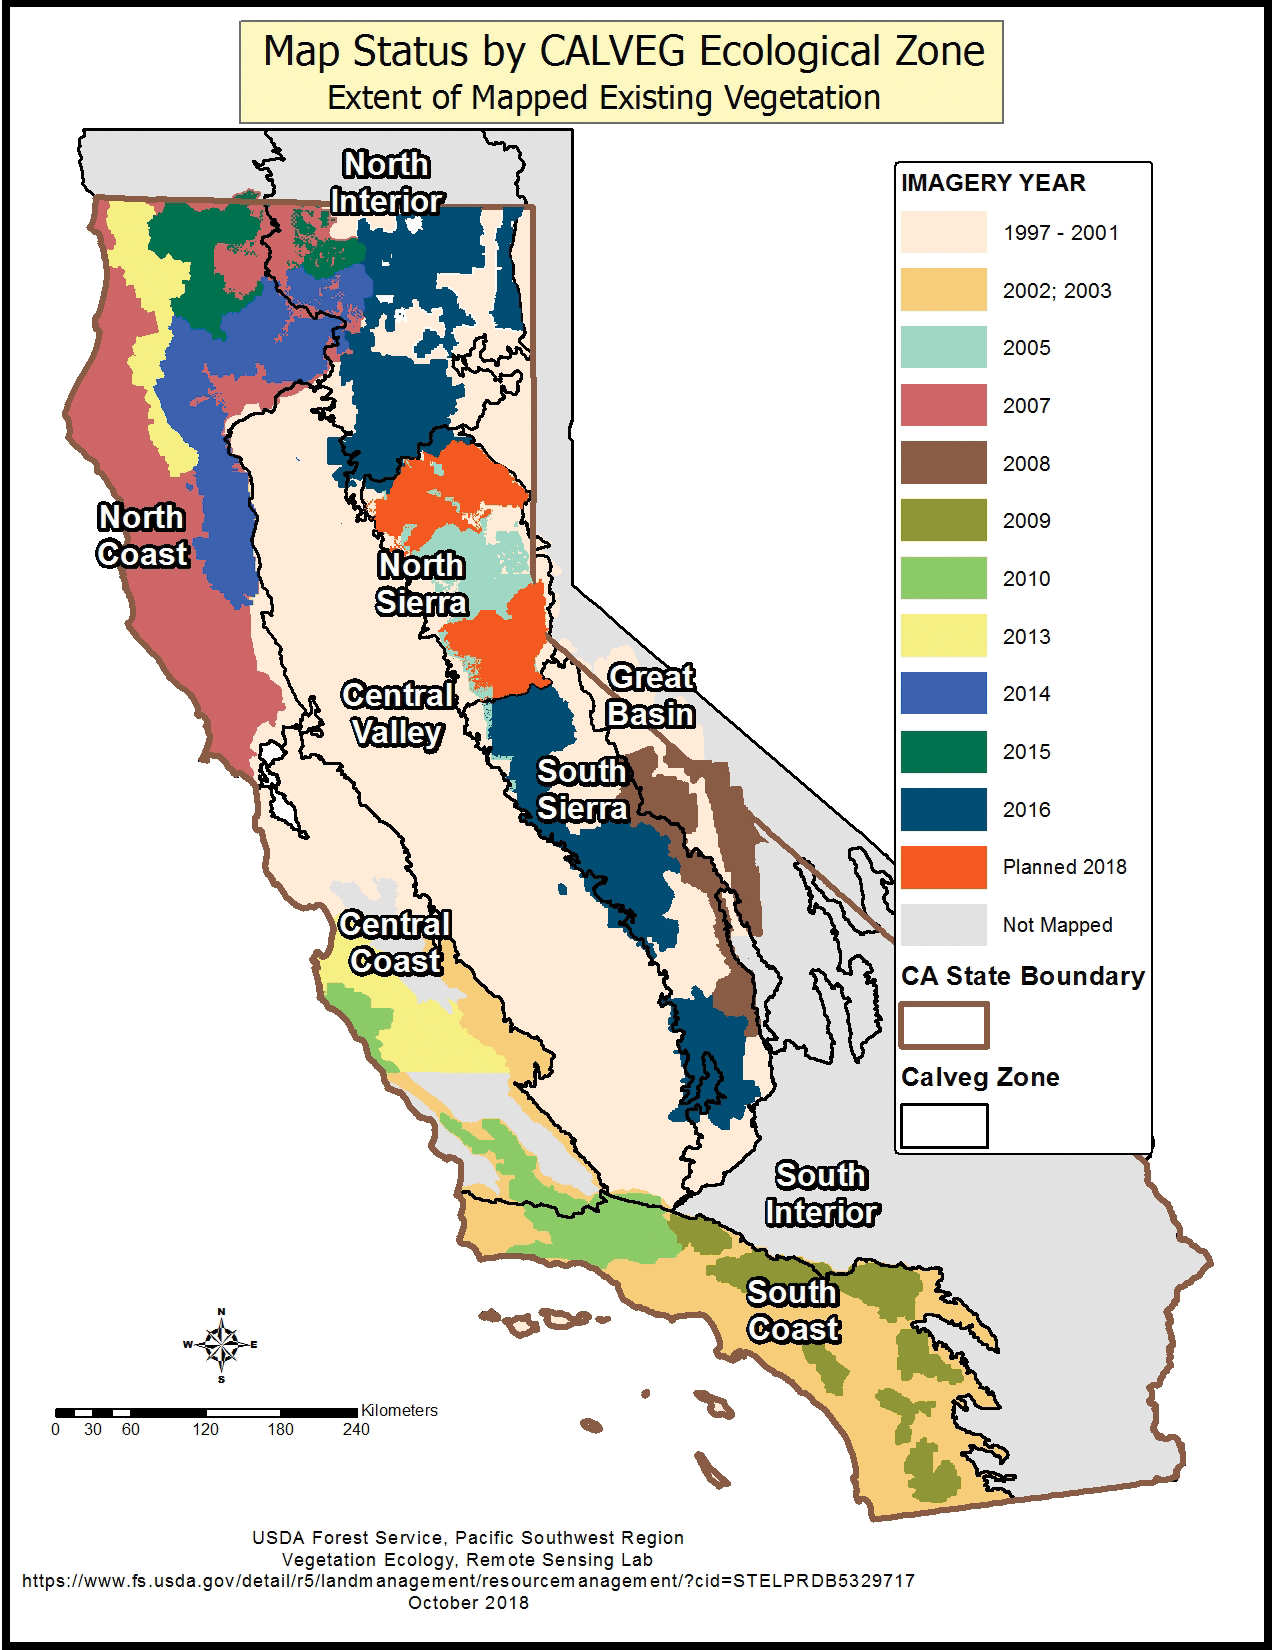
The USDA Forest Service has used Landsat data since 1978 in its Classification and Assessment with Landsat of Visible Ecological Groupings (CALVEG) to classify vegetation and help with resource planning in California. More than 200 types of vegetation communities are identified in 9 regions of the State (USDA Forest Service, 2021).

This picture shows the extent of vegetation mapping in California’s ecological mapping zones. Vegetation mapping has been completed for all national forest lands in California, and this map indicates where and when mapping has been completed for all land ownerships within the zones. Image credit: USDA Forest Service; used with permission.
National Land Imaging Program Benefits—California
The U.S. Geological Survey (USGS) National Land Imaging Program provides a wide range of satellite imagery and other remotely sensed and geospatial data to Government, commercial, academic, and public users. Those users can get worldwide access to Landsat satellite data through the National Land Imaging Program-funded USGS Earth Resources Observation and Science (EROS) Center.
Landsat—Critical Information Infrastructure for the Nation
Landsat is the most widely used land remote sensing data source within Federal civilian agencies. Local, State, Tribal, and Federal agencies use Landsat to monitor and forecast a wide range of land surface phenomena. Information from Landsat contributes to day-to-day decisions on land, water, and resource use that protect life and property; safeguard the environment; advance science, technology, and education; support climate change resiliency; and grow the U.S. economy. Landsat’s imagery provides a landscape-level view of land surface, inland lake, and coastal processes, both natural and human-induced. Landsat enables us to better understand the scope, nature, and speed of change to the natural and built environment.
Businesses draw upon Landsat data to provide customer-specific applications to improve logistics, resource allocation, and investment decisions. Commercial space imaging firms leverage Landsat data to refine product offerings and support new information services. A 2017 USGS study determined the total annual economic benefit of Landsat data in the United States. to be $2.06 billion, far surpassing its development and operating costs (Straub and others, 2019).
Landsat 8 and Landsat 9 provide 8-day repeat coverage of the Earth’s land surfaces. The National Aeronautics and Space Administration (NASA) and the USGS are currently reviewing the findings from a joint Architecture Study Team, which will inform the design and implementation approach for Landsat Next, the follow-on mission to Landsat 9. Landsat 9 and its successors are planned to provide a sustainable, space-based system to extend the 50-year Landsat series of high-quality global land imaging measurements—the world’s longest time series of the Earth’s land surface.
The long-term availability of consistent and accurate Landsat data, combined with a no-cost data policy, allows users to analyze extensive geographic areas and better understand and manage long-term trends in land surface change. New cloud computing and data analytics technologies use Landsat data in a wide range of decision-support tools for Government and industry. Much like global positioning systems and weather data, Landsat data are used every day to help us better understand our dynamic planet.
References Cited
Monitoring Trends in Burn Severity, 2021, Frequently asked questions (FAQ): Monitoring Trends in Burn Severity web page, accessed April 23, 2021, https://www.mtbs.gov/faqs.
National Aeronautics and Space Administration [NASA], 2020, Raising a glass in wine country to better water management: National Aeronautics and Space Administration web page, April 8, 2020, accessed April 22, 2021, at https://www.nasa.gov/feature/raising-a-glass-in-wine-country-to-better-water-management.
Straub, C.L., Koontz, S.R., and Loomis, J.B., 2019, Economic valuation of Landsat imagery: U.S. Geological Survey Open-File Report 20191112, 13 p., accessed April 23, 2021, at https://pubs.er.usgs.gov/publication/ofr20191112.
U.S. Department of Agriculture [USDA] Forest Service, 2021, CALVEG System: U.S. Department of Agriculture Forest Service, Pacific Southwest Region web page, accessed April 23, 2021, at https://www.fs.usda.gov/detail/r5/landmanagement/resourcemanagement/?cid=fsbdev3_046815.
For additional information on Landsat, please contact:
Program Coordinator
USGS National Land Imaging Program
12201 Sunrise Valley Drive
Reston, VA 20192
703–648–4567
The Landsat series is a joint effort of USGS and NASA. NASA develops and launches the spacecraft; USGS manages satellite operations, ground reception, data archiving, product generation, and data distribution. Funding for the National Land Imaging Program’s Landsat operations and data management is provided through the USGS.
Disclaimers
Any use of trade, firm, or product names is for descriptive purposes only and does not imply endorsement by the U.S. Government.
Although this information product, for the most part, is in the public domain, it also may contain copyrighted materials as noted in the text. Permission to reproduce copyrighted items must be secured from the copyright owner.
Suggested Citation
U.S. Geological Survey, 2021, California and Landsat (ver. 1.1, January 2023): U.S. Geological Survey Fact Sheet 2021–3034, 2 p., https://doi.org/10.3133/fs20213034.
ISSN: 2327-6932 (online)
ISSN: 2327-6916 (print)
Study Area
| Publication type | Report |
|---|---|
| Publication Subtype | USGS Numbered Series |
| Title | California and Landsat |
| Series title | Fact Sheet |
| Series number | 2021-3034 |
| DOI | 10.3133/fs20213034 |
| Edition | Version 1.0: June 16, 2021; Version 1.1: January 30, 2023 |
| Publication Date | June 16, 2021 |
| Year Published | 2021 |
| Language | English |
| Publisher | U.S. Geological Survey |
| Publisher location | Reston, VA |
| Contributing office(s) | Earth Resources Observation and Science (EROS) Center |
| Description | 2 p. |
| Country | United States |
| State | California |
| Online Only (Y/N) | N |


