

Arizona and Landsat
Links
- Document: Report (2.87 MB pdf) , HTML , XML
- Version History: Version History (3.91 kB txt)
- Download citation as: RIS | Dublin Core
Abstract
Arizona is a land of massive grandeur, deep gorges, lofty mountains, immense plains, and elevated mesas—and, without question, its crown jewel is the Grand Canyon. The spectacular canyon, one of the seven natural wonders of the world, was created when the Colorado River carved a channel through northern Arizona, revealing nearly two billion years of the Earth’s history (National Park Service, 2019).
Yet, for all its ancient beauty, Arizona and its landscapes are experiencing a transformation.
Arizonans face more extreme temperatures and drought because of climate change. Amid a drought in the western United States, Lake Mead, one of Arizona’s main water resources, dropped to a record low level in June 2021. Climate change is making extreme weather events such as dust storms and heat waves more common, posing higher risks to human health, according to the Centers for Disease Control and Prevention.
Here are three critical areas where Landsat satellite systems can be valuable tools in monitoring related environmental changes and their effects in Arizona, where the Landsat 8 and Landsat 9 satellites were built.
Water Usage
In the past couple of decades, climate change and increasing water use by a growing population have helped push system reservoirs in the Colorado River Basin to critically low levels. A 2019 law enables the Interior Secretary, through the Bureau of Reclamation, to oversee a seven-State basin-wide agreement, the Colorado River Drought Contingency Plan, that will reduce regional water usage through 2026 to protect levels of the Colorado River’s two largest reservoirs, Lake Powell and Lake Mead. In the Lower Colorado River Basin, which includes most of Arizona, Landsat is being used to model water consumption as measured by water evaporating from the soil or transpiring by plants. That model should provide valuable information about the Colorado River’s lower basin tributaries, where as much as 70 percent of water use is for irrigation. The Landsat archive can also offer consistent, historical assessments to water use on a field-by-field basis for the past 40 years (U.S. Geological Survey, 2019).
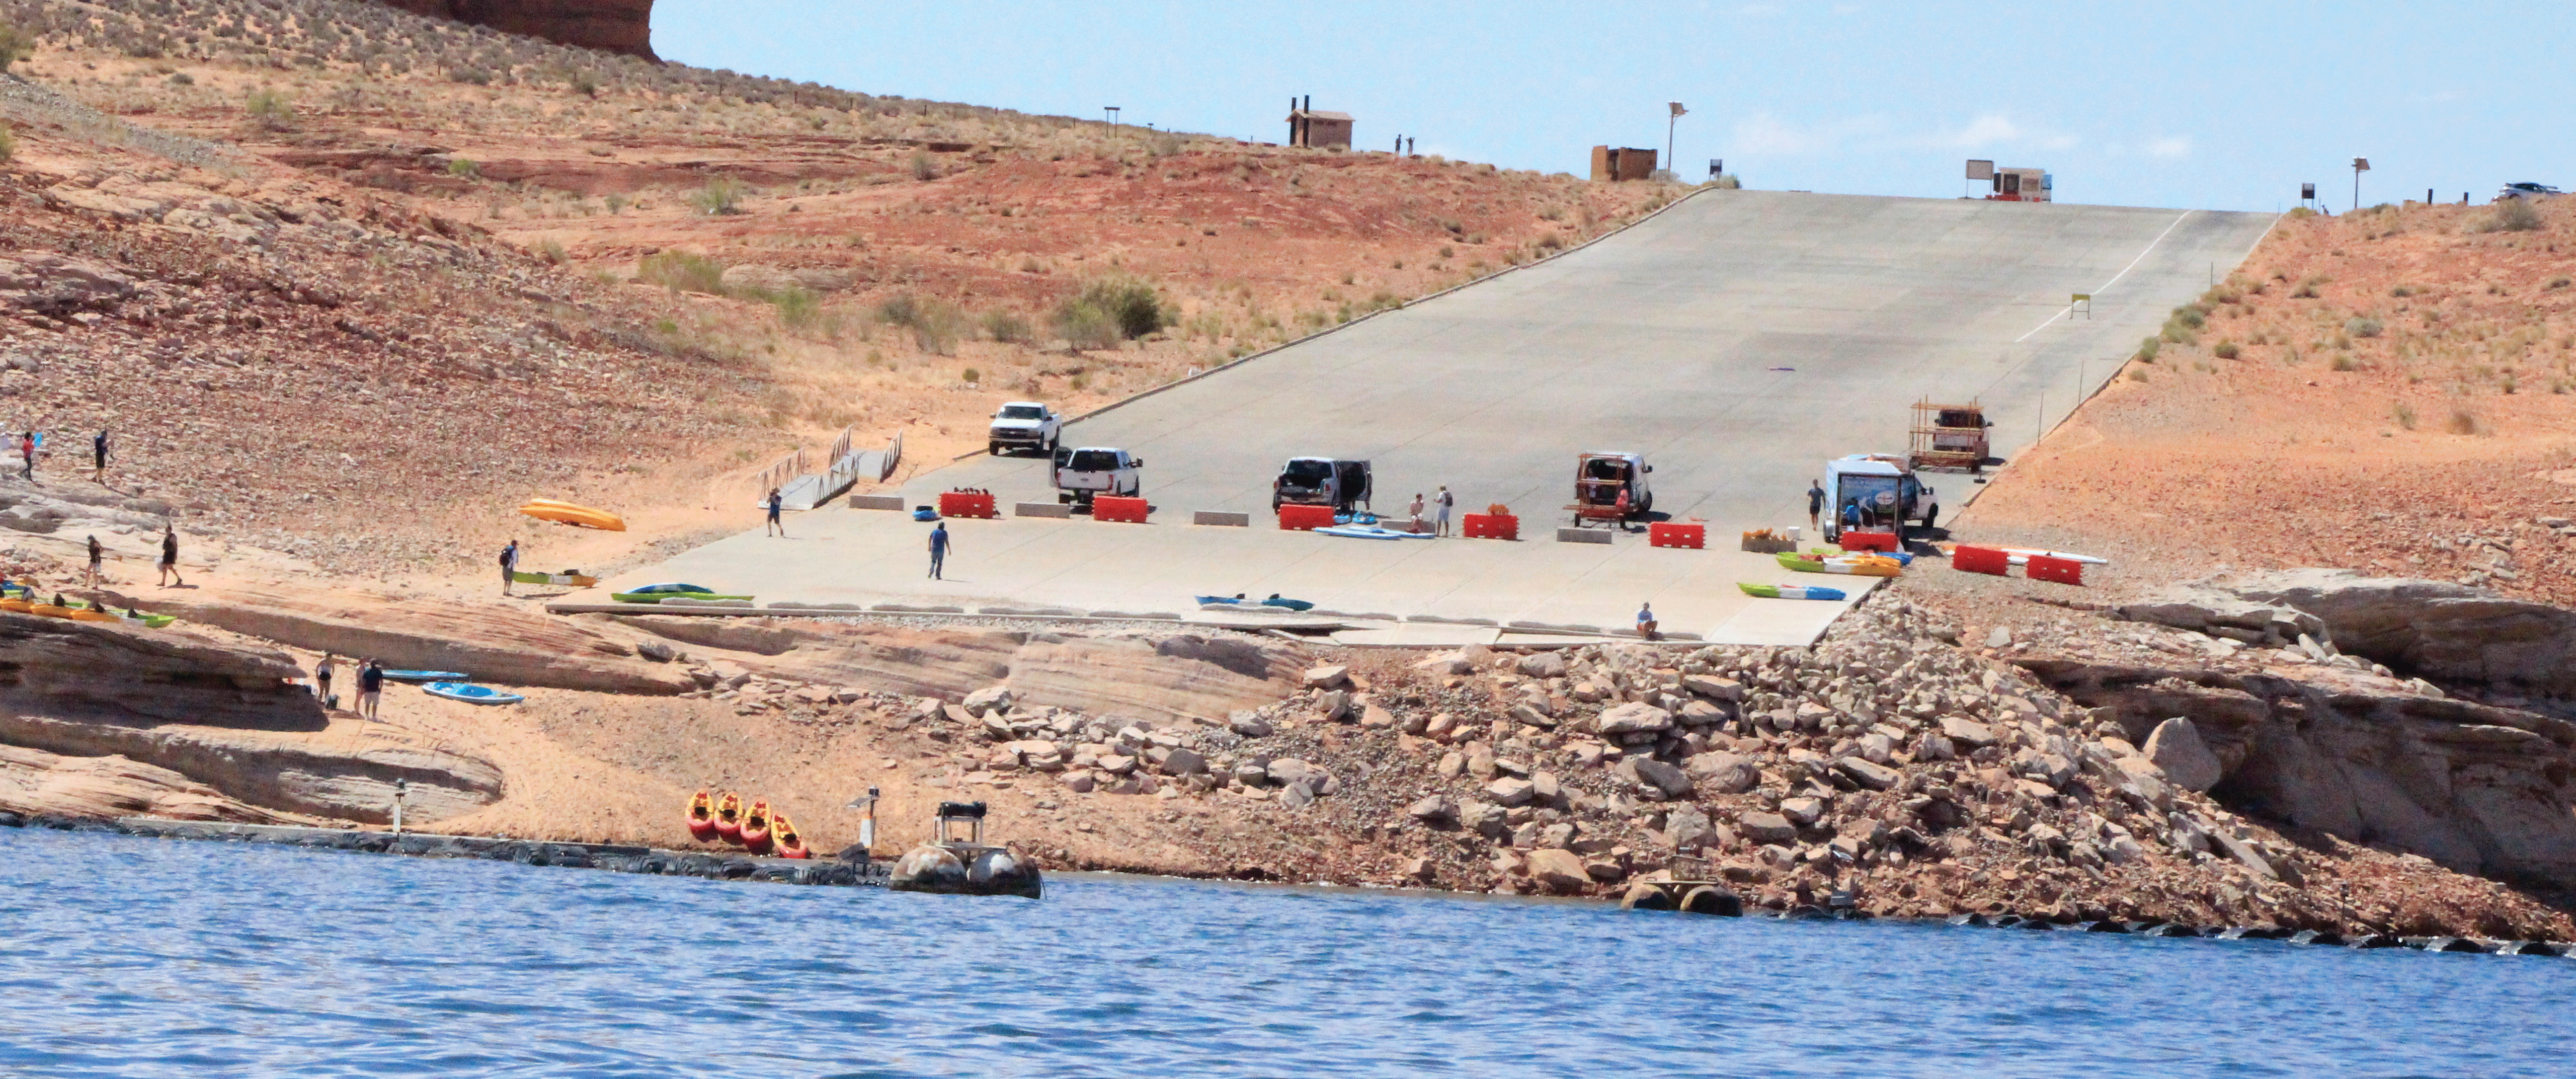
The Antelope Point public launch ramp in Arizona, shown here in June 2021, is closed to motorized vessels because of the low water level on Lake Powell, but kayakers can still use the ramp. Photograph credit: National Park Service.
Fire Modeling
Current and historical Normalized Difference Vegetation Index (NDVI) data from the Landsat archive are used to analyze vegetation greenness and identify where potential fire fuels exist in Arizona. That information can help fire modelers better understand where a fire is likely to go, how hot it is going to be, how fast it is going to move, and where firefighters should be deployed (LANDFIRE, 2021).
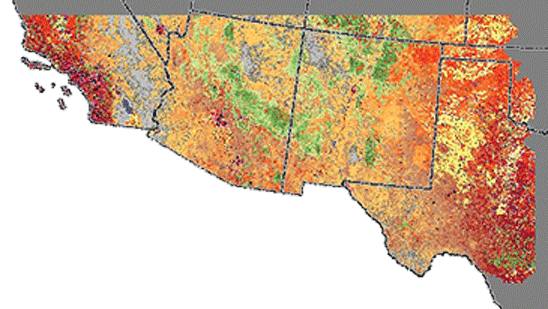
In-season condition of annual grasses in the U.S. Southwest for fall 2020, including Arizona, was created by using Landsat data as part of LANDFIRE’s Modeling Dynamic Fuels with an Index System (MoD-FIS). These updates are particularly helpful in informing a strategy on how to deal with fire incidents. Image credit: LANDFIRE.
Urban Sprawl
Phoenix is one of the warmest cities in the United States. Excessive heat in the urban area has been a major concern for decades, compromising human health and comfort, causing water and energy consumption challenges, and creating poor air quality. As metropolitan Phoenix continues to grow, surface and air temperatures continue to increase. Landsat data can show urban planners and city managers how incorporating vegetation, such as trees, grass, and shrubs, can lower temperatures in those growth areas and lower water consumption (Xian and Shi, 2019).
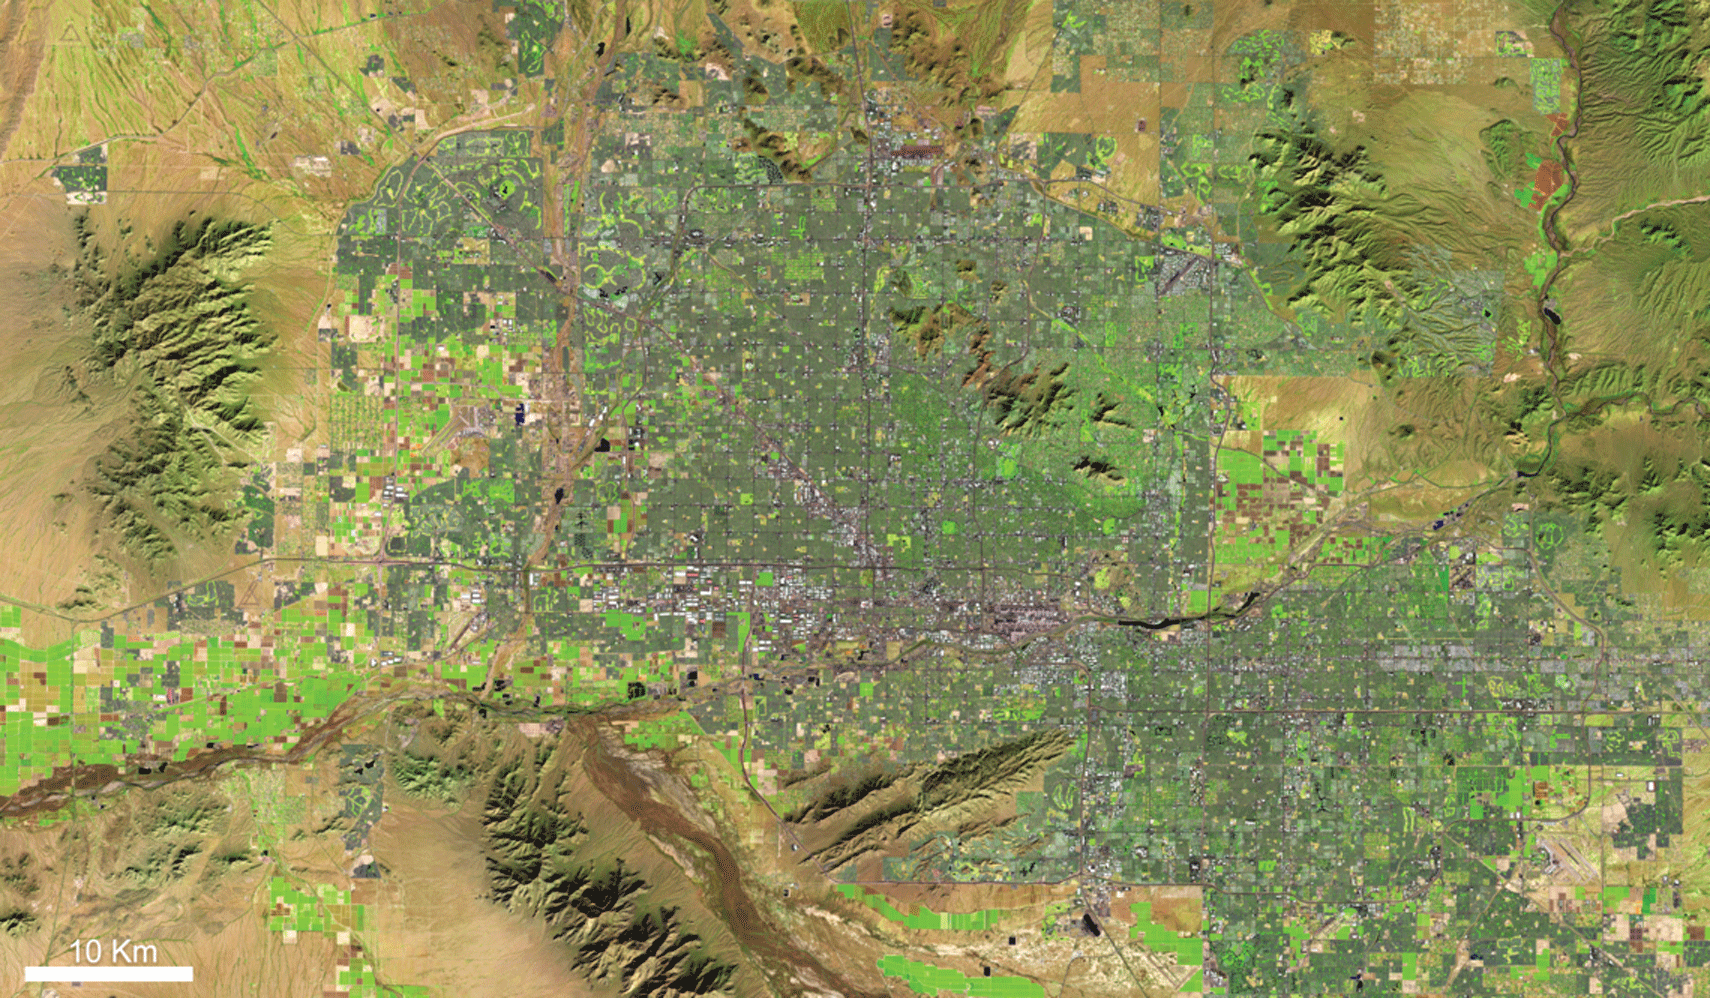
Landsat 8 image of Phoenix, Arizona, acquired on January 13, 2020. As Phoenix continues to grow, Landsat data can show planners and managers how incorporating trees, grass, and shrubs can lower temperatures and water consumption in these growth areas.
National Land Imaging Program Benefits—Arizona
The U.S. Geological Survey (USGS) National Land Imaging Program provides a wide range of satellite imagery and other remotely sensed and geospatial data to Government, commercial, academic, and public users. Those users can get worldwide access to Landsat satellite data through the National Land Imaging Program-funded USGS Earth Resources Observation and Science (EROS) Center.
Landsat—Critical Information Infrastructure for the Nation
Landsat is the most widely used land remote sensing data source within Federal civilian agencies. Local, State, Tribal, and Federal agencies use Landsat to monitor and forecast a wide range of land surface phenomena. Information from Landsat contributes to day-to-day decisions on land, water, and resource use that protect life and property; safeguard the environment; advance science, technology, and education; support climate change resiliency; and grow the U.S. economy. Landsat’s imagery provides a landscape-level view of land surface, inland lake, and coastal processes, both natural and human-induced. Landsat enables us to better understand the scope, nature, and speed of change to the natural and built environment.
Businesses draw upon Landsat data to provide customer-specific applications to improve logistics, resource allocation, and investment decisions. Commercial space imaging firms leverage Landsat data to refine product offerings and support new information services. A 2017 USGS study determined the total annual economic benefit of Landsat data in the United States. to be $2.06 billion, far surpassing its development and operating costs (Straub and others, 2019).
Landsat 8 and Landsat 9 provide 8-day repeat coverage of the Earth’s land surfaces. The National Aeronautics and Space Administration (NASA) and the USGS are currently reviewing the findings from a joint Architecture Study Team, which will inform the design and implementation approach for Landsat Next, the follow-on mission to Landsat 9. Landsat 9 and its successors are planned to provide a sustainable, space-based system to extend the 50-year Landsat series of high-quality global land imaging measurements—the world’s longest time series of the Earth’s land surface.
The long-term availability of consistent and accurate Landsat data, combined with a no-cost data policy, allows users to analyze extensive geographic areas and better understand and manage long-term trends in land surface change. New cloud computing and data analytics technologies use Landsat data in a wide range of decision-support tools for Government and industry. Much like global positioning systems and weather data, Landsat data are used every day to help us better understand our dynamic planet.
References Cited
LANDFIRE, 2021, Modeling dynamic fuels with an index system (MoD-FIS) for the Great Basin and Southwest United States: LANDFIRE web page, accessed June 14, 2021, at https://landfire.gov/modfis.php
National Park Service, 2019, Grand Canyon—Geologic formations: National Park Service web page, accessed June 21, 2021, at https://www.nps.gov/grca/learn/nature/geologicformations.htm
Straub, C.L., Koontz, S.R., and Loomis, J.B., 2019, Economic valuation and Landsat imagery: U.S. Geological Survey Open-File Report 2019–1112, 13 p., accessed April 23, 2021, at https://doi.org/10.3133/ofr20191112.
U.S. Geological Survey, 2019, Water consumption work at EROS important asset to Colorado River concerns: USGS web page, accessed June 14, 2021, at https://www.usgs.gov/center-news/water-consumption-work-eros-important-asset-colorado-river-concerns?qt-news_science_products=1#qt-news_science_produc ts
Xian, G.Z., and Shi, H., 2019, Land surface thermal feature change monitoring in urban and urban wild interface (ver. 3,0, June 2021): U.S. Geological Survey data release, accessed July 8, 2021, at https://doi.org/10.5066/P9H6E1FZ.
For additional information on Landsat, please contact:
Program Coordinator
USGS National Land Imaging Program
12201 Sunrise Valley Drive
Reston, VA 20192
703–648–4567
The Landsat series is a joint effort of USGS and NASA. NASA develops and launches the spacecraft; USGS manages satellite operations, ground reception, data archiving, product generation, and data distribution. Funding for the National Land Imaging Program’s Landsat operations and data management is provided through the USGS.
Disclaimers
Any use of trade, firm, or product names is for descriptive purposes only and does not imply endorsement by the U.S. Government.
Although this information product, for the most part, is in the public domain, it also may contain copyrighted materials as noted in the text. Permission to reproduce copyrighted items must be secured from the copyright owner.
Suggested Citation
U.S. Geological Survey, 2021, Arizona and Landsat (ver. 1.1, January 2023): U.S. Geological Survey Fact Sheet 2021–3039, 2 p., https://doi.org/10.3133/fs20213039.
ISSN: 2327-6932 (online)
ISSN: 2327-6916 (print)
Study Area
| Publication type | Report |
|---|---|
| Publication Subtype | USGS Numbered Series |
| Title | Arizona and Landsat |
| Series title | Fact Sheet |
| Series number | 2021-3039 |
| DOI | 10.3133/fs20213039 |
| Edition | Version 1.0: July 13, 2021; Version 1.1: January 23, 2023 |
| Publication Date | July 13, 2021 |
| Year Published | 2021 |
| Language | English |
| Publisher | U.S. Geological Survey |
| Publisher location | Reston, VA |
| Contributing office(s) | Earth Resources Observation and Science (EROS) Center |
| Description | 2 p. |
| Country | United States |
| State | Arizona |
| Online Only (Y/N) | N |