

Illinois and Landsat
Links
- Document: Report (3.10 MB pdf) , HTML , XML
- Version History: Version History (2 kB txt)
- Download citation as: RIS | Dublin Core
Abstract
Illinois is home to more than 12 million residents, including those living in Chicago, the third-largest city in the United States. Yet farmland claims about 75 percent of the largely flat terrain in Illinois. Tallgrass prairie once covered “The Prairie State,” and some remnants remain, but corn and soybeans are a far more common sight now. Adding variety to the landscape, beaches line the State’s Lake Michigan shoreline in the northeast, and more than 80,000 miles of rivers and streams flow along and through the State, including the central cities of Springfield and Peoria. Forests fill several million acres, mostly in the west and the rolling hills of the south.
Urban, agricultural, and forested areas each have environmental characteristics that are noticeable to those who live within them and to those who study the Earth’s surface from space. Landsat satellite data can reveal not only the current condition of these areas, but also when and where they have changed. A better knowledge of Illinois’ past helps its residents better prepare for the future.
Here are just a few examples of how Landsat benefits Illinois.
Keeping an Eye on Cropland
In Illinois, 89 percent of the farmland is considered “prime,” a U.S. Department of Agriculture (USDA) classification for land that has the best combination of crop-growing characteristics (Illinois Department of Agriculture, 2021). Beginning with the first Landsat launch, a key goal for agriculturalists has been to monitor crop production. Landsat data are included in the annual USDA Cropland Data Layer showing crop-specific land cover nationwide. This data layer reveals what is being planted, how much, and where, as well as where the land has changed in use. The Illinois Department of Agriculture has long relied on land cover data from Landsat to provide information for decision making and stewardship, including a Landscape Classification Project partnership with the USDA and the Illinois Department of Natural Resources (Illinois Geospatial Data Clearinghouse, 2021).
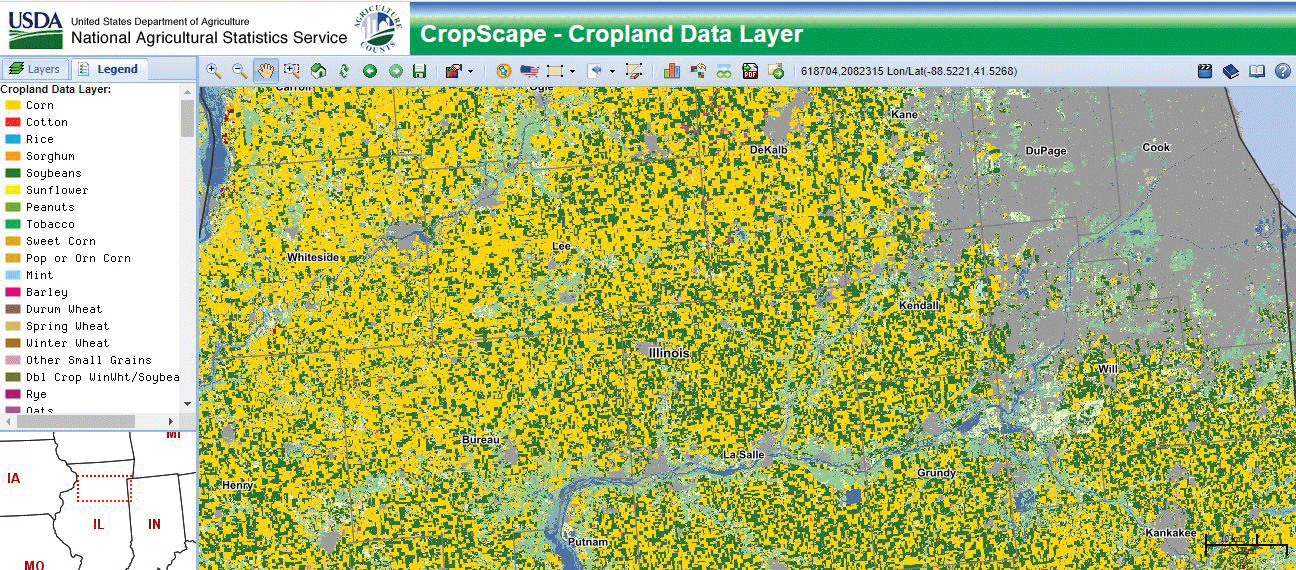
This map shows the 2020 Cropland Data Layer for part of northern Illinois. The gold color indicates cornfields, dark green indicates soybeans, and dark gray represents developed areas. Cook, DuPage, and Will Counties are included in the Chicago metropolitan area. Areas of medium green depict forests; light green is grassland. Image credit: U.S. Department of Agriculture.
Keeping an Eye on Urban Areas
You can get a hint of urban development by taking a drive through any new subdivision. However, Landsat can provide a more complete picture of where and how much agricultural land and urban open space has been lost over time. Chicago State University researchers conducted a study of northeastern Illinois to not only see where urban sprawl had occurred, but also to model where it likely would occur through 2030 based on patterns of the past (Friehat and others, 2015). Landsat can also help pinpoint which areas in a city are urban heat islands, or areas with more impervious surfaces and fewer natural features, where daytime and nighttime temperatures exceed surrounding areas. Urban heat islands can place residents at higher risk for heat-related illnesses or deaths. Technology organizations partnered recently with the city of Chicago to assess the effects of various urban heat interventions over time at specific sites using the Landsat archive (Letavish and Vecchetti, 2020).

The urban Chicago area has been expanding into surrounding Illinois farmland areas. Photograph credit: Eileen Hornbaker, U.S. Fish and Wildlife Service.
Informing About Disasters
Satellite images can give a more complete view of natural disasters, from flooding and fires to the path of destruction left by a tornado. This can help with response efforts and with preparedness for future events. After an EF-4 tornado tore a 30-mile path through north-central Illinois in April 2015, a Landsat 8 image from the next morning captured the path and helped evaluate the resulting damage (National Aeronautics and Space Administration, 2015).
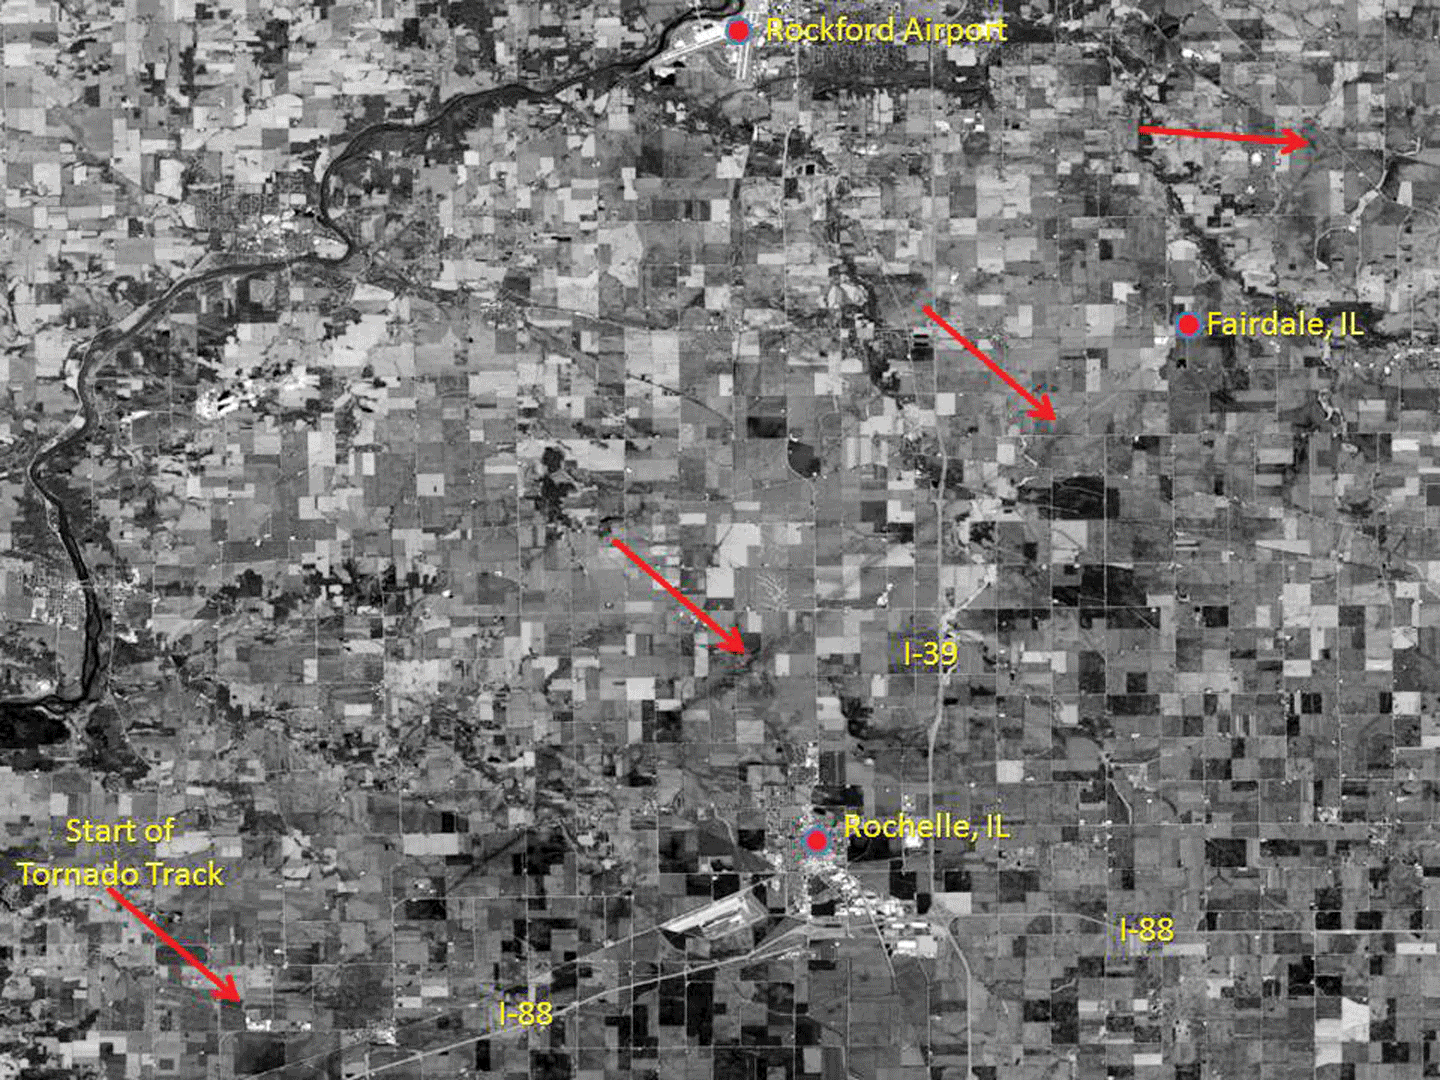
This labeled Landsat 8 image, acquired April 10, 2015, shows the EF-4 tornado track northwest of Rochelle, Illinois. Image credit: National Weather Service.
National Land Imaging Program Benefits—Illinois
The U.S. Geological Survey (USGS) National Land Imaging Program provides a wide range of satellite imagery and other remotely sensed and geospatial data to Government, commercial, academic, and public users. Those users can get worldwide access to Landsat satellite data through the National Land Imaging Program-funded USGS Earth Resources Observation and Science (EROS) Center.
Landsat—Critical Information Infrastructure for the Nation
Landsat is the most widely used land remote sensing data source within Federal civilian agencies. Local, State, Tribal, and Federal agencies use Landsat to monitor and forecast a wide range of land surface phenomena. Information from Landsat contributes to day-to-day decisions on land, water, and resource use that protect life and property; safeguard the environment; advance science, technology, and education; support climate change resiliency; and grow the U.S. economy. Landsat’s imagery provides a landscape-level view of land surface, inland lake, and coastal processes, both natural and human-induced. Landsat enables us to better understand the scope, nature, and speed of change to the natural and built environment.
Businesses draw upon Landsat data to provide customer-specific applications to improve logistics, resource allocation, and investment decisions. Commercial space imaging firms leverage Landsat data to refine product offerings and support new information services. A 2017 USGS study determined the total annual economic benefit of Landsat data in the United States. to be $2.06 billion, far surpassing its development and operating costs (Straub and others, 2019).
Landsat 8 and Landsat 9 provide 8-day repeat coverage of the Earth’s land surfaces. The National Aeronautics and Space Administration (NASA) and the USGS are currently reviewing the findings from a joint Architecture Study Team, which will inform the design and implementation approach for Landsat Next, the follow-on mission to Landsat 9. Landsat 9 and its successors are planned to provide a sustainable, space-based system to extend the 50-year Landsat series of high-quality global land imaging measurements—the world’s longest time series of the Earth’s land surface.
The long-term availability of consistent and accurate Landsat data, combined with a no-cost data policy, allows users to analyze extensive geographic areas and better understand and manage long-term trends in land surface change. New cloud computing and data analytics technologies use Landsat data in a wide range of decision-support tools for Government and industry. Much like global positioning systems and weather data, Landsat data are used every day to help us better understand our dynamic planet.
References Cited
Friehat, T., Mulugeta, G., and Gala, T.S., 2015, Modeling urban sprawls in northeastern Illinois: Journal of Geosciences, November 15, accessed September 1, 2021, at https://www.researchgate.net/publication/283516440_Modeling_Urban_Sprawls_in_Northeastern_Illinois.
Illinois Department of Agriculture, 2021, Facts about Illinois agriculture: Illinois Department of Agriculture web page, 2021, accessed September 1, 2021, at https://www2.illinois.gov/sites/agr/About/Pages/Facts-About-Illinois-Agriculture.aspx.
Illinois Geospatial Data Clearinghouse, 2021, Land cover of Illinois 1999–2000 data: Illinois Geospatial Data Clearinghouse web page, accessed January 5, 2022, at https://clearinghouse.isgs.illinois.edu/data/land-cover/land-cover-illinois-1999-2000-data.
Letavish, G., and Vecchetti, L., 2020, City Tech and partners use NASA environmental data to evaluate urban heat interventions: City Tech Collaborative web page, July 10, 2020, accessed September 1, 2021, at https://www.citytech.org/city-tech-and-partners-use-nasa-environmental-data-to-evaluate-urban-heat-interventions.
National Aeronautics and Space Administration, 2015, NASA’s SPoRT Disaster Response Team provides Landsat imagery for Illinois tornadoes: NASA Landsat Science web page, April 15, 2015, accessed September 2, 2021, at https://landsat.gsfc.nasa.gov/article/nasas-sport-disaster-response-team-provides-landsat-imagery-illinois-tornadoes.
Straub, C.L., Koontz, S.R., and Loomis, J.B., 2019, Economic valuation of Landsat imagery: U.S. Geological Survey Open-File Report 2019–1112, 13 p., accessed August 17, 2021, at https://pubs.er.usgs.gov/publication/ofr20191112.
For additional information on Landsat, please contact:
Program Coordinator
USGS National Land Imaging Program
12201 Sunrise Valley Drive
Reston, VA 20192
703–648–4567
The Landsat series is a joint effort of USGS and NASA. NASA develops and launches the spacecraft; USGS manages satellite operations, ground reception, data archiving, product generation, and data distribution. Funding for the National Land Imaging Program’s Landsat operations and data management is provided through the USGS.
Disclaimers
Any use of trade, firm, or product names is for descriptive purposes only and does not imply endorsement by the U.S. Government.
Although this information product, for the most part, is in the public domain, it also may contain copyrighted materials as noted in the text. Permission to reproduce copyrighted items must be secured from the copyright owner.
Suggested Citation
U.S. Geological Survey, 2022, Illinois and Landsat (ver. 1.1, January 2023): U.S. Geological Survey Fact Sheet 2022–3006, 2 p., https://doi.org/10.3133/fs20223006.
ISSN: 2327-6932 (online)
ISSN: 2327-6916 (print)
Study Area
| Publication type | Report |
|---|---|
| Publication Subtype | USGS Numbered Series |
| Title | Illinois and Landsat |
| Series title | Fact Sheet |
| Series number | 2022-3006 |
| DOI | 10.3133/fs20223006 |
| Edition | Version 1.0: February 24, 2022; Version 1.1: January 13, 2023 |
| Publication Date | February 24, 2022 |
| Year Published | 2022 |
| Language | English |
| Publisher | U.S. Geological Survey |
| Publisher location | Reston, VA |
| Contributing office(s) | Earth Resources Observation and Science (EROS) Center |
| Description | 2 p. |
| Country | United States |
| State | Illinois |
| Online Only (Y/N) | N |