

Hawaii and Landsat
Links
- Document: Report (3.23 MB pdf) , HTML , XML
- Download citation as: RIS | Dublin Core
Abstract
Hawaii stands apart from the rest of the United States, literally and figuratively. The nearest of the eight islands that make up the Hawaiian archipelago is 2,000 miles from the U.S. mainland. Like every bit of land mass within the State, it emerged from the Pacific Ocean after thousands of years of undersea volcanic activity. Kona International Airport, on the “Big Island” of Hawai‘i, was built atop 220-year-old lava flows from the Hualālai volcano.
The volcanic soils and tropical vegetation that stretch across Hawaii’s postcard-perfect peaks and valleys, as well as the trade winds that blow precipitation northeast across the islands and the warm Kona winds that move in from the south, are among the factors that make the study of the State’s landscapes distinct from the rest of the Nation.
Six active volcanoes continue to alter the land surface. Some of them, like the constantly erupting Kīlauea or Mauna Loa, the world’s largest active volcano, can threaten human life and property. Man-made changes to the islands, such as the long-term agricultural production of sugar cane or pineapple, along with the introduction of non-native species, have also affected the health of the State’s ecosystems.
Landsat satellites, with 50 years of repeat Earth observations and decades of data from infrared and thermal instruments capable of tracking lava flows, can offer unique opportunities for the study of Hawaii’s ever-changing landscapes. Here are a few examples of how Landsat benefits the State.
Tracking Lava Flows from Space
From around 400 miles overhead, Landsat satellites collect imagery in visible bands of the electromagnetic spectrum and in bands that are invisible to the naked eye. Infrared and near-infrared bands make it easier to track the health of vegetation, burn scars, or damage from insects, whereas thermal bands record surface temperature like an orbiting thermometer. Hawaii, perhaps more than any other State, benefits from the free and open availability of these thermal data. Research teams have used Landsat to track lava flows and understand the dynamics of lava lakes, sometimes by combining coarse-resolution (greater than 1-kilometer pixel size) satellite data collected daily with higher-resolution imagery from Landsat to map lava flows with greater accuracy (Flynn and others, 2001). The importance of Landsat’s thermal imaging capabilities came into stark relief in 2018, when new fissures from Kīlauea appeared beneath a large residential development on Hawai‘i. Landsat 8’s Operational Land Imager (OLI) and Thermal Infrared Sensor (TIRS) instruments captured useful and stunning imagery of the fissures’ growth and lava’s movement toward the ocean (USGS, 2019).
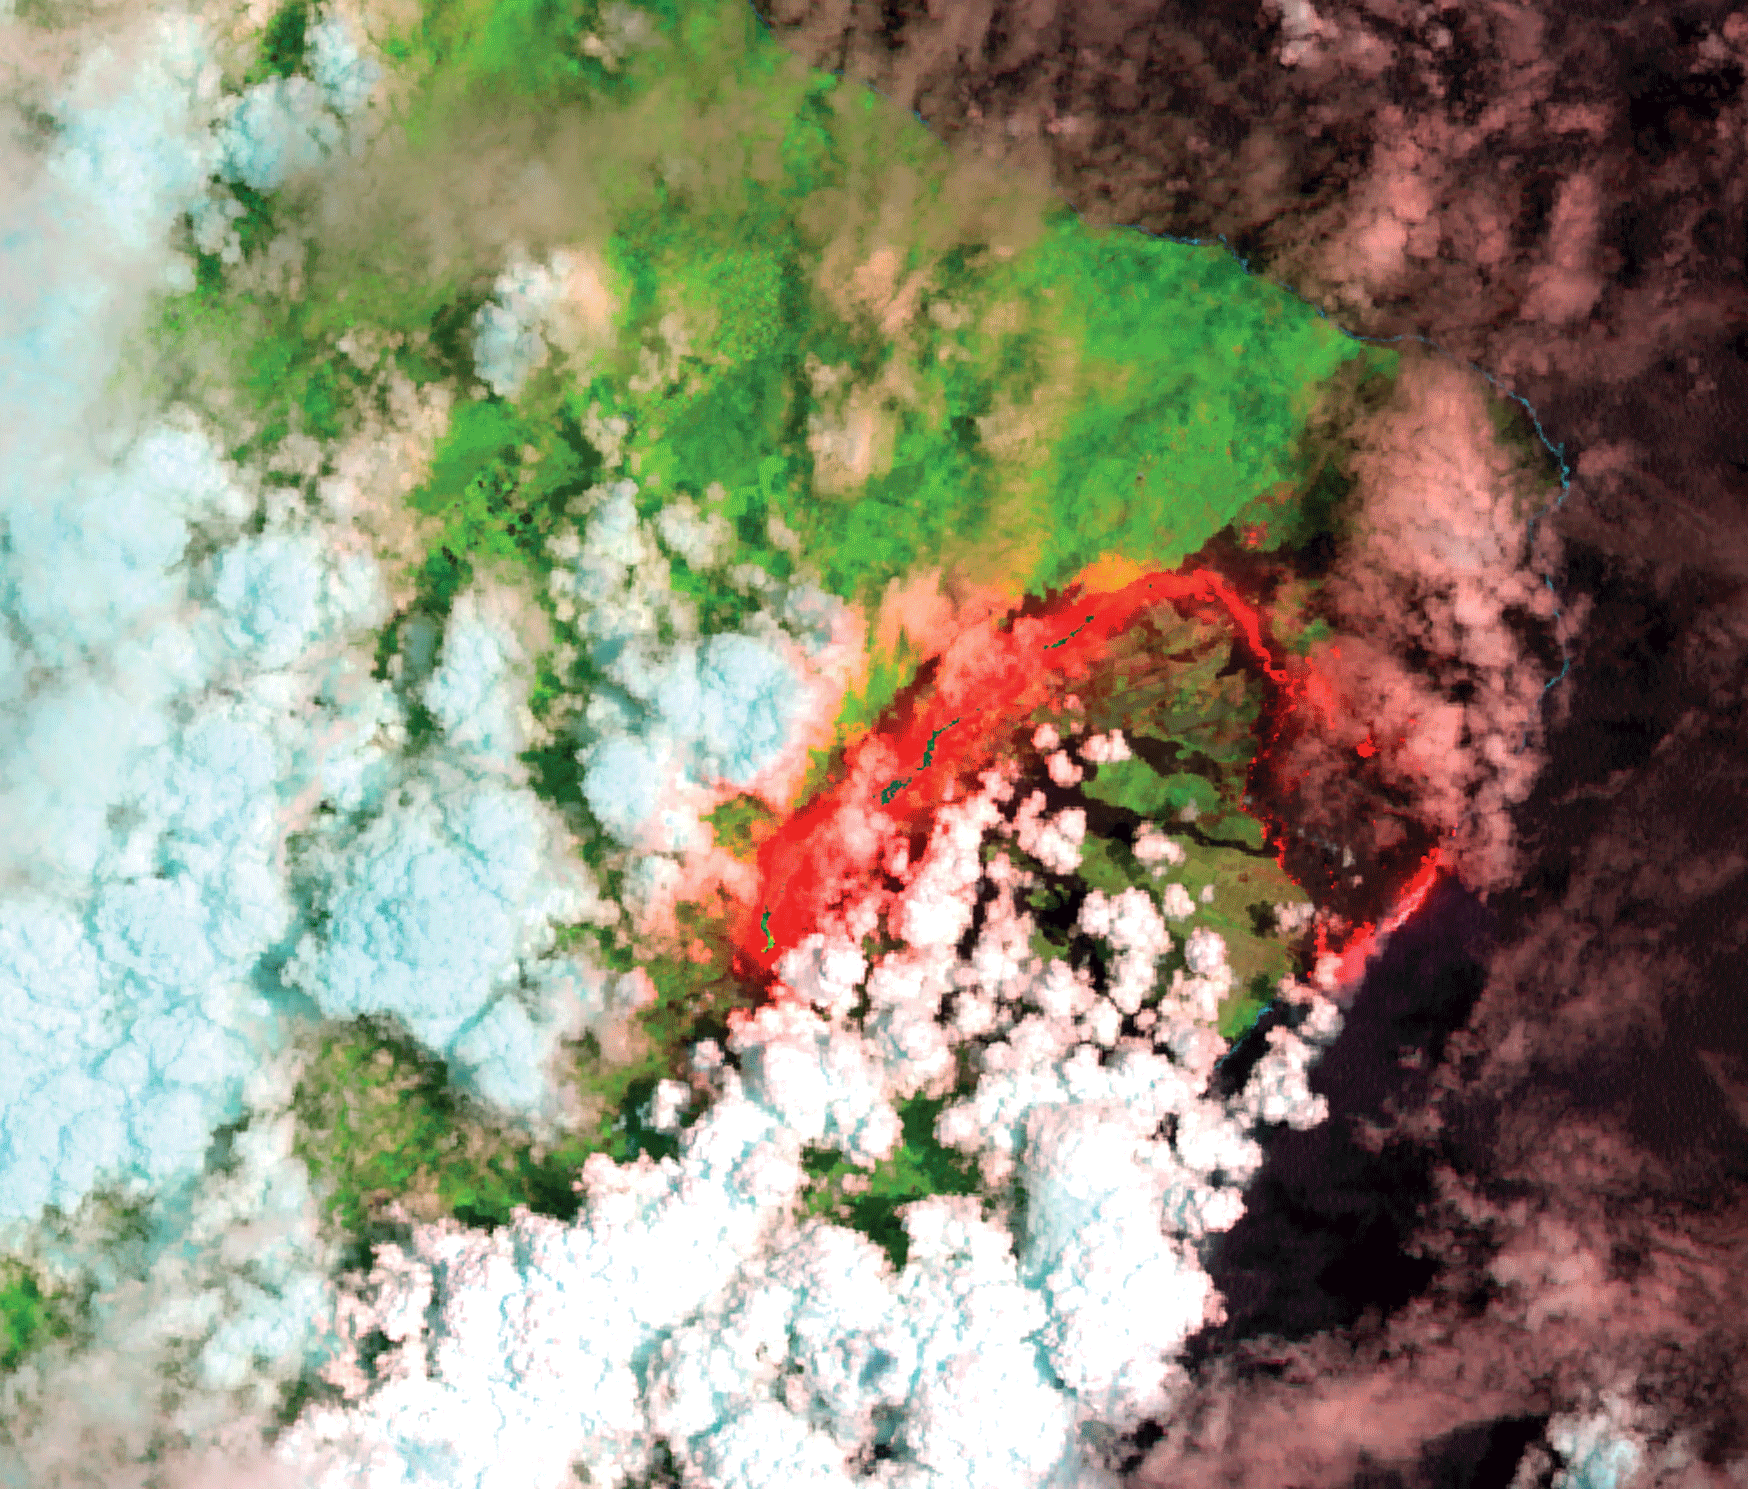
Landsat’s ability to record spectral information in the infrared and near-infrared bands of the electromagnetic spectrum aids in the study of volcanic eruptions. The Landsat 8 composite shown above uses those bands to illustrate Kīlauea’s volcanic activity in 2018.
Monitoring Land Change Patterns
The emergence of easy-to-mill sugarcane hybrids and the introduction of irrigation were among the factors that moved Hawaiian sugar cane cultivation from small-scale operations to large plantations in the 19th Century. These activities ushered in an era of agricultural prominence that lasted more than 100 years. However, the high cost of local production, and improvements to production methods on the U.S. mainland, contributed to a steady local decline. The last cane operation on the archipelago was in central Maui. The operations ceased in 2016, and fields were left fallow, which caused dry, non-native grasses to proliferate and set up conditions for one of Hawaii’s largest fires. At least 19,300 acres burned in and around the former cane fields in 2019. Landsat satellites captured the effect of the fire and continue to monitor Maui’s recovery (Pacific Fire Exchange, 2019). Landsat imagery also forms the foundation of satellite-based land cover mapping products such as the National Land Cover Database (NLCD), Landscape Fire and Resource Management Planning Tools (LANDFIRE), and USGS Land Change Monitoring, Assessment, and Projection (LCMAP) product, which sort each 30-by-30-meter plot of land in the United States into land cover classes of varying detail (for example, cultivated crops, developed land). Landsat-derived maps can serve as a starting point for urban planning, habitat restoration, and land management decisions by improving our understanding of land use patterns and their implications.
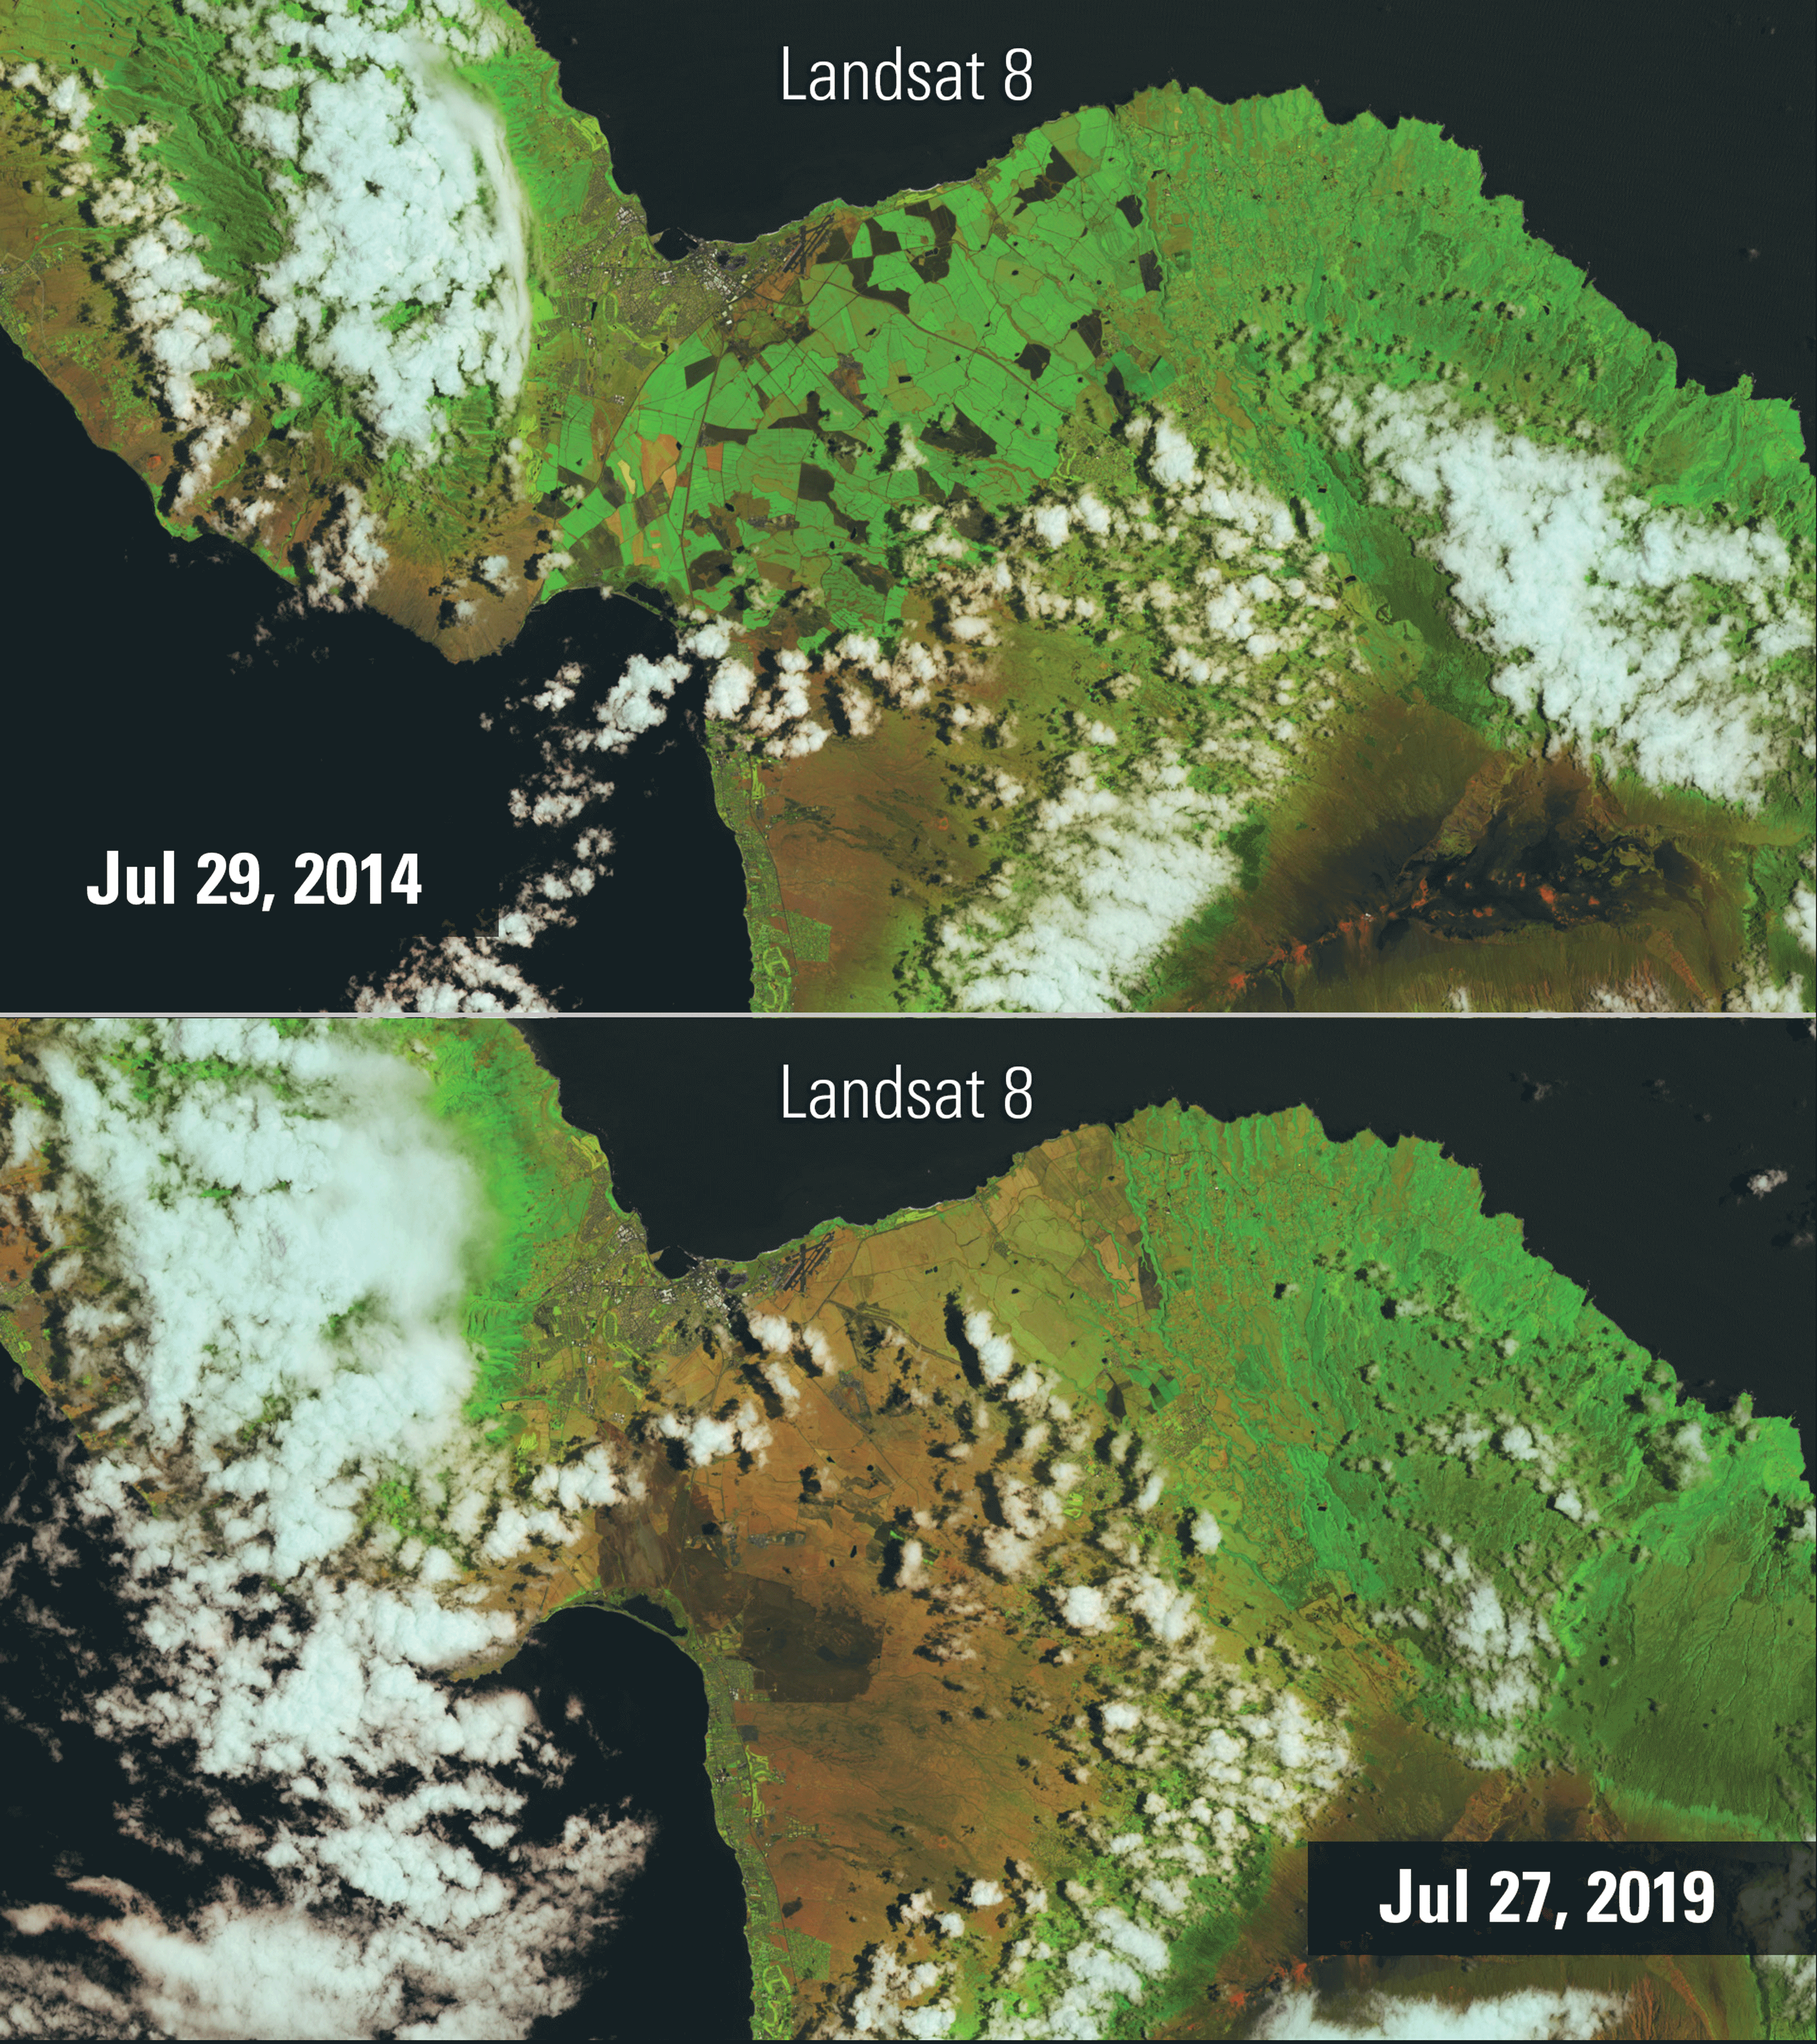
Landsat 8 imagery showing the effect of a series of wildfires that burned through former sugar cane fields in Maui in 2019.
Mapping Land Conditions
The height and health of the tree canopy on each Hawaiian island have implications for water use, ecosystem health, and carbon sequestration. Landsat images are two dimensional, but their steady repeat coverage and high level of highly accurate calibration can help researchers in Hawaii fill in data gaps. In Oahu, for example, locally available three-dimensional light detection and ranging (lidar) datasets were missing tree canopy information from the island’s notoriously cloudy peaks. Researchers at the University of Hawaiʻi at Mānoa were able to estimate tree height by combining that lidar data with Landsat data to produce a tree height record for the entire island, opening the door to a host of research questions (Chen, 2022).
National Land Imaging Program Benefits—Hawaii
The U.S. Geological Survey (USGS) National Land Imaging Program provides a wide range of satellite imagery and other remotely sensed and geospatial data to Government, commercial, academic, and public users. Those users can get worldwide access to Landsat satellite data through the National Land Imaging Program-funded USGS Earth Resources Observation and Science (EROS) Center.
Landsat—Critical Information Infrastructure for the Nation
Landsat is the most widely used land remote sensing data source within Federal civilian agencies. Local, State, Tribal, and Federal agencies use Landsat to monitor and forecast a wide range of land surface phenomena. Information from Landsat contributes to day-to-day decisions on land, water, and resource use that protect life and property; safeguard the environment; advance science, technology and education; support climate change resiliency; and grow the U.S. economy. Landsat’s imagery provides a landscape-level view of land surface, inland lake, and coastal processes, both natural and human-induced. Landsat enables us to better understand the scope, nature, and speed of change to the natural and built environment.
Businesses draw upon Landsat data to provide customer-specific applications to improve logistics, resource allocation, and investment decisions. Commercial space-imaging firms leverage Landsat data to refine product offerings and support new information services. A 2017 USGS study determined the total annual economic benefit of Landsat data in the United States to be $2.06 billion, far surpassing its development and operating costs (Straub and others, 2019).
Landsat 8 and Landsat 9 provide 8-day repeat coverage of the Earth’s land surfaces. The National Aeronautics and Space Administration (NASA) and the USGS are currently reviewing the findings from a joint Architecture Study Team, which will inform the design and implementation approach for Landsat Next, the follow-on mission to Landsat 9. Landsat 9 and its successors are planned to provide a sustainable, space-based system to extend the 50-year Landsat series of high-quality global land imaging measurements—the world’s longest time series of the Earth’s land surface.
The long-term availability of consistent and accurate Landsat data, combined with a no-cost data policy, allows users to analyze extensive geographic areas and better understand and manage long-term trends in land surface change. New cloud computing and data analytics technologies use Landsat data in a wide range of decision-support tools for Government and industry. Much like global positioning systems and weather data, Landsat data are used every day to help us better understand our dynamic planet.
References Cited
Chen, Q., 2022, L2FHM-OMA—Landsat- and lidar-based forest height map for Oahu mountainous areas: HawaiiView web page, accessed February 2, 2022, at https://hawaiiview.org/data/l2fhm/.
Pacific Fire Exchange, 2019, Wildfire review series—Abandoned agriculture in 2019 is Hawai’i’s fire problem: Pacific Fire Exchange, accessed December 14, 2021, at https://www.pacificfireexchange.org/research-publications/category/2019-wildfire-review-hawaii.
Straub, C.L., Koontz, S.R., and Loomis, J.B., 2019, Economic valuation of Landsat imagery: U.S. Geological Survey Open-File Report 2019–1112, 13 p., accessed January 13, 2022, at https://doi.org/10.3133/ofr20191112.
U.S. Geological Survey [USGS], 2019, Kīlauea, Hawaii, USA: USGS Earthshots web page, accessed February 7, 2022, at https://eros.usgs.gov/image-gallery/earthshots.
For additional information on Landsat, please contact:
Program Coordinator
USGS National Land Imaging Program
12201 Sunrise Valley Drive
Reston, VA 20192
703–648–5953
The Landsat series is a joint effort of USGS and NASA. NASA develops and launches the spacecraft; USGS manages satellite operations, ground reception, data archiving, product generation, and data distribution. Funding for the National Land Imaging Program’s Landsat operations and data management is provided through the USGS.
Disclaimers
Any use of trade, firm, or product names is for descriptive purposes only and does not imply endorsement by the U.S. Government.
Although this information product, for the most part, is in the public domain, it also may contain copyrighted materials as noted in the text. Permission to reproduce copyrighted items must be secured from the copyright owner.
Suggested Citation
U.S. Geological Survey, 2022, Hawaii and Landsat: U.S. Geological Survey Fact Sheet 2022–3024, 2 p., https://doi.org/10.3133/fs20223024.
ISSN: 2327-6932 (online)
ISSN: 2327-6916 (print)
Study Area
| Publication type | Report |
|---|---|
| Publication Subtype | USGS Numbered Series |
| Title | Hawaii and Landsat |
| Series title | Fact Sheet |
| Series number | 2022-3024 |
| DOI | 10.3133/fs20223024 |
| Publication Date | May 04, 2022 |
| Year Published | 2022 |
| Language | English |
| Publisher | U.S. Geological Survey |
| Publisher location | Reston, VA |
| Contributing office(s) | Earth Resources Observation and Science (EROS) Center |
| Description | 2 p. |
| Country | United States |
| State | Hawaii |
| Online Only (Y/N) | N |