

Groundwater Quality in the Surficial Aquifer System, Southeastern United States
Links
- Document: Report (3.3 MB pdf) , HTML , XML
- NGMDB Index Page: National Geologic Map Database Index Page (html)
- Download citation as: RIS | Dublin Core
Abstract
Groundwater provides nearly 50 percent of the Nation’s drinking water. To help protect this vital resource, the U.S. Geological Survey (USGS) National Water-Quality Assessment (NAWQA) Project assesses groundwater quality in aquifers that are important sources of drinking water (Burow and Belitz, 2014). The surficial aquifer system constitutes one of the important aquifer systems being evaluated.
Background

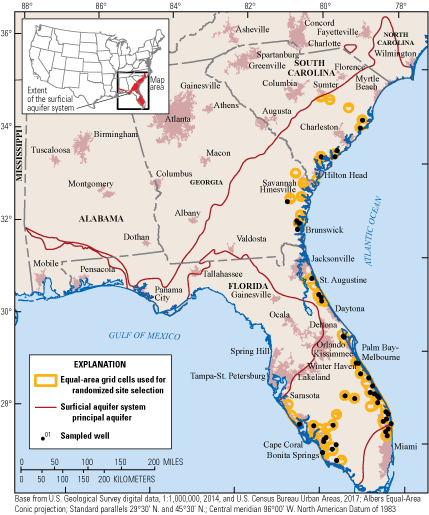
The surficial aquifer system underlies an area of about 63,600 square miles in parts of Alabama, South Carolina, Georgia, and Florida. About 14 million people live in the area overlying this aquifer (U.S. Census Bureau, 2010) and about 270 million gallons of water per day were withdrawn for public supply in 2015 (Lovelace and others, 2020). The aquifer was ranked 16th in the Nation in withdrawals for public supply (Maupin and Barber, 2005). Much of the area overlying the aquifer is wetlands, forest, and open water (71 percent). Agricultural land use makes up about 18 percent and urban land use makes up about 11 percent of the study area. The part of the surficial aquifer system sampled for this study was defined by creating 10-kilometer buffer areas around water supply wells and equal-area grids for the aggregated buffers in parts of Florida, Georgia, and South Carolina. Major cities in or near the study area include Savannah, Georgia; Hilton Head, South Carolina; and Palm Beach and Fort Meyers, Florida, among many additional communities.
The sediments that make up the surficial aquifer system include unconsolidated Miocene to Holocene age sand and gravel as well as shelly sand and shell deposits (Miller, 1990). These sediments make up nine geologic formations in Florida but are complexly interbedded lenses such that all the formations are not present at any given location (Miller, 1990). In Georgia and South Carolina, the surficial aquifer system consists of undifferentiated Pleistocene-age terrace deposits and Holocene sand deposits (Miller, 1990). The surficial aquifer system typically is less than 100 feet thick, but it thickens to the south in Florida where it is as much as 400 feet thick (Miller, 1990). Groundwater in the surficial aquifer system is mostly unconfined, but locally fine-grained deposits can result in semi-confined to confined conditions.
Groundwater quality in the surficial aquifer system was evaluated by sampling 45 spatially distributed (randomized) public-supply wells sampled for the purposes of assessing groundwater quality at a regional scale. Water-quality data collected from wells in a network designed in this way are representative of the spatial distribution of the water quality in the study area (Belitz and others, 2010). Groundwater-quality data from these wells were used to estimate the percentage of the study area with concentrations that are high, moderate, and low with respect to constituent benchmarks. The accuracy of the estimates depends on the distribution and number of wells, not on the size of the area (Belitz and others, 2010). Wells ranged from about 20 to 270 feet deep with an average depth of about 110 feet. Samples were collected between June and November 2019, and the samples were analyzed for a large number of natural and man-made constituents.
Overview of Water Quality
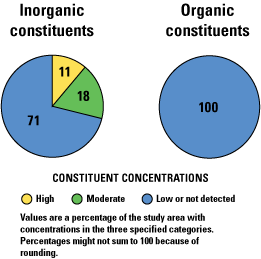
Principal Aquifer Studies are designed to evaluate untreated groundwater used for public supply. Groundwater quality is assessed by comparing concentrations to benchmarks established for drinking-water quality. Benchmarks and definitions of high, moderate, and low relative concentrations are discussed in the inset box on page 3.
Many inorganic constituents are naturally present in groundwater; however, their concentrations can be affected by human activities. One or more inorganic constituents with human-health benchmarks were present at high concentrations in about 11 percent of the study area and at moderate concentrations in about 18 percent.
Man-made organic constituents are found in products used in the home, business, industry, and agriculture. Organic constituents can enter the environment through normal use, spills, or improper disposal. Of the organic constituents detected, 30 had human-health benchmarks; however, concentrations typically were low, and no constituents were detected at moderate or high concentrations in the study area.
Results: Groundwater Quality at the Depth Zone Used for Public Supply in the Surficial Aquifer System
INORGANIC CONSTIUENTS
Inorganic Constituents with Human-Health Benchmarks
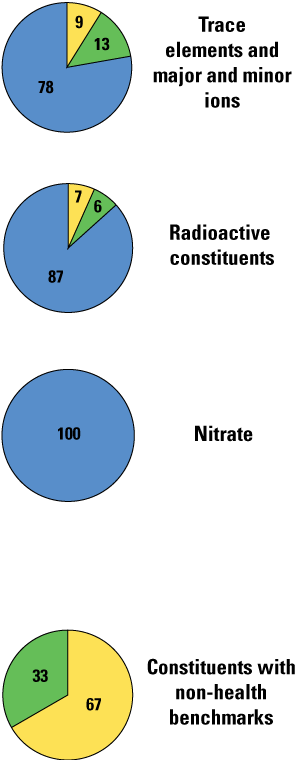
Trace elements and major and minor ions are naturally present in the minerals of rocks, soils, and sediments, and in the water that comes into contact with those materials. Samples were analyzed for 34 trace elements and major and minor ions, of which 22 have human-health benchmarks (health-based screening level [HBSL] benchmarks were updated in 2018 to include aluminum, cobalt, and iron; Norman and others, 2018). High or moderate concentrations of these constituents were measured in 22 percent of the study area with a total of eight constituents present at elevated concentrations. Iron was present at high and moderate concentrations in 16 and 2 percent of the study area, respectively. Molybdenum was present at high concentrations in 4 percent and arsenic was present at high and moderate concentrations in 2 percent of the study area.
Radioactivity is the release of energy or energetic particles during the spontaneous decay of unstable atoms, and humans are continuously exposed to small amounts of natural radioactivity. Most of the radioactivity in groundwater comes from the decay of naturally occurring uranium and thorium isotopes. Samples were analyzed for eight radioactive constituents, of which four have human-health benchmarks. Radioactive constituents were present at high concentrations in about 7 percent and at moderate levels in 6 percent of the study area. Gross-alpha radioactivity and radium-226 were detected at high concentrations in 2 percent of the study area and combined radium-226 + radium 228 were at high concentrations in 4 percent of the study area.
Nutrients are naturally present at low concentrations in groundwater; high and moderate concentrations (relative to human-health benchmarks) generally are a result of human activities. Samples were analyzed for five nutrients, of which two (nitrate and nitrite) have human-health benchmarks. Common sources of nutrients, aside from those naturally occurring in soils, include fertilizer applied to crops and landscaping, seepage from septic systems, and human and animal waste. Nitrate was not detected at moderate or high concentrations in the study area.
Inorganic Constituents and Field Measurements with Non-Health Benchmarks
(Not included in water-quality overview charts shown on the front page)
Some constituents affect the aesthetic properties of water, such as taste, color, and odor, or can create nuisance problems, such as staining and scaling. The benchmarks used for these constituents, referred to as non-health benchmarks, are non-regulatory secondary maximum contaminant level (SMCL) benchmarks established for public drinking water. Some constituents such as manganese have human-health benchmarks and SMCLs. Samples were analyzed for 11 constituents that have SMCLs. One or more of these constituents were present at high concentrations in about 67 percent of the study area and at moderate concentrations in about 33 percent.
Total dissolved solids (TDS) concentration is a measure of the salinity of the groundwater based primarily on the concentrations of ions, and all water naturally contains TDS because of the weathering and dissolution of minerals in rocks and sediments. Total dissolved solids concentrations can be high as a result of natural factors or human activities such as road salting and some agricultural activities. Total dissolved solids were present at high and moderate concentrations relative to the SMCL in 31 and 69 percent the study area, respectively.
Anoxic conditions in groundwater (low concentrations of dissolved oxygen) can result in the release of naturally occurring iron and manganese from minerals into groundwater. Iron and manganese were present at high concentrations relative to the SMCL in about 50 and 4 percent of the study area, respectively. Iron and manganese were present at moderate concentrations in 24 and 76 percent of the study area, respectively.
Groundwater pH has an SMCL range of 6.5 to 8.5. In the surficial aquifer system, pH was less than or greater than the SMCL in about 2 percent of the study area.
ORGANIC CONSTIUENTS
Volatile Organic Compounds with Human-Health Benchmarks
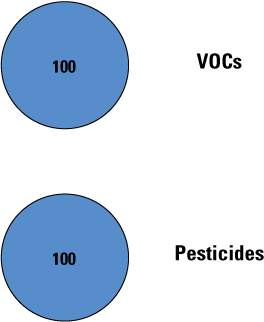
Volatile organic compounds (VOCs) are present in many household, commercial, industrial, and agricultural products and are characterized by their tendency to volatilize (evaporate) into the air. Samples were analyzed for 85 VOCs, of which 51 have human-health benchmarks. Volatile organic compounds were not detected at high or moderate concentrations in the study area.
Pesticides with Human-Health Benchmarks
Pesticides, including herbicides, insecticides, and fumigants, are applied to crops, gardens, and lawns, around buildings, and along roads to help control unwanted vegetation (weeds), insects, fungi, and other pests. Samples were analyzed for 225 pesticide compounds (pesticides and their breakdown products), of which 119 have human-health benchmarks. Pesticide compounds were detected at low concentrations throughout much of the study area. No pesticides were detected at moderate or high concentrations relative to human-health benchmarks.
BENCHMARKS FOR EVALUATING GROUNDWATER QUALITY
The USGS NAWQA Project uses benchmarks established for drinking water to provide context for evaluating the quality of untreated groundwater. The quality of water received by customers is likely different because after withdrawal, groundwater usually is treated before delivery. Federal regulatory benchmarks for protecting human health are used for this evaluation of water quality when available. Otherwise, non-regulatory human-health benchmarks and non-regulatory aesthetic benchmarks are used. Not all of the constituents analyzed have benchmarks and thus were not able to be evaluated using this approach. Out of 55 inorganic constituents and properties (for example, pH) and 317 organic constituents analyzed, 24 and 157, respectively, have human-health benchmarks.
Concentrations are considered high if they are greater than a human-health benchmark (Norman and others, 2018) or SMCL. For inorganic constituents, concentrations are moderate if they are greater than one-half of a benchmark. For organic constituents, concentrations are moderate if they are greater than one-tenth of a benchmark; this lower threshold was used because organic constituents are generally less prevalent and have smaller concentrations relative to benchmarks than inorganic constituents (Toccalino and others, 2004).
Benchmark Type and Value for Selected Constituents
This table presents benchmarks for those constituents detected at high concentrations in the surficial aquifer system. Benchmark types are regulatory U.S. Environmental Protection Agency (EPA) maximum contaminant levels (MCLs; U.S. Environmental Protection Agency, 2020a), non-regulatory health-based screening levels (HBSLs; Norman and others, 2018), and non-regulatory EPA secondary maximum contaminant levels (SMCLs; U.S. Environmental Protection Agency, 2020b).
[μg/L, microgram per liter; pCi/L, picocurie per liter; mg/L, milligram per liter]
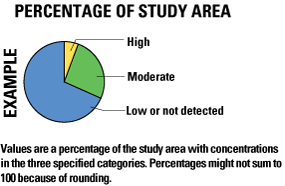
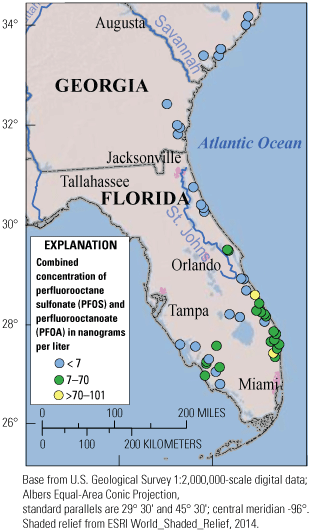
Per- and Polyfluoroalkyl Substances Were Detected Frequently
In addition to the constituents typically sampled for Principal Aquifer Studies, samples for the analysis of 24 per- and polyfluoroalkyl substances (PFAS) were collected from the wells in this network (McMahon and others, 2022a). These organic compounds have widespread use in household products such as water repellant fabrics, nonstick products, food packaging, cleaning products and paints. PFAS also have been used extensively in fire-fighting foams (Glüge and others, 2020). Of the PFAS analyzed, half were detected in samples and all of the detections were in samples from wells in Florida. Perfluorooctane sulfonate (PFOS) and perfluorooctanoate (PFOA) were among the most commonly detected PFAS in this assessment (McMahon and others, 2022a), and about 50 percent of the study area had moderate concentrations and about 4 percent of the study area had concentrations greater than the drinking water advisory level of 70 nanograms per liter for the combined concentrations (U.S. Environmental Protection Agency, 2016). The occurrence of PFAS in the study area was related to the distance of the wells from potential sources, such as fire training areas, landfills, chemical manufacturing plants, and airports (McMahon and others, 2022b).
Principal Aquifer Studies
The USGS NAWQA Project has been assessing the quality of groundwater since 1991. The NAWQA studies include Land Use Studies (LUS), Major Aquifer Studies (MAS), and Principal Aquifer Studies (PAS). These three study types are based on the sampling of networks of wells distributed across an area of interest. The LUS networks typically consist of observation wells that are relatively shallow (typically less than 100 feet deep); MAS networks typically consist of domestic-supply wells that are intermediate in depth (typically 50 to 150 feet); and PAS networks typically consist of public-supply wells that are relatively deep (typically 150 to 750 feet). A national synthesis of shallow and intermediate depth groundwater quality was reported by DeSimone and others (2015). This fact sheet provides a summary of PAS data for 45 public-supply wells sampled in 2019 in the surficial aquifer system principal aquifer (data available in Gill and others, 2021).
The PAS assessments like this one allow for the comparison of constituent concentrations in untreated groundwater with benchmarks established for the protection of human health and for aesthetic qualities for drinking water and provide a basis for comparison of groundwater quality among principal aquifers.
The data collected by the NAWQA Project include chemical analyses generally not available as part of regulatory compliance monitoring, including measurements at concentrations much lower than human-health benchmarks and measurement of constituents that can be used to trace the sources and movement of groundwater.
References Cited
Belitz, K., Jurgens, B., Landon, M.K., Fram, M.S., and Johnson, T., 2010, Estimation of aquifer scale proportion using equal area grids—Assessment of regional scale groundwater quality: Water Resources Research, v. 46, no. 11, 14 p. [Available at https://doi.org/10.1029/2010WR009321.]
Burow, K.R., and Belitz, K., 2014, Groundwater studies—Principal aquifer surveys: U.S. Geological Survey Fact Sheet 2014–3024, 2 p. [Available at https://doi.org/10.3133/fs20143024.]
DeSimone, L.A., McMahon, P.B., and Rosen, M.R., 2015, The quality of our Nation’s waters—Water quality in principal aquifers of the United States, 1991–2010: U.S. Geological Survey Circular 1360, 151 p., [Available at https://doi.org/10.3133/cir1360.]
Gill, A.C., Sharpe, J.B., Bexfield, L.M., Kingsbury, J.A., and Lindsey, B.D., 2021, Select groundwater-quality and quality-control data from the National Water-Quality Assessment Project 2019 to present: U.S. Geological Survey data release. [Available at https://doi.org/10.5066/P9J7I9DH.]
Glüge, J., Scheringer, M., Cousins, I.T., DeWitt, J.C., Goldenman, G., Herzke, D., Lohmann, R., Ng, C.A., Trier, X., and Wang, Z., 2020, An overview of the uses of per- and polyfluoroalkyl substances (PFAS): Environmental Science: Processes & Impacts, v. 22, no. 12, p. 2345–2373, accessed November 22, 2021, at https://doi.org/10.1039/D0EM00291G.
Lovelace, J.K., Nielsen, M.G., Read, A.L., Murphy, C.J., and Maupin, M.A., 2020, Estimated groundwater withdrawals from principal aquifers in the United States, 2015: U.S. Geological Survey Circular 1464, 70 p., accessed March 12, 2020, at https://doi.org/10.3133/cir1464.
Maupin, M.A., and Barber, N.L., 2005, Estimated withdrawals from principal aquifers in the United States, 2000: U.S. Geological Survey Circular 1279, 46 p., accessed January 4, 2016, at https://doi.org/10.3133/cir1279.
McMahon, P.B., Bexfield, L.M., Watson, E., Johnson, T.D., Tokranov, A.K., and Lindsey, B.D., 2022a, Geochemical data, and geospatial data for per- and polyfluoroalkyl substances (PFAS) in groundwater used as a source of drinking water in the eastern United States: U.S. Geological Survey data release, accessed February 24, 2022, at https://doi.org/10.5066/P9R7UJYV.
McMahon, P.B., Tokranov, A.K., Bexfield, L.M., Lindsey, B.D., Johnson, T.D., Lombard, M.A., and Watson, E., 2022b, Per- and polyfluoroalkyl substances (PFAS) in groundwater used as a source of drinking water in the eastern United States: Environmental Science and Technolology, v. 56, no. 4, p. 2279–2288. [Available at https://doi.org/10.1021/acs.est.1c04795.]
Miller, J.A., 1990, Ground water atlas of the United States—Alabama, Florida, Georgia, South Carolina: U.S. Geological Survey Hydrologic Atlas 730–G, accessed January 4, 2016, at https://pubs.usgs.gov/ha/ha730/ch_g/index.html.
Norman, J.E., Toccalino, P.L., and Morman, S.A., 2018, Health-based screening levels for evaluating water-quality data (2d ed.): U.S. Geological Survey National Water-Quality Assessment Program web page, accessed March 11, 2020, at https://doi.org/10.5066/F71C1TWP.
Toccalino, P.L., Norman, J.E., Phillips, R.H., Kauffman, L.J., Stackelberg, P.E., Nowell, L.H., Krietzman, S.J., and Post, G.B., 2004, Application of health-based screening levels to ground-water quality data in a state-scale pilot effort: U.S. Geological Survey Scientific Investigations Report 2004–5174, 64 p., accessed January 4, 2016, at https://doi.org/10.3133/sir20045174.
U.S. Census Bureau, 2010, Census of population and housing, 2010: U.S. Bureau of the Census, digital data, accessed March 1, 2018, at https://www.census.gov/programs-surveys/decennial-census.html.
U.S. Environmental Protection Agency, 2016, PFOA & PFAS drinking water health advisories: U.S. Environmental Protection Agency Fact Sheet, accessed January 2022, at https://www.epa.gov/sites/default/files/2016-06/documents/drinkingwaterhealthadvisories_pfoa_pfos_updated_5.31.16.pdf.
U.S. Environmental Protection Agency, 2020a, National primary drinking water regulations: U.S. Environmental Protection Agency web page, accessed March 2020, at https://www.epa.gov/ground-water-and-drinking-water/national-primary-drinking-water-regulations.
U.S. Environmental Protection Agency, 2020b, Secondary drinking water standards—Guidance for nuisance chemicals: U.S. Environmental Protection Agency web page, accessed March 2020, at https://www.epa.gov/sdwa/secondary-drinking-water-standards-guidance-nuisance-chemicals.
Disclaimers
Any use of trade, firm, or product names is for descriptive purposes only and does not imply endorsement by the U.S. Government.
Although this information product, for the most part, is in the public domain, it also may contain copyrighted materials as noted in the text. Permission to reproduce copyrighted items must be secured from the copyright owner.
Suggested Citation
Kingsbury, J.A., 2022, Groundwater quality in the Surficial Aquifer System, Southeastern United States: U.S. Geological Survey Fact Sheet 2022-3035, 4 p., https://doi.org/10.3133/fs20223035.
ISSN: 2327-6932 (online)
ISSN: 2327-6916 (print)
Study Area
| Publication type | Report |
|---|---|
| Publication Subtype | USGS Numbered Series |
| Title | Groundwater quality in the Surficial Aquifer System, Southeastern United States: |
| Series title | Fact Sheet |
| Series number | 2022-3035 |
| DOI | 10.3133/fs20223035 |
| Publication Date | July 22, 2022 |
| Year Published | 2022 |
| Language | English |
| Publisher | U.S. Geological Survey |
| Publisher location | Reston, VA |
| Contributing office(s) | WMA - Earth System Processes Division |
| Description | 4 p. |
| Country | United States |
| State | Alabama, Florida, Georgia, South Carolina |
| Online Only (Y/N) | N |