
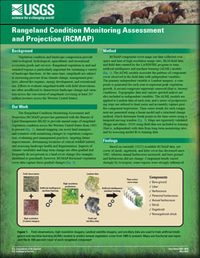
Rangeland Condition Monitoring Assessment and Projection (RCMAP)
Links
- Document: Report (8.20 MB pdf) , HTML , XML
- Download citation as: RIS | Dublin Core
Background
Vegetation condition and landscape composition provide vital ecological, hydrological, agricultural, and recreational ecosystem goods and services. Rangeland vegetation in arid and semiarid regions is particularly important for sustaining a variety of landscape functions. At the same time, rangelands are subject to increasing pressure from climate change, management practices, altered fire regimes, energy development, and recreational use. Efforts to evaluate rangeland health with field observations are often insufficient to characterize landscape change and variation across the vast extent of rangelands (covering at least 207 million hectares across the Western United States).
Our Work
The Rangeland Condition Monitoring Assessment and Projection (RCMAP) project has partnered with the Bureau of Land Management (BLM) to provide annual maps of rangeland vegetation condition across the Western United States from 1985 to present (fig. 1). Annual mapping can assist land managers and scientists with monitoring changes to vegetation composition, evaluating past management practices, targeting future improvements, determining locations of critical wildlife habitat, and assessing landscape health and fragmentation. Impacts of climate variability and long-term change are often gradual and frequently do not present as a land cover change (for example, shrubland to grassland); however, RCMAP fractional vegetation cover data capture these gradual changes (fig. 2).
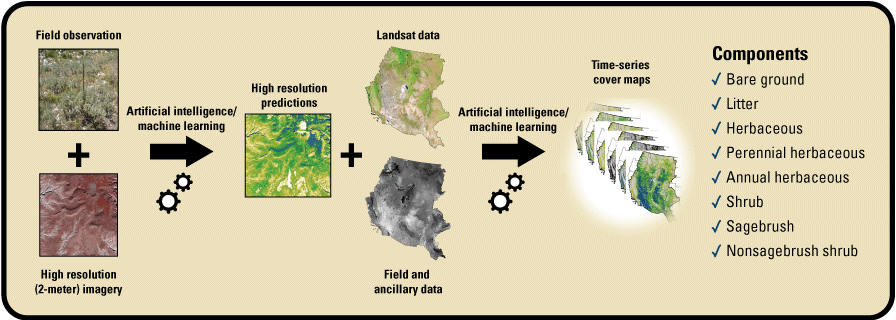
Field observations, high resolution imagery, Landsat satellite imagery, and ancillary data are used to train artificial intelligence and machine learning (AI/ML) models to predict annual vegetation cover from 1985 to present. Maps are fractional and represent the 0–100-percent cover of each rangeland component.
Method
RCMAP component cover maps use data collected over space and time at high resolution image sites, BLM field data, and field data curated by the LANDFIRE program to train artificial intelligence and machine learning (AI/ML) models (fig. 1). The AI/ML models associate the patterns of component cover observed in the field data with independent variables. The primary independent variable is Landsat imagery; a composite is generated for each year to represent peak vegetation growth. A second composite represents senesced (that is, brown) conditions. Topographic data and various spectral indices are also included as independent variables. The AI/ML models are applied to Landsat data of each year, and a series of postprocessing steps are utilized to limit noise and accurately capture postfire component trajectories. Time-series trends for each component are generated using a linear model and a structural change method, which determine break points in the time-series using a temporal moving window (fig. 3). Maps are rigorously validated (Rigge and others, 2019) using field data not included as training (that is, independent) with data from long-term monitoring sites, and by assessing model fit to training data.
Findings
Based on currently (2022) available RCMAP data, net cover of shrub, sagebrush, and litter cover has decreased since 1985, whereas annual herbaceous increased, and bare ground and herbaceous did not change. Component trends varied strongly by ecoregion; some regions were strongly influenced by fire history, and others by climate variation. Climate factors, including temperature maximums and growing season precipitation, were associated with all component cover trends, but bare ground was most sensitive to climate variation. Case studies demonstrated on-the-ground applicability of the dataset in relation to various causes of cover change, with more planned in collaboration with the BLM (Rigge and others, 2021a, 2021b).
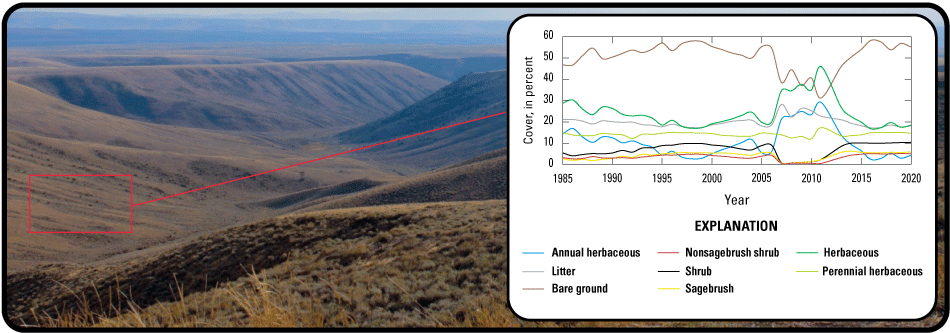
Rangeland Condition Monitoring Assessment and Projection (RCMAP) time-series data provide yearly cover and temporal trends of vegetation conditions since 1985. Data are provided for individual 30-meter pixels and also summarized by relevant management units (pastures, allotments, watersheds, and so forth) on the Multi-Resolution Land Characteristics rangelands viewer application (https://www.mrlc.gov/rangeland-viewer/).
Implications
Rangeland vegetation tends to change gradually in response to management practices, interannual climate variation, vegetation composition, and annual grass invasions. RCMAP’s spatial and temporal classification of rangeland condition can contribute to understanding patterns of change.
Data Availability
RCMAP fractional component time-series data from 1985 onwards are available for download (https://www.mrlc.gov/data), in map services (Web Map and Coverage Services; https://www.mrlc.gov/data-services-page), on the rangelands viewer application (https://www.mrlc.gov/rangeland-viewer/; fig. 2), and in Google Earth Engine (https://developers.google.com/earth-engine/datasets/catalog/ [key word: RCMAP]). Planned annual updates will extend and improve the time-series with additional training data and enhanced methodology. RCMAP time-series data have been leveraged to produce ecological potential fractional cover maps, which reflect expected vegetation conditions in the absence of disturbance. Contemporary departures from ecological potential reflect these disturbances (fig. 3). Climate relations observed in the time-series are used to project component cover under several climate change scenarios (fig. 3).
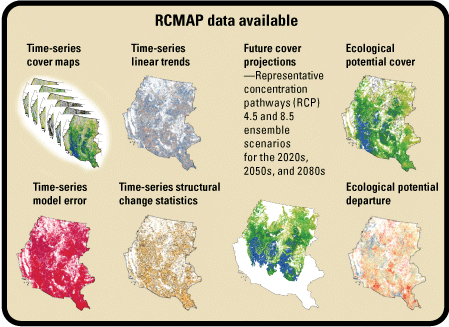
Rangeland Condition Monitoring Assessment and Projection (RCMAP) datasets currently available.
References Cited
Rigge, M., Bunde, B., Meyer, D., Shi, H., and Postma, K., 2021a, Rangeland Condition Monitoring Assessment and Projection (RCMAP) fractional component time-series across the Western U.S. 1985–2020 (ver. 2.0, October 2021): U.S. Geological Survey data release, https://doi.org/10.5066/P95IQ4BT.
Rigge, M., Homer, C., Shi, H., and Meyer, D.K., 2019, Validating a Landsat time-series of fractional component cover across western U.S. rangelands: Remote Sensing, v. 11, no. 24, 16 p. [Also available at https://doi.org/10.3390/rs11243009.]
Rigge, M., Homer, C., Shi, H., Meyer, D., Bunde, B., Granneman, B., Postma, K., Danielson, P., Case, A., and Xian, G., 2021b, Rangeland fractional components across the Western United States from 1985 to 2018: Remote Sensing (Basel), v. 13, no. 4, 813 p. [Also available at https://doi.org/10.3390/rs13040813.]
For more information, please contact:
Customer Services
U.S. Geological Survey Earth Resources Observation and Science Center
Sioux Falls, SD 57198
605–594–6151
For additional information, visit https://www.mrlc.gov/ or https://www.mrlc.gov/rangeland-viewer/
Disclaimers
Any use of trade, firm, or product names is for descriptive purposes only and does not imply endorsement by the U.S. Government.
Although this information product, for the most part, is in the public domain, it also may contain copyrighted materials as noted in the text. Permission to reproduce copyrighted items must be secured from the copyright owner.
Suggested Citation
Rigge, M.B., 2022, Rangeland Condition Monitoring Assessment and Projection (RCMAP): U.S. Geological Survey Fact Sheet 2022–3036, 2 p., https://doi.org/10.3133/fs20223036.
ISSN: 2327-6932 (online)
| Publication type | Report |
|---|---|
| Publication Subtype | USGS Numbered Series |
| Title | Rangeland Condition Monitoring Assessment and Projection (RCMAP) |
| Series title | Fact Sheet |
| Series number | 2022-3036 |
| DOI | 10.3133/fs20223036 |
| Publication Date | May 31, 2022 |
| Year Published | 2022 |
| Language | English |
| Publisher | U.S. Geological Survey |
| Publisher location | Reston, VA |
| Contributing office(s) | Earth Resources Observation and Science (EROS) Center |
| Description | 2 p. |
| Online Only (Y/N) | Y |