

Wisconsin and Landsat
Links
- Document: Report (6.65 MB pdf) , HTML , XML
- Download citation as: RIS | Dublin Core
Abstract
Wisconsin could be called a State of icons, and many of the icons can trace their roots to the abundant resources within its four borders. Big beer companies in Milwaukee that began in the 1800s made their beer from water from nearby lakes and rivers, kept it cool with ice from those same sources, and stored it in containers made of harvested wood from State forests. Dairy and cheese factories rely on milk from dairy farms with fields and pastures and generate billions in revenue for the State’s economy. The Wisconsin Dells, Door County, and the Northwoods draw tourists with their natural beauty and recreation opportunities.
Wisconsin contains more than 17 million acres of hardwood and coniferous forest, much of it on land reforested since the large-scale timber cutting of the 1800s and early 1900s. The Badger State boasts nearly 15,000 lakes within its borders and touches two Great Lakes—a bit of Lake Superior and a considerable length of western Lake Michigan. Wisconsin ranks second in the Nation for milk production, but it ranks first for cheese, cranberries, snap beans, and milk goats (U.S. Department of Agriculture, 2021).
Data and imagery from Landsat Earth observation systems assist agencies and land managers in monitoring these resources and planning for future management. Here are several ways Landsat benefits Wisconsin.
Monitoring Crops and Other Land Cover
Agriculture was one of the first areas of interest for Landsat users and remains so today. Crop monitoring helps predict crop yields and the corresponding food supply, and Landsat contributes information to the U.S. Department of Agriculture’s annual Cropland Data Layer (U.S. Department of Agriculture, 2022). Landsat data also are valuable for mapping other types of land cover. The Wisconsin Department of Natural Resources (DNR) collaborated with the University of Wisconsin-Madison and the Wisconsin State Cartographer’s Office to update its 1990s land cover information with data from 2010 to 2014. Both versions were based on Landsat imagery. The updated land cover data, called Wiscland 2, was deemed necessary to provide a level of detail that national land cover databases cannot provide for purposes that range from species management and watershed planning to fire risk assessment and property management (Wisconsin DNR, 2016).
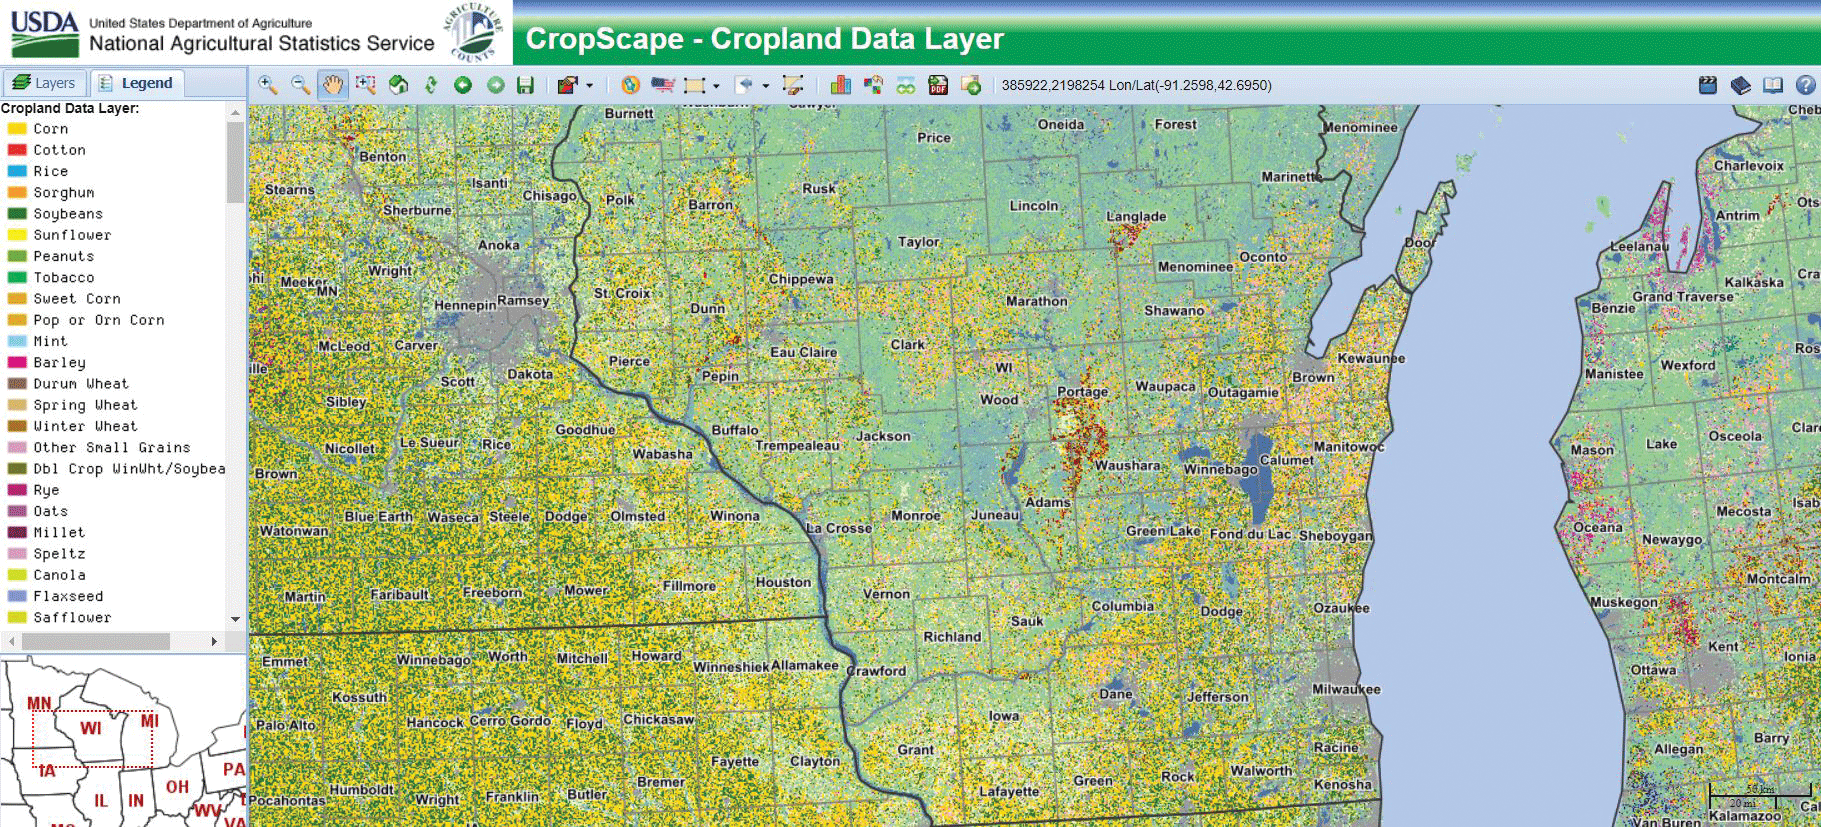
Wisconsin (center) has a variety of land cover, including forests (medium green), wetlands/lakes (blue shades), and developed areas (gray). Dominant crops by acreage include corn, soybeans, hay, wheat, oats, and rye. Image credit: U.S. Department of Agriculture.
Watching Water Quality
The Wisconsin DNR has used Landsat data for more than 20 years for greater efficiency and cost-effectiveness in assessing water quality in the State’s abundant lakes. Remote sensing helps officials identify changes in water quality, detect harmful algal blooms that pose health risks to humans and animals, and analyze the effects of land cover changes on nearby waterbodies. The Wisconsin DNR uses Landsat routinely to gather data on water clarity from thousands of Wisconsin lakes and assess water quality trends, in conjunction with the Citizen Lake Monitoring Network’s on-the-ground volunteer efforts to measure water clarity and help calibrate the satellite data (Wisconsin DNR, 2022).
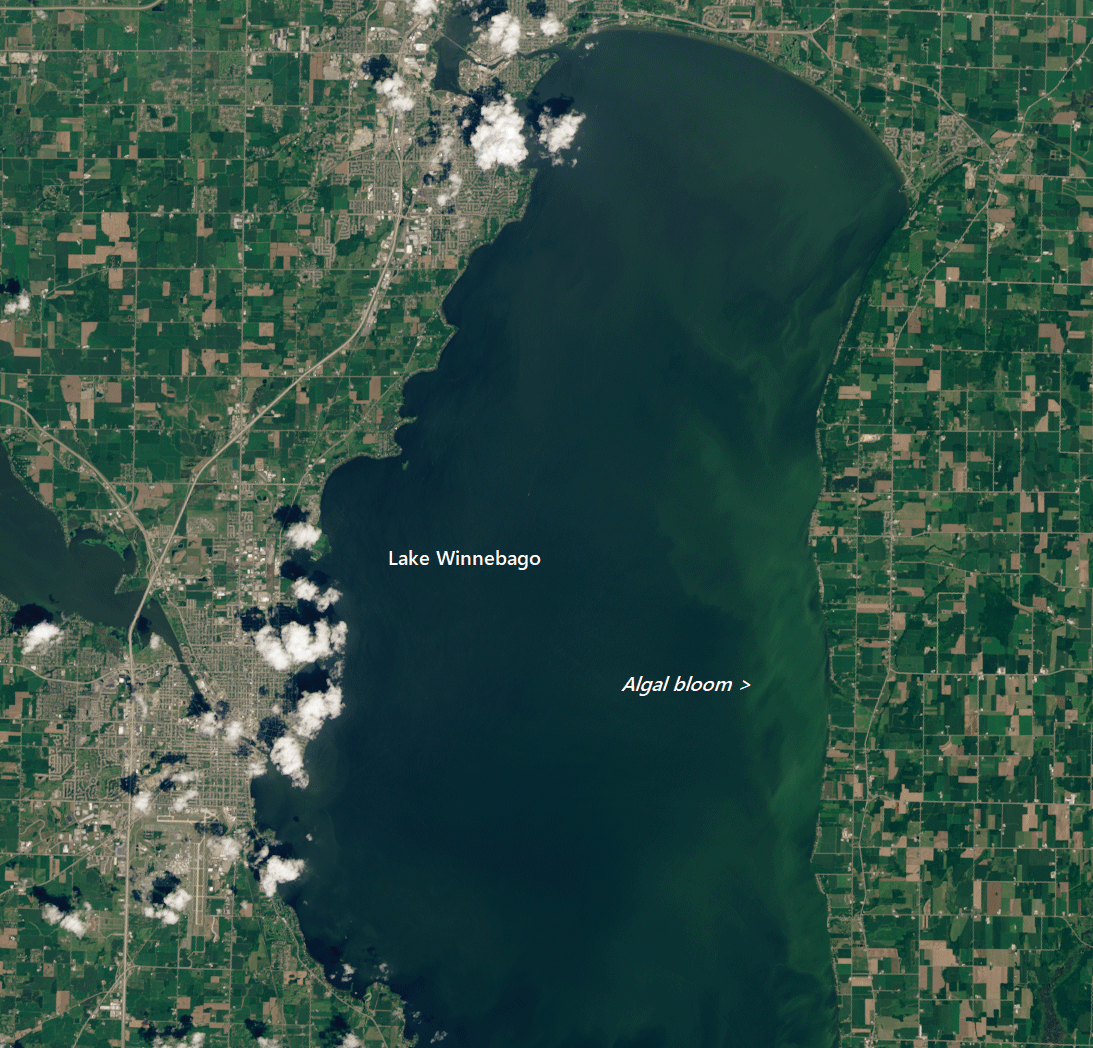
An algal bloom is visible on the eastern side of Lake Winnebago in this Landsat 8 image from June 26, 2016. Image credit: U.S. Geological Survey.
Determining Urban Heat Islands
Landsat’s land surface temperature and land cover data have proven useful to measure and mitigate cities’ urban heat island (UHI) effects in areas that have more impervious surfaces, such as buildings and pavement, and fewer natural features. These characteristics contribute to urban temperatures that exceed those of surrounding areas and can contribute to heat-related illnesses and deaths. UHI efforts often focus on large cities, but to get a perspective of UHI in Midwestern cities closely surrounded by agriculture, University of Wisconsin researchers looked at 8 years of summertime ground-sensor and archived Landsat temperature data for the urban and rural areas around Madison. They examined trends of UHI timing and location, along with the variability in land surface temperature of agricultural lands during the growing season (Berg and Kucharik, 2021).

Urban heat islands are not exclusive to the largest cities. The Wisconsin State capital of Madison was the focus of a study of temperature differences among urban and agricultural areas. Photograph credit: Ron Przysucha, U.S. Department of State.
National Land Imaging Program Benefits—Wisconsin
The U.S. Geological Survey (USGS) National Land Imaging Program provides a wide range of satellite imagery and other remotely sensed and geospatial data to Government, commercial, academic, and public users. Those users can get worldwide access to Landsat satellite data through the National Land Imaging Program-funded USGS Earth Resources Observation and Science (EROS) Center.
Landsat—Critical Information Infrastructure for the Nation
Landsat is the most widely used land remote sensing data source within Federal civilian agencies. Local, State, Tribal, and Federal agencies use Landsat to monitor and forecast a wide range of land surface phenomena. Information from Landsat contributes to day-to-day decisions on land, water, and resource use that protect life and property; safeguard the environment; advance science, technology, and education; support climate change resiliency; and grow the U.S. economy. Landsat’s imagery provides a landscape-level view of land surface, inland lake, and coastal processes, both natural and human-induced. Landsat enables us to better understand the scope, nature, and speed of change to the natural and built environment.
Businesses draw upon Landsat data to provide customer-specific applications to improve logistics, resource allocation, and investment decisions. Commercial space imaging firms leverage Landsat data to refine product offerings and support new information services. A 2017 USGS study determined the total annual economic benefit of Landsat data in the United States. to be $2.06 billion, far surpassing its development and operating costs (Straub and others, 2019).
Landsat 8 and Landsat 9 provide 8-day repeat coverage of the Earth’s land surfaces. The National Aeronautics and Space Administration (NASA) and the USGS are currently reviewing the findings from a joint Architecture Study Team, which will inform the design and implementation approach for Landsat Next, the follow-on mission to Landsat 9. Landsat 9 and its successors are planned to provide a sustainable, space-based system to extend the 50-year Landsat series of high-quality global land imaging measurements—the world’s longest time series of the Earth’s land surface.
The long-term availability of consistent and accurate Landsat data, combined with a no-cost data policy, allows users to analyze extensive geographic areas and better understand and manage long-term trends in land surface change. New cloud computing and data analytics technologies use Landsat data in a wide range of decision-support tools for Government and industry. Much like global positioning systems and weather data, Landsat data are used every day to help us better understand our dynamic planet.
References Cited
Berg, E., and Kucharik, C., 2021, The dynamic relationship between air and land surface temperature within the Madison, Wisconsin, urban heat island: Remote Sensing (Basel), v. 14, no. 1, art. 165, 19 p., accessed April 22, 2022, at https://doi.org/10.3390/rs14010165.
Straub, C.L., Koontz, S.R., and Loomis, J.B., 2019, Economic valuation of Landsat imagery: U.S. Geological Survey Open-File Report 2019–1112, 13 p., accessed April 8, 2022, at https://doi.org/10.3133/ofr20191112.
U.S. Department of Agriculture, 2021, 2021 Wisconsin Agricultural Statistics: U.S. Department of Agriculture, National Agricultural Statistics Service report, accessed July 18, 2022, at https://www.nass.usda.gov/Statistics_by_State/Wisconsin/Publications/Annual_Statistical_Bulletin/2021AgStats-WI.pdf.
U.S. Department of Agriculture, 2022, CropScape and Cropland Data Layers—FAQs: U.S. Department of Agriculture, National Agricultural Statistics Service web page, accessed April 21, 2022, at https://www.nass.usda.gov/Research_and_Science/Cropland/sarsfaqs2.php#Section3_17.0.
Wisconsin Department of Natural Resources [DNR], 2016, Wiscland 2 land cover user guide: Wisconsin DNR, 83 p., accessed April 21, 2022, at https://p.widencdn.net/8ghipa/Wiscland_2_User_Guide_September_2016.
Wisconsin Department of Natural Resources [DNR], 2022, Remote sensing of water quality: Wisconsin DNR web page, accessed April 22, 2022, at https://dnr.wisconsin.gov/topic/lakes/clmn/remotesensing.
For additional information on Landsat, please contact:
Program Coordinator
USGS National Land Imaging Program
12201 Sunrise Valley Drive
Reston, VA 20192
703–648–4567
The Landsat series is a joint effort of USGS and NASA. NASA develops and launches the spacecraft; USGS manages satellite operations, ground reception, data archiving, product generation, and data distribution. Funding for the National Land Imaging Program’s Landsat operations and data management is provided through the USGS.
Disclaimers
Any use of trade, firm, or product names is for descriptive purposes only and does not imply endorsement by the U.S. Government.
Although this information product, for the most part, is in the public domain, it also may contain copyrighted materials as noted in the text. Permission to reproduce copyrighted items must be secured from the copyright owner.
Suggested Citation
U.S. Geological Survey, 2022, Wisconsin and Landsat: U.S. Geological Survey Fact Sheet 2022–3055, 2 p., https://doi.org/10.3133/fs20223055.
ISSN: 2327-6932 (online)
ISSN: 2327-6916 (print)
Study Area
| Publication type | Report |
|---|---|
| Publication Subtype | USGS Numbered Series |
| Title | Wisconsin and Landsat |
| Series title | Fact Sheet |
| Series number | 2022-3055 |
| DOI | 10.3133/fs20223055 |
| Publication Date | July 20, 2022 |
| Year Published | 2022 |
| Language | English |
| Publisher | U.S. Geological Survey |
| Publisher location | Reston, VA |
| Contributing office(s) | Earth Resources Observation and Science (EROS) Center |
| Description | 2 p. |
| Country | United States |
| State | Wisconsin |
| Online Only (Y/N) | N |