

Iowa and Landsat
Links
- Document: Report (4.11 MB pdf) , HTML , XML
- Download citation as: RIS | Dublin Core
Abstract
Iowa is famous for plenty of reasons—its State Fair butter sculptures, its first-in-the-Nation presidential caucuses, and the Iowa Hawkeyes football team, whose mascot doubles as the State nickname—but “corn” might be the first word to cross the mind of a non-Iowan.
Iowa consistently leads the United States in corn production and in the production of hogs, which in turn consume a sizable share of the corn grown there. Corn also drives Iowa’s ethanol industry, which put nearly 4.5 billion gallons of fuel into the supply chain in 2020—more than any other State (Economic Research Service, 2022).
Iowa owes its agricultural dominance largely to its fertile soils, making land management decisions critical to its future. Changes to land cover, more intensive land use, unusual precipitation patterns, and temperature changes, coupled with an influx of extreme weather events—some of which can be tied to or exacerbated by climate change—have placed pressure on the productive farm ground of Iowa’s 99 counties.
Landsat Program satellites can be especially useful in the monitoring and management of croplands across the United States. Backed by a 50-year record of Earth surface change, Landsat satellites can detect the details of vegetation health by peering into the infrared and near-infrared parts of the electromagnetic spectrum. Iowa has long served as a proving ground for Landsat-based agricultural research, and its residents and leaders have benefited from that work. Here are a few examples of how the Landsat Program benefits Iowa.
Crop Monitoring
Although corn is its top crop, Iowa also is the second-leading producer of soybeans. These production tallies come from the U.S. Department of Agriculture’s National Agriculture Statistics Service, and its Cropland Data Layer uses Landsat satellite data to map crop production nationwide at the field scale. The value of Landsat for producers runs deeper than crop mapping, however. Data from Landsat can be used to monitor crop health and drought stress (Xu and others, 2020), assess yield variability (Gao and others, 2018), and track water use through estimations of evapotranspiration, or the combined rate of water loss by evaporation from the Earth’s surface and transpiration from the leaves of plants (Anderson and others, 2012). Landsat’s landscape-scale 30-meter resolution, unparalleled historical record, and wealth of spectral data contribute to Iowa’s understanding of agricultural production trends and offer actionable information for producers and decision makers.
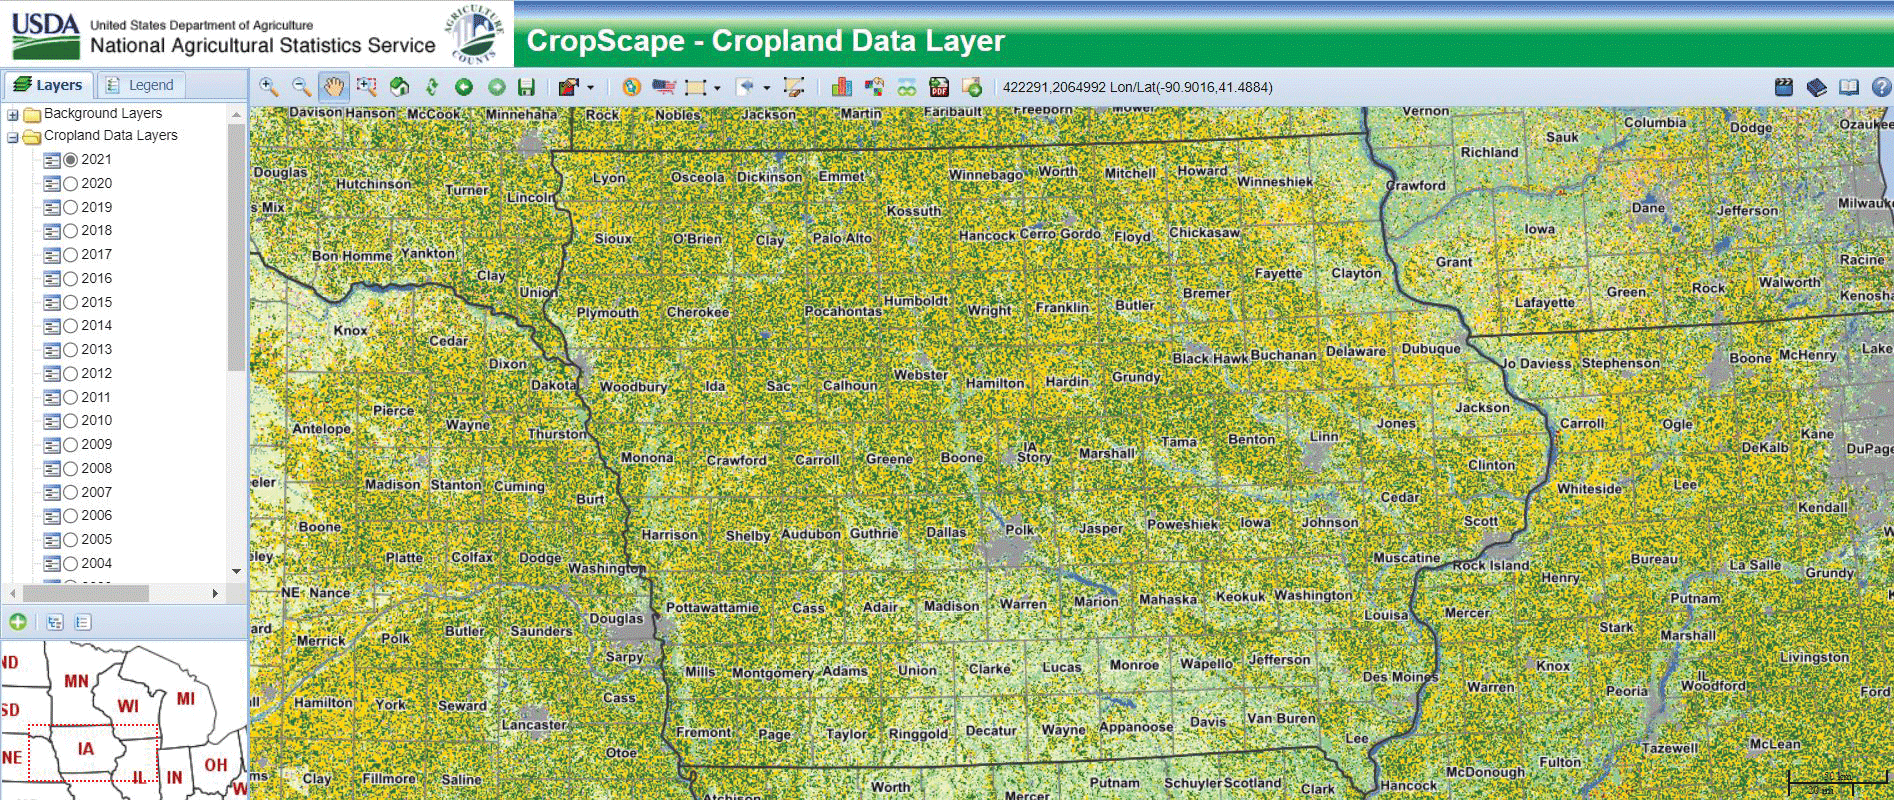
Landsat helps contribute to the data used by the U.S. Department of Agriculture’s annual Cropland Data Layer. Corn (in gold) and soybeans (in dark green) dominate Iowa’s cropland. Image credit: U.S. Department of Agriculture.
Assessing Storm Damage
Iowa’s landlocked location shields it from the ravages of sea level rise and hurricane storm surge, but extreme weather events of a different sort are fairly common. In August 2020, for example, nearly one-third of the State saw heavy damage after an extraordinary derecho storm tore through its center. Derechos are wide, sustained storms often accompanied by hurricane-level winds. Gusts as strong as 140 miles per hour flattened fields and left tens of thousands of residents without electricity, marking one of the most severe derechos in recent memory. Landsat imagery offered visual evidence of the damage in the weeks after the event, just as it can help characterize flooding and tornado damage. The derecho imagery supported a 2020 damage assessment from NASA Harvest that noted an affected area of about 1.99 million acres of corn and 0.6 million acres of soybeans (Hosseini and others, 2020).
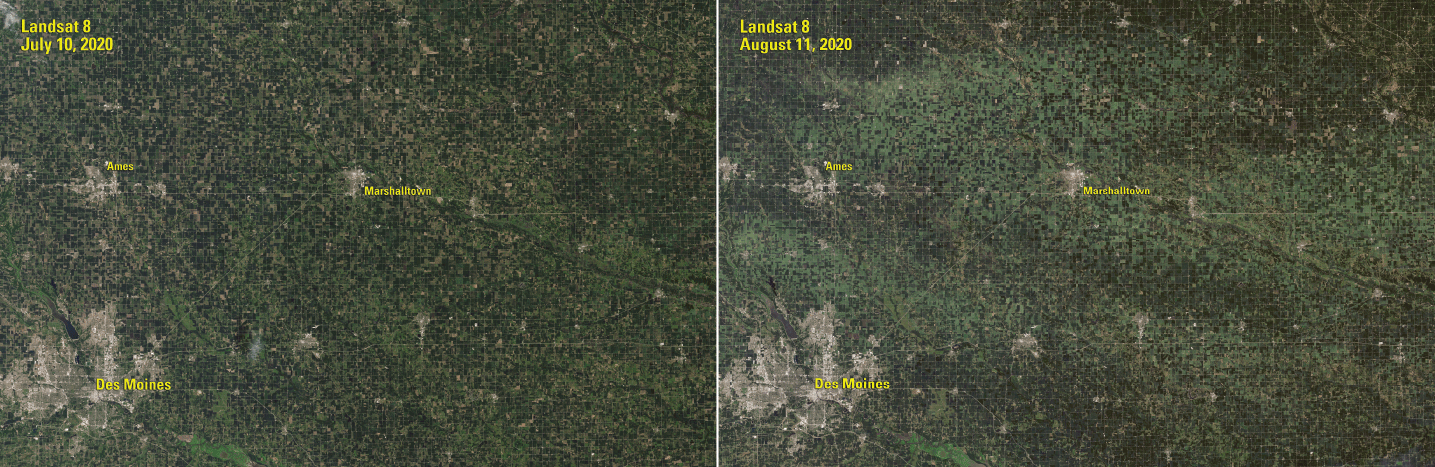
The image on the right shows the cropland effects of the derecho that hit Iowa on August 10–11, compared to an image from 1 month before. Wind-damaged crops are shown as lighter green.
Tracking Land Use, Land Change
Iowa’s waterways, lakes, and grasslands draw visitors and sustain a host of prairie wildlife. Cropland conversions and crop management practices can affect ecosystems, wetland extent and health, and water quality. Landsat satellites, with repeat observations every 8–16 days, serve as the backbone of efforts to track vital changes in land use across Iowa. Landsat observations have been used to measure the environmental return on investment of Federal programs like the Conservation Reserve Program (Gallant and others, 2011), the effect of high prices on crop production acres and soil carbon sequestration (Stern and others, 2012), and the water quality concerns associated with fertilizer application (Taylor and Heal, 2021). Such studies aid in understanding Iowa’s natural resources and offer reliable scientific guidance for policy discussions of issues that affect Iowans every day.
National Land Imaging Program Benefits—Iowa
The U.S. Geological Survey (USGS) National Land Imaging Program provides a wide range of satellite imagery and other remotely sensed and geospatial data to Government, commercial, academic, and public users. Those users can get worldwide access to Landsat satellite data through the National Land Imaging Program-funded USGS Earth Resources Observation and Science (EROS) Center.
Landsat—Critical Information Infrastructure for the Nation
Landsat is the most widely used land remote sensing data source within Federal civilian agencies. Local, State, Tribal, and Federal agencies use Landsat to monitor and forecast a wide range of land surface phenomena. Information from Landsat contributes to day-to-day decisions on land, water, and resource use that protect life and property; safeguard the environment; advance science, technology, and education; support climate change resiliency; and grow the U.S. economy. Landsat’s imagery provides a landscape-level view of land surface, inland lake, and coastal processes, both natural and human-induced. Landsat enables us to better understand the scope, nature, and speed of change to the natural and built environment.
Businesses draw upon Landsat data to provide customer-specific applications to improve logistics, resource allocation, and investment decisions. Commercial space imaging firms leverage Landsat data to refine product offerings and support new information services. A 2017 USGS study determined the total annual economic benefit of Landsat data in the United States. to be $2.06 billion, far surpassing its development and operating costs (Straub and others, 2019).
Landsat 8 and Landsat 9 provide 8-day repeat coverage of the Earth’s land surfaces. The National Aeronautics and Space Administration (NASA) and the USGS are currently reviewing the findings from a joint Architecture Study Team, which will inform the design and implementation approach for Landsat Next, the follow-on mission to Landsat 9. Landsat 9 and its successors are planned to provide a sustainable, space-based system to extend the 50-year Landsat series of high-quality global land imaging measurements—the world’s longest time series of the Earth’s land surface.
The long-term availability of consistent and accurate Landsat data, combined with a no-cost data policy, allows users to analyze extensive geographic areas and better understand and manage long-term trends in land surface change. New cloud computing and data analytics technologies use Landsat data in a wide range of decision-support tools for Government and industry. Much like global positioning systems and weather data, Landsat data are used every day to help us better understand our dynamic planet.
References Cited
Anderson, M.C., Allen, R.G., Morse, A., and Kustas, W.P., 2012, Use of Landsat thermal imagery in monitoring evapotranspiration and managing water resources: Remote Sensing of Environment, v. 122, p. 50–65. [Also available at https://doi.org/10.1016/j.rse.2011.08.025.]
Economic Research Service, 2022, U.S. bioenergy statistics: Economic Research Service web page, accessed January 25, 2022, at https://www.ers.usda.gov/data-products/u-s-bioenergy-statistics/.
Gallant, A.L., Sadinski, W., Roth, M.F., and Rewa, C.A., 2011, Changes in historical Iowa land cover as context for assessing the environmental benefits of current and future conservation efforts on agricultural lands: Journal of Soil and Water Conservation, v. 66, no. 3, p. 67A–77A. [Also available at https://doi.org/10.2489/jswc.66.3.67A.]
Gao, F., Anderson, M., Daughtry, C., and Johnson, D., 2018, Assessing the variability of corn and soybean yields in central Iowa using high spatiotemporal resolution multi-satellite imagery: Remote Sensing (Basel), v. 10, no. 9, art. 1489, 22 p., accessed July 19, 2022, at https://doi.org/10.3390/rs10091489.
Hosseini, M., Kerner, H.R., Sahajpal, R., Puricelli, E., Lu, Y.-H., Lawal, A.F., Humber, M.L., Mitkish, M., Meyer, S., and Becker-Reshef, I., 2020, Evaluating the impact of the 2020 Iowa derecho on corn and soybean fields using synthetic aperture radar: Remote Sensing (Basel), v. 12, no. 23, art. 3878, 16 p., accessed July 19, 2022, at https://doi.org/10.3390/rs12233878.
Stern, A.J., Doraiswamy, P.C., and Hunt, E.R., Jr., 2012, Changes of crop rotation in Iowa determined from the United States Department of Agriculture, National Agricultural Statistics Service cropland data layer product: Journal of Applied Remote Sensing, v. 6, no. 1, p. 063590–063591. [Also available at https://doi.org/10.1117/1.JRS.6.063590.]
Straub, C.L., Koontz, S.R., and Loomis, J.B., 2019, Economic valuation of Landsat imagery: U.S. Geological Survey Open-File Report 2019–1112, 13 p., accessed January 13, 2022, at https://doi.org/10.3133/ofr20191112.
Taylor, C.A., and Heal, G., 2021, Fertilizer and algal blooms—A satellite approach to assessing water quality: National Bureau of Economic Research, 26 p., accessed July 19, 2022, at https://www.nber.org/system/files/chapters/c14615/c14615.pdf.
Xu, C., Qu, J.J., Hao, X., Cosh, M.H., Zhu, Z., and Gutenberg, L., 2020, Monitoring crop water content for corn and soybean fields through data fusion of MODIS and Landsat measurements in Iowa: Agricultural Water Management, v. 227, art. 105844, 10 p., accessed July 19, 2022, at https://doi.org/10.1016/j.agwat.2019.105844.
For additional information on Landsat, please contact:
Program Coordinator
USGS National Land Imaging Program
12201 Sunrise Valley Drive
Reston, VA 20192
703–648–4567
The Landsat series is a joint effort of USGS and NASA. NASA develops and launches the spacecraft; USGS manages satellite operations, ground reception, data archiving, product generation, and data distribution. Funding for the National Land Imaging Program’s Landsat operations and data management is provided through the USGS.
Disclaimers
Any use of trade, firm, or product names is for descriptive purposes only and does not imply endorsement by the U.S. Government.
Although this information product, for the most part, is in the public domain, it also may contain copyrighted materials as noted in the text. Permission to reproduce copyrighted items must be secured from the copyright owner.
Suggested Citation
U.S. Geological Survey, 2022, Iowa and Landsat: U.S. Geological Survey Fact Sheet 2022–3061, 2 p., https://doi.org/10.3133/fs20223061.
ISSN: 2327-6932 (online)
ISSN: 2327-6916 (print)
Study Area
| Publication type | Report |
|---|---|
| Publication Subtype | USGS Numbered Series |
| Title | Iowa and Landsat |
| Series title | Fact Sheet |
| Series number | 2022-3061 |
| DOI | 10.3133/fs20223061 |
| Publication Date | July 20, 2022 |
| Year Published | 2022 |
| Language | English |
| Publisher | U.S. Geological Survey |
| Publisher location | Reston, VA |
| Contributing office(s) | Earth Resources Observation and Science (EROS) Center |
| Description | 2 p. |
| Country | United States |
| State | Iowa |
| Online Only (Y/N) | N |