

Tennessee and Landsat
Links
- Document: Report (2.98 MB pdf) , HTML , XML
- Download citation as: RIS | Dublin Core
Abstract
From the flat, rich soil of western Tennessee to the Appalachian Mountains in the east, and rolling hills in between, “the Volunteer State” enjoys a wealth of natural resources.
The Tennessee, Cumberland, and Mississippi Rivers supply economically crucial navigation routes, along with recreation for residents and visitors. Additionally, 14 million acres of hardwood and softwood forests cover roughly one-half of the State, contributing an estimated $24 billion and nearly 100,000 jobs to Tennessee’s economy (Tennessee Department of Agriculture, 2017). Within a span of more than 400 miles, the State’s diverse agricultural products include cotton, corn, soybeans, poultry, horses, cattle, goats, hay, vegetables, nursery crops, and tobacco.
Energy production is important to Tennessee and the region, and power sources range from coal and nuclear to hydroelectric sources. Tourism also is a key industry, and music attractions and historical sites are balanced by natural features such as the Great Smoky Mountains National Park, which recorded 14.1 million visits and ranked second for most visited National Park Service site in the United States in 2021 (National Park Service, 2022).
Landsat imagery’s broad geographic scale and rich historical archive have proven useful to land managers and State agencies for monitoring natural resources. Here are several ways Landsat has benefited Tennessee.
Helping with Crop Estimates
Landsat data form a crucial component of the U.S. Department of Agriculture’s Cropland Data Layer, which maps crop type, acreage, and yield for fields in Tennessee and other States. The annual Cropland Data Layer reveals what is planted, how much, and its location and land use change. This information helps agricultural producers and others in the industry make prudent decisions (U.S. Department of Agriculture, 2022). University researchers also demonstrated the ability of Landsat to model predictions of cotton yield based on greenness and wetness indices in a study of an irrigated western Tennessee field (Haghverdi and others, 2018).
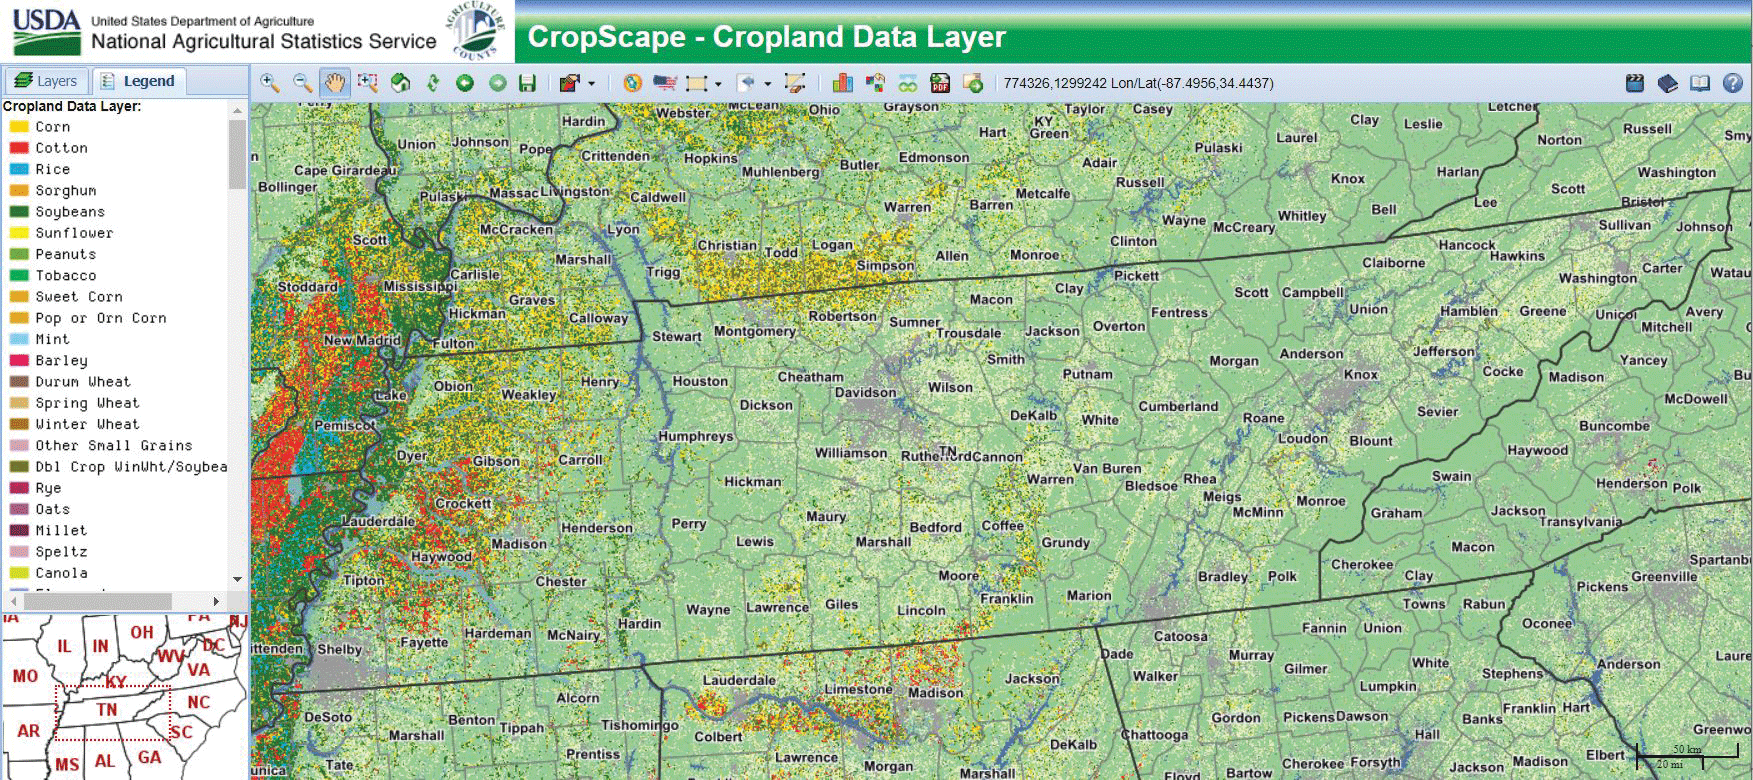
A 2021 Cropland Data Layer map of Tennessee (stretching across the middle) includes cotton (red) in the western part, along with corn (gold), soybeans (dark green), grass and pasture (light yellow green), and forest (medium green). Gray and dark blue represent developed areas and water, respectively. Image credit: U.S. Department of Agriculture.
Monitoring Water Safety
Landsat’s ability to assess and monitor resources extends to waterbodies; for example, satellite data can support public safety measures by helping to identify harmful algal blooms. Researchers from the University of Tennessee at Chattanooga and the Hamilton County Geospatial Technology Department recently used Landsat surface reflectance data to estimate turbidity in the Tennessee River, an important water supply for residents of cities such as Chattanooga. Turbidity is an indicator of water clarity and quality. Storm water runoff can carry excess nutrients and chemicals from urban areas like Chattanooga into the river. A turbidity estimation model can help city officials continually and effectively monitor water quality (Hossain and others, 2021).
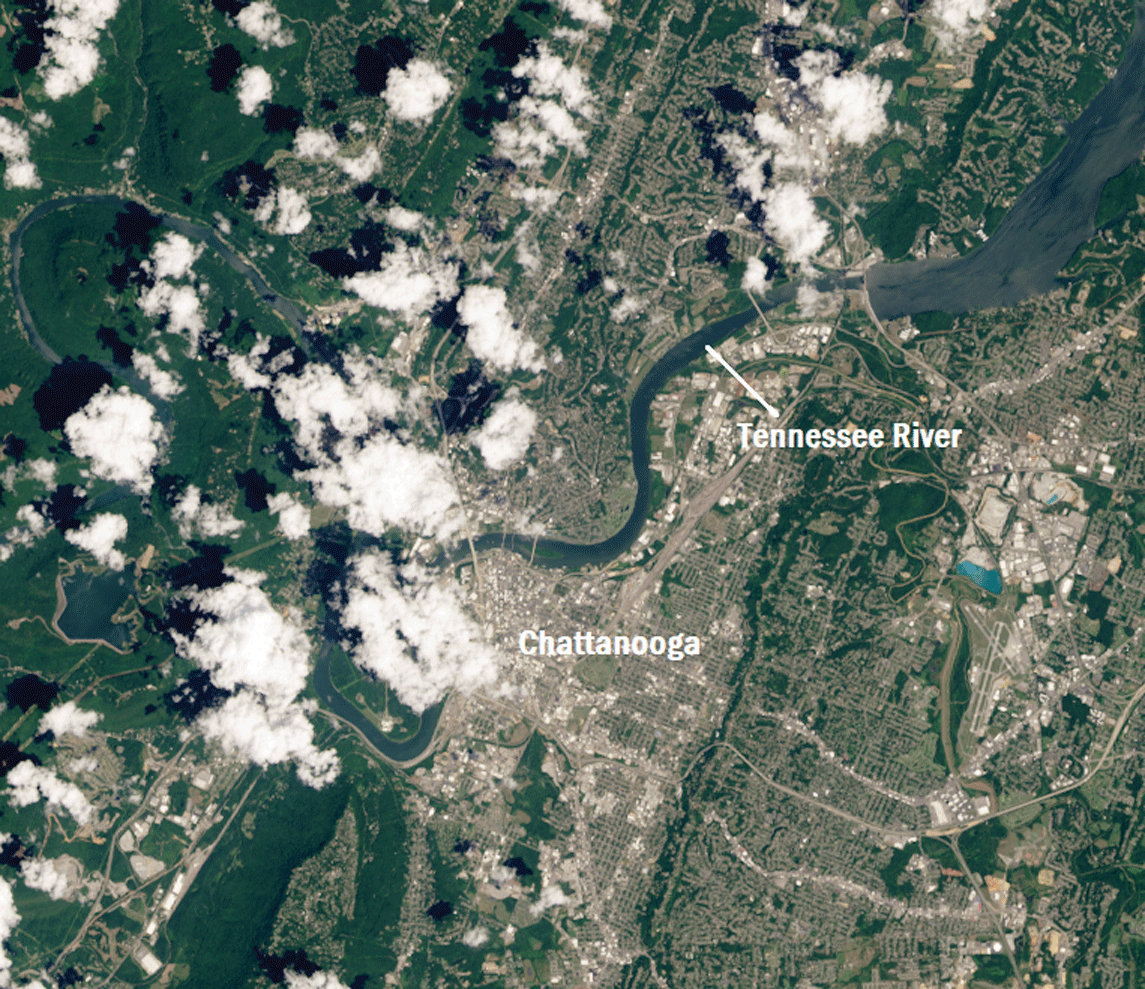
This Landsat image, dotted with clouds, shows Chattanooga and the Tennessee River on August 15, 2019, one of three dates used in a turbidity study of the Tennessee River. Image credit: U.S. Geological Survey.
Mapping Forest Trends
With its 30-meter resolution and 50 years of imagery, Landsat is ideal for viewing changes in landscapes such as forests over time. To help understand trends in forest cover change for southern yellow pine forests in a swath of east-central Tennessee, Tennessee State University researchers analyzed Landsat data from 1988, 1999, and 2016. Mapping and monitoring Pinus taeda L. (loblolly pine), Pinus echinata Mill. (shortleaf pine), and Pinus virginiana Mill. (Virginia pine) over several decades yielded information about gains and losses that can help with the management of these commonly harvested species (Akumu and others, 2021).

Forested areas in south-central Tennessee. Photograph credit: National Park Service.
National Land Imaging Program Benefits—Tennessee
The U.S. Geological Survey (USGS) National Land Imaging Program provides a wide range of satellite imagery and other remotely sensed and geospatial data to Government, commercial, academic, and public users. Those users can get worldwide access to Landsat satellite data through the National Land Imaging Program-funded USGS Earth Resources Observation and Science (EROS) Center.
Landsat—Critical Information Infrastructure for the Nation
Landsat is the most widely used land remote sensing data source within Federal civilian agencies. Local, State, Tribal, and Federal agencies use Landsat to monitor and forecast a wide range of land surface phenomena. Information from Landsat contributes to day-to-day decisions on land, water, and resource use that protect life and property; safeguard the environment; advance science, technology, and education; support climate change resiliency; and grow the U.S. economy. Landsat’s imagery provides a landscape-level view of land surface, inland lake, and coastal processes, both natural and human-induced. Landsat enables us to better understand the scope, nature, and speed of change to the natural and built environment.
Businesses draw upon Landsat data to provide customer-specific applications to improve logistics, resource allocation, and investment decisions. Commercial space imaging firms leverage Landsat data to refine product offerings and support new information services. A 2017 USGS study determined the total annual economic benefit of Landsat data in the United States. to be $2.06 billion, far surpassing its development and operating costs (Straub and others, 2019).
Landsat 8 and Landsat 9 provide 8-day repeat coverage of the Earth’s land surfaces. The National Aeronautics and Space Administration (NASA) and the USGS are currently reviewing the findings from a joint Architecture Study Team, which will inform the design and implementation approach for Landsat Next, the follow-on mission to Landsat 9. Landsat 9 and its successors are planned to provide a sustainable, space-based system to extend the 50-year Landsat series of high-quality global land imaging measurements—the world’s longest time series of the Earth’s land surface.
The long-term availability of consistent and accurate Landsat data, combined with a no-cost data policy, allows users to analyze extensive geographic areas and better understand and manage long-term trends in land surface change. New cloud computing and data analytics technologies use Landsat data in a wide range of decision-support tools for Government and industry. Much like global positioning systems and weather data, Landsat data are used every day to help us better understand our dynamic planet.
References Cited
Akumu, C., Smith, R., and Haile, S., 2021, Mapping and monitoring the canopy cover and greenness of southern yellow pines (loblolly, shortleaf, and Virginia pines) in central-eastern Tennessee using multi-temporal Landsat satellite data: Forests, v. 12, no. 4, art. 499, 15 p., accessed May 10, 2022, at https://doi.org/10.3390/f12040499.
Haghverdi, A., Washington-Allen, R.A., and Leib, B.G., 2018, Prediction of cotton lint yield from phenology of crop indices using artificial neural networks: Computers and Electronics in Agriculture, v. 152, p. 186–197, accessed May 10, 2022, at https://doi.org/10.1016/j.compag.2018.07.021.
Hossain, A.K.M.A., Mathias, C., and Blanton, R., 2021, Remote sensing of turbidity in the Tennessee River using Landsat 8 satellite: Remote Sensing (Basel), v. 13, no. 18, art. 3785, 24 p., accessed May 10, 2022, at https://doi.org/10.3390/rs13183785.
National Park Service, 2022, About us—Visitation numbers: National Park Service web page, accessed July 19, 2022, at https://www.nps.gov/aboutus/visitation-numbers.htm.
Straub, C.L., Koontz, S.R., and Loomis, J.B., 2019, Economic valuation of Landsat imagery: U.S. Geological Survey Open-File Report 2019–1112, 13 p., accessed April 8, 2022, at https://doi.org/10.3133/ofr20191112.
Tennessee Department of Agriculture, 2017, Forestry: Tennessee Department of Agriculture web page, accessed May 6, 2022, at https://www.tn.gov/agriculture/forests.html#:~:text=Tennessee's%20forests%20cover%2014%20million,water%20control%20and%20natural%20heritage.
U.S. Department of Agriculture, 2022, CropScape and Cropland Data Layers—FAQs: U.S. Department of Agriculture, National Agricultural Statistics Service web page, accessed April 21, 2022, at https://www.nass.usda.gov/Research_and_Science/Cropland/sarsfaqs2.php#Section3_17.0.
For additional information on Landsat, please contact:
Program Coordinator
USGS National Land Imaging Program
12201 Sunrise Valley Drive
Reston, VA 20192
703–648–4567
The Landsat series is a joint effort of USGS and NASA. NASA develops and launches the spacecraft; USGS manages satellite operations, ground reception, data archiving, product generation, and data distribution. Funding for the National Land Imaging Program’s Landsat operations and data management is provided through the USGS.
Disclaimers
Any use of trade, firm, or product names is for descriptive purposes only and does not imply endorsement by the U.S. Government.
Although this information product, for the most part, is in the public domain, it also may contain copyrighted materials as noted in the text. Permission to reproduce copyrighted items must be secured from the copyright owner.
Suggested Citation
U.S. Geological Survey, 2022, Tennessee and Landsat: U.S. Geological Survey Fact Sheet 2022–3063, 2 p., https://doi.org/10.3133/fs20223063.
ISSN: 2327-6932 (online)
ISSN: 2327-6916 (print)
Study Area
| Publication type | Report |
|---|---|
| Publication Subtype | USGS Numbered Series |
| Title | Tennessee and Landsat |
| Series title | Fact Sheet |
| Series number | 2022-3063 |
| DOI | 10.3133/fs20223063 |
| Publication Date | July 20, 2022 |
| Year Published | 2022 |
| Language | English |
| Publisher | U.S. Geological Survey |
| Publisher location | Reston, VA |
| Contributing office(s) | Earth Resources Observation and Science (EROS) Center |
| Description | 2 p. |
| Country | United States |
| State | Tennessee |
| Online Only (Y/N) | N |