

Rhode Island and Landsat
Links
- Document: Report (4.14 MB pdf) , HTML , XML
- Download citation as: RIS | Dublin Core
Abstract
Rhode Island is an oasis of natural calm surrounded by heavily urbanized East Coast areas, which may explain why the smallest State in the United States is such a popular tourist destination for residents of New York, Pennsylvania, and New Jersey, or perhaps its popularity is a measure of the Ocean State’s abundant wildlife and picturesque views. Although small in land area, Rhode Island claims the largest estuary in New England in the 147-square-mile Narragansett Bay. Locals and visitors feast on clams caught in the bay, trek to glimpse shorebirds, or boat to 1 of 30 islands.
As with any coastal State, the natural wonders of Rhode Island face threats related to sea level rise and warming ocean temperatures. State agencies also work to fend off foes like the invasive Lymantria dispar (Linnaeus, 1758; spongy moth) and protect the forests that cover more than one-half of Rhode Island.
The USGS Landsat Program, with 50 years of recurring Earth observations from space, offers a unique and freely available public data source for the study of land and coastal change across Rhode Island and the United States. Here are just a few of the ways Landsat imagery has been used to benefit the State.
Tracking Coastal Change
Given the State’s extensive coastline, Rhode Island is particularly vulnerable to sea level rise. The Landsat archive can help States understand trends in coastal change. The National Oceanic and Atmospheric Administration’s Coastal Change Analysis Program, for example, uses Landsat-derived land cover information to catalog coastal landscapes across the United States every 3 years. Recently, researchers relied on the Landsat archive to build a more targeted algorithm for tracking change to coastal tidal wetlands across northern New England (Yang and others, 2022). The researchers determined that coastal vegetated wetlands across the region, including Rhode Island, declined at a rate of about 2.6 square kilometers per year between 1986 and 2020.
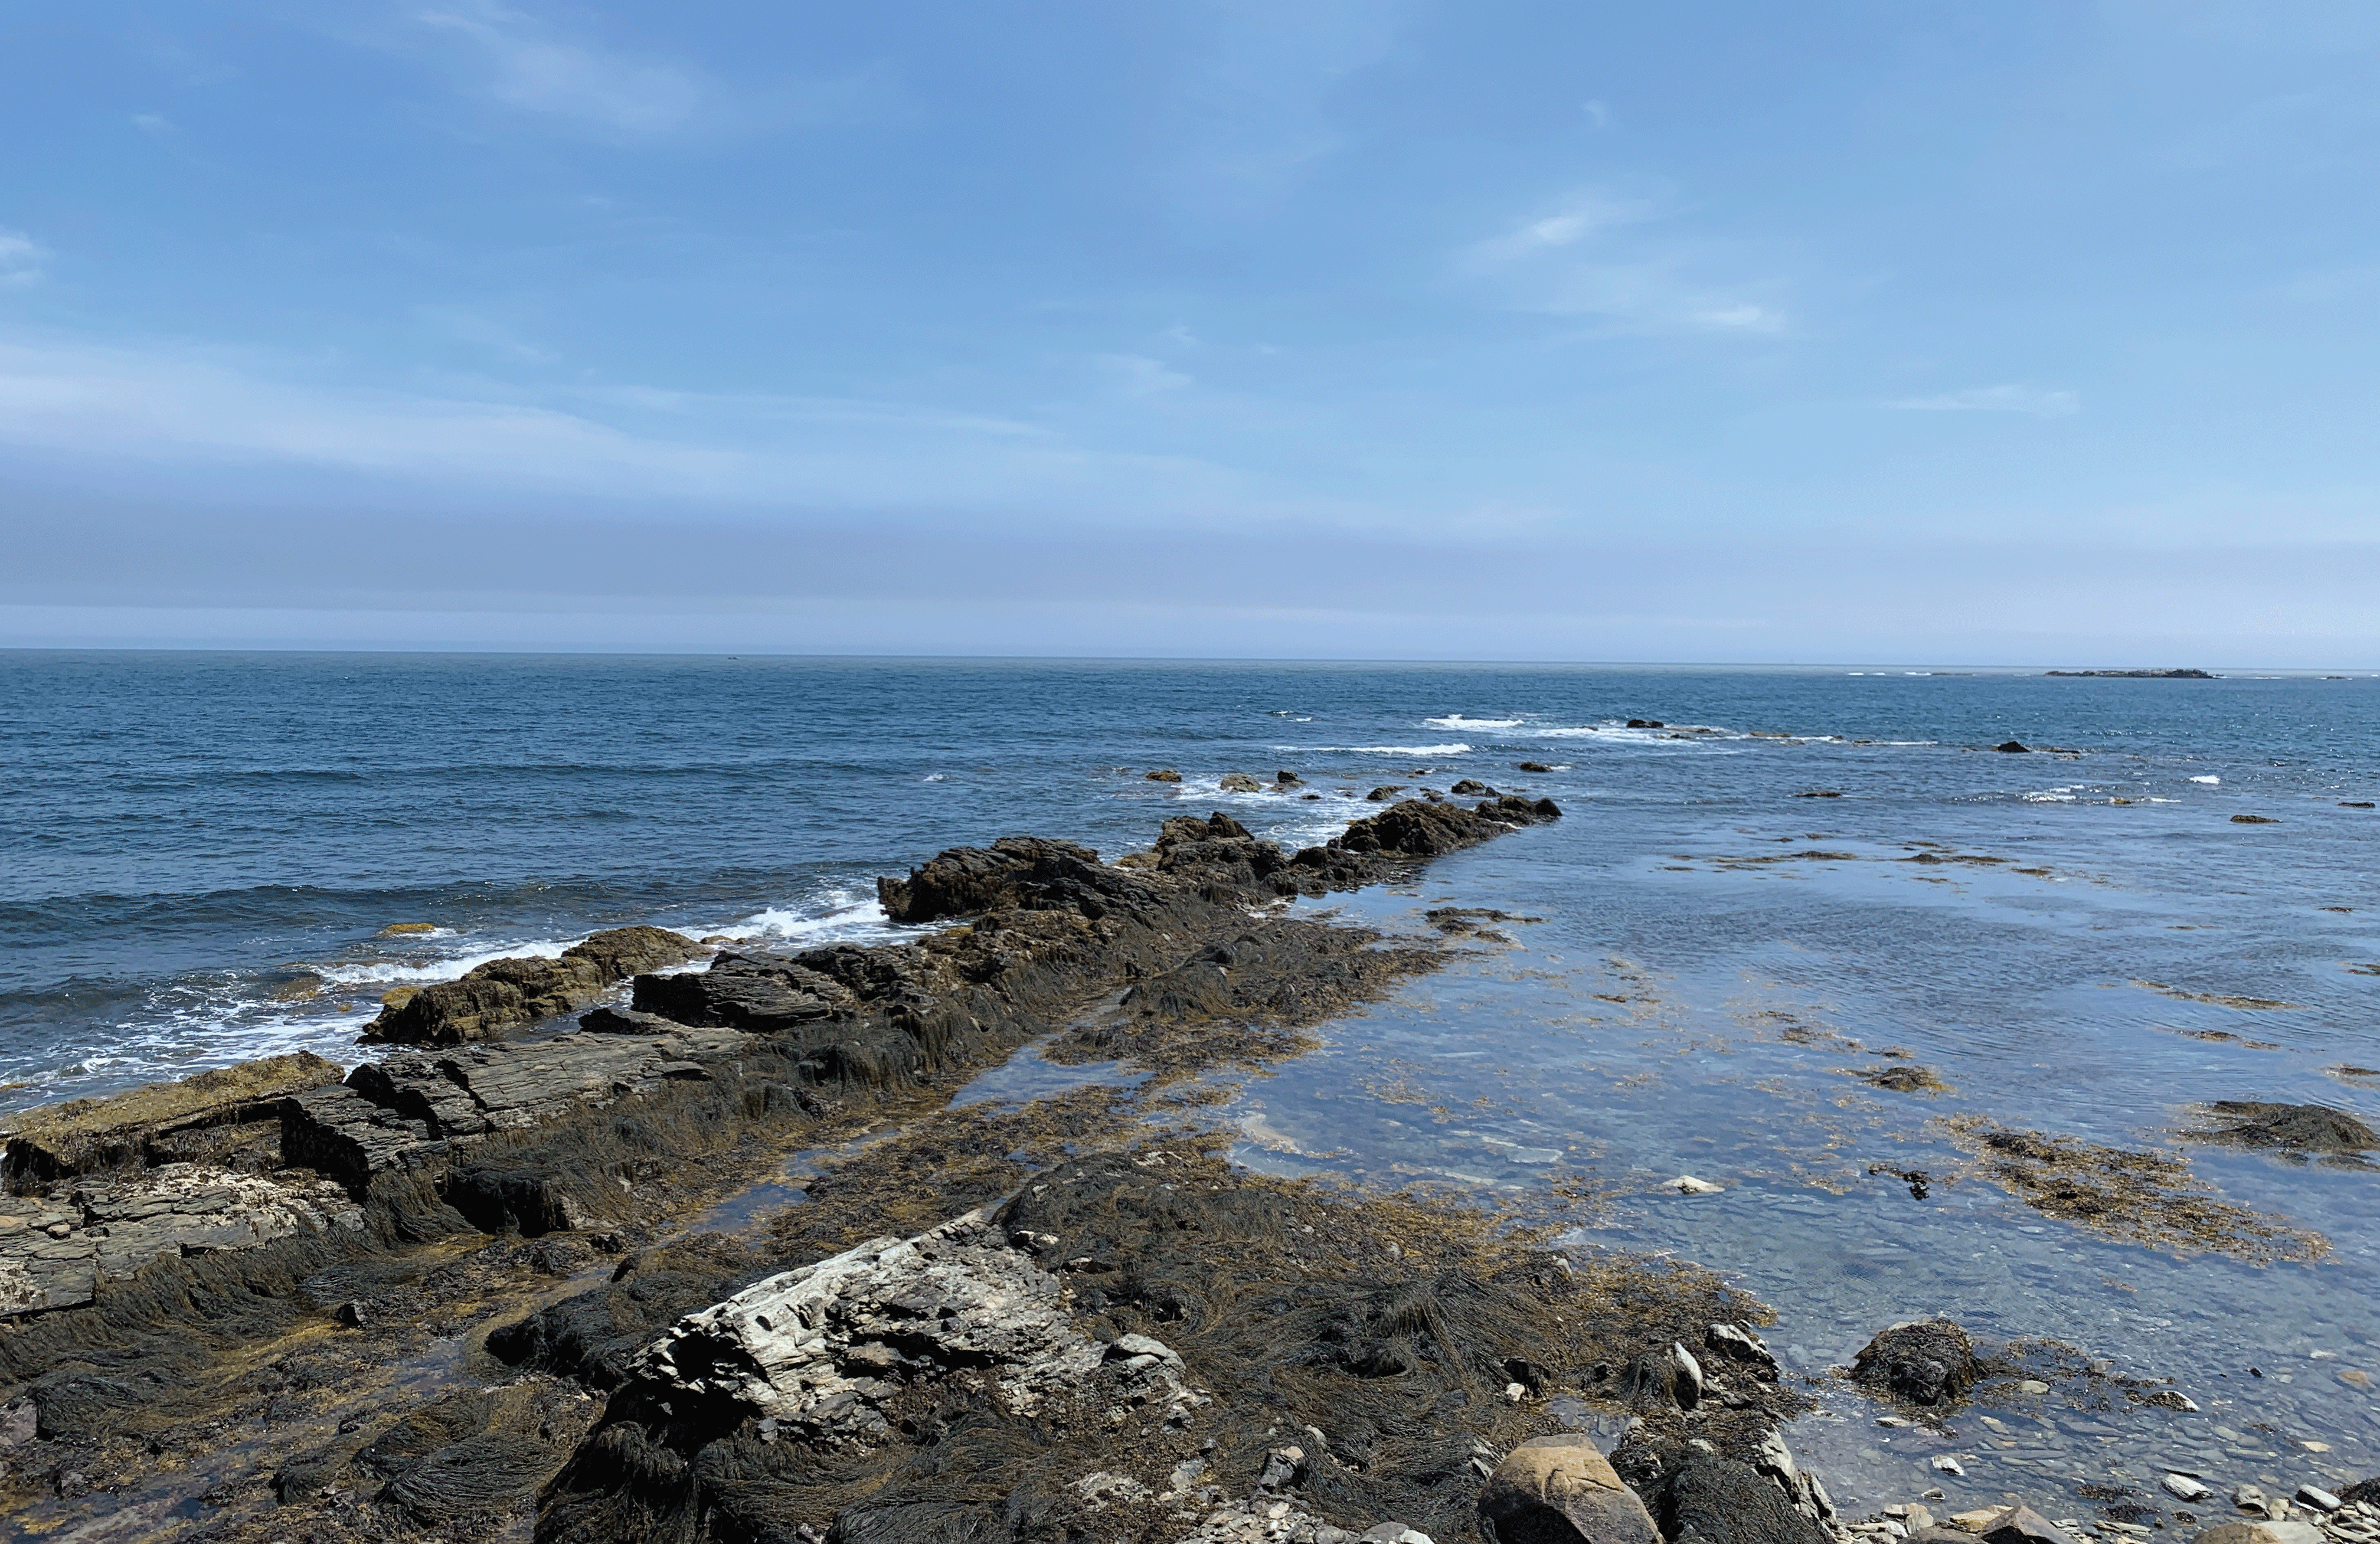
A rock jetty stretches out into the water at Bailey's Beach, Newport, Rhode Island. Photograph credit: Vanessa Baez, U.S. Geological Survey.
Watching the Forests from Above
With two orbiting satellites, Landsat continuously delivers imagery for every land surface on the globe every 8 days. The satellites peer beyond visible light to capture typically invisible evidence of vegetation health. Stretching back five decades, the Landsat historical archive provides a powerful tool for the study and management of forests. One research paper, for example, used Landsat imagery from 2015 to 2017 to determine that Rhode Island was the State hardest hit by a large spongy moth outbreak (Pasquarella and others, 2018).
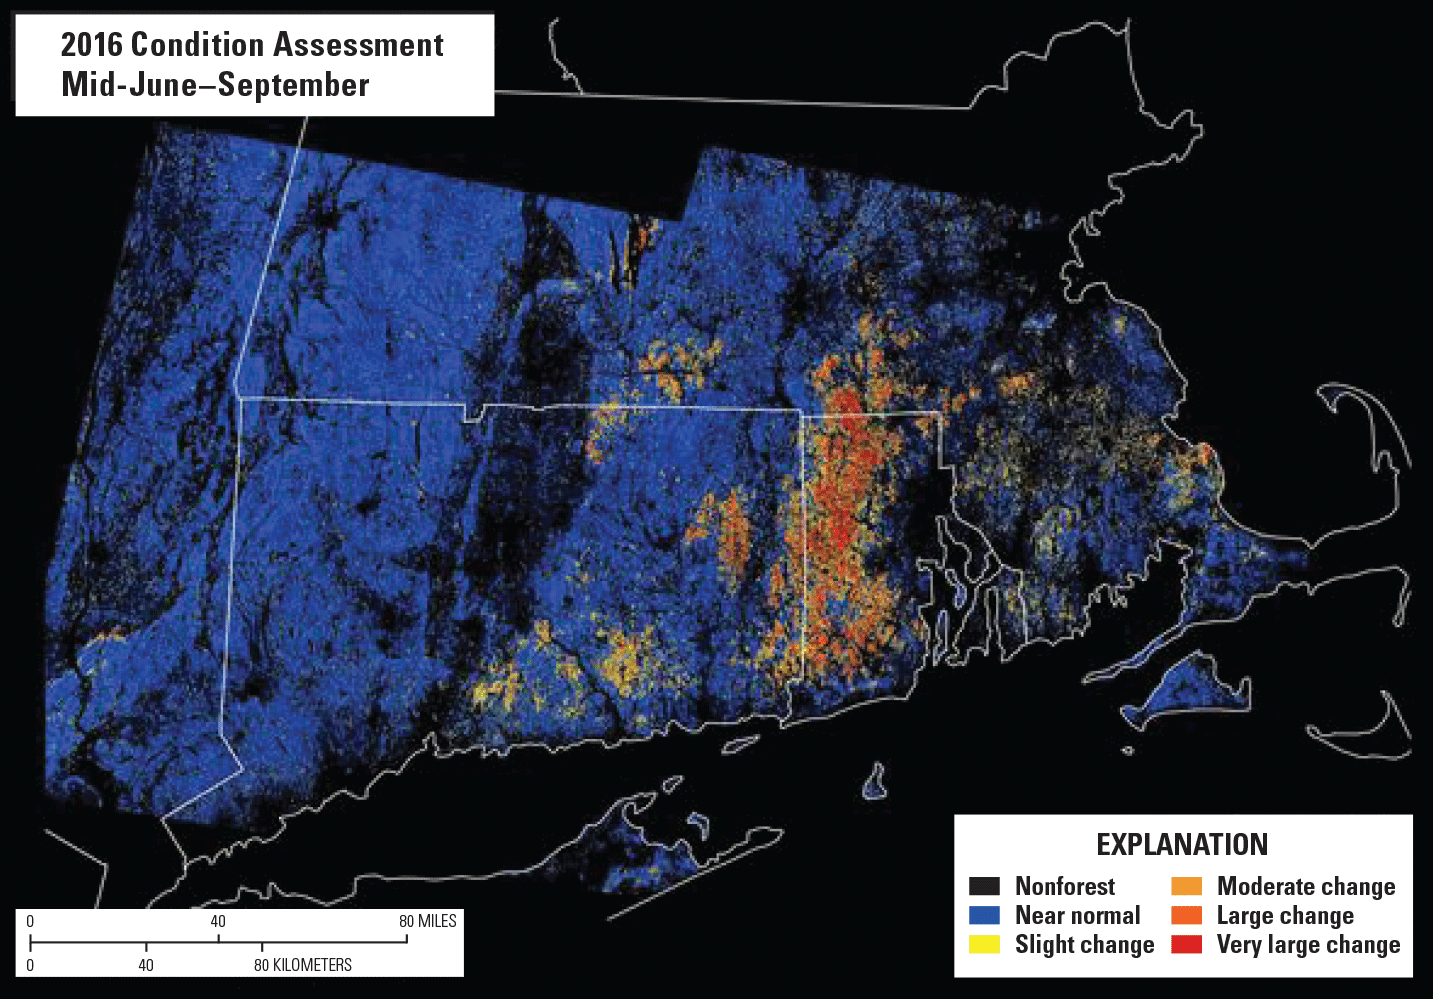
A large outbreak of Lymantria dispar (Linnaeus, 1758; spongy moth) caterpillars attacked the hardwood forests of the northeastern United States in 2016. A fungus (Entomophaga maimaiga) introduced from Japan has kept spongy moth populations fairly low since the late 1980s, but abnormally low rainfall during May and June in 2014, 2015, and 2016 reduced the effectiveness of the fungus, resulting in the worst spongy moth outbreak in New England in more than 30 years. Image credit: U.S. Geological Survey.
Water Quality from Space
The management of water sources on a day-by-day basis typically involves point-by-point sample collection. Although such measurements remain important to the monitoring of freshwater in Rhode Island and elsewhere, Landsat imagery can offer a wider view. One study used Landsat 8 data to track the growth of harmful cyanobacteria in nine drinking-water reservoirs near Newport and determined that the satellite-derived measurements can accurately characterize algal bloom activity (Keith and others, 2018). A recent Brown University study used 582 Landsat scenes from 1982 through 2021 to measure the effect of thermal pollution (increased water temperatures) originating from Brayton Point Power Station and affecting Narragansett Bay. The study documented a cooling of the water’s surface after the cessation of power station effluent discharge in 2011 (Benoit and Fox-Kemper, 2021).
National Land Imaging Program Benefits—Rhode Island
The U.S. Geological Survey (USGS) National Land Imaging Program provides a wide range of satellite imagery and other remotely sensed and geospatial data to Government, commercial, academic, and public users. Those users can get worldwide access to Landsat satellite data through the National Land Imaging Program-funded USGS Earth Resources Observation and Science (EROS) Center.
Landsat—Critical Information Infrastructure for the Nation
Landsat is the most widely used land remote sensing data source within Federal civilian agencies. Local, State, Tribal, and Federal agencies use Landsat to monitor and forecast a wide range of land surface phenomena. Information from Landsat contributes to day-to-day decisions on land, water, and resource use that protect life and property; safeguard the environment; advance science, technology, and education; support climate change resiliency; and grow the U.S. economy. Landsat’s imagery provides a landscape-level view of land surface, inland lake, and coastal processes, both natural and human-induced. Landsat enables us to better understand the scope, nature, and speed of change to the natural and built environment.
Businesses draw upon Landsat data to provide customer-specific applications to improve logistics, resource allocation, and investment decisions. Commercial space imaging firms leverage Landsat data to refine product offerings and support new information services. A 2017 USGS study determined the total annual economic benefit of Landsat data in the United States. to be $2.06 billion, far surpassing its development and operating costs (Straub and others, 2019).
Landsat 8 and Landsat 9 provide 8-day repeat coverage of the Earth’s land surfaces. The National Aeronautics and Space Administration (NASA) and the USGS are currently reviewing the findings from a joint Architecture Study Team, which will inform the design and implementation approach for Landsat Next, the follow-on mission to Landsat 9. Landsat 9 and its successors are planned to provide a sustainable, space-based system to extend the 50-year Landsat series of high-quality global land imaging measurements—the world’s longest time series of the Earth’s land surface.
The long-term availability of consistent and accurate Landsat data, combined with a no-cost data policy, allows users to analyze extensive geographic areas and better understand and manage long-term trends in land surface change. New cloud computing and data analytics technologies use Landsat data in a wide range of decision-support tools for Government and industry. Much like global positioning systems and weather data, Landsat data are used every day to help us better understand our dynamic planet.
References Cited
Benoit, J., and Fox-Kemper, B., 2021, Contextualizing thermal effluent impacts in Narragansett Bay using Landsat-derived surface temperature: Frontiers in Marine Science, v. 8, art. 705204, 15 p., accessed July 19, 2022, at https://doi.org/10.3389/fmars.2021.705204.
Keith, D., Rover, J., Green, J., Zalewsky, B., Charpentier, M., Thursby, G., and Bishop, J., 2018, Monitoring algal blooms in drinking water reservoirs using the Landsat-8 Operational Land Imager: International Journal of Remote Sensing, v. 39, no. 9, p. 2818–2846. [Also available at https://doi.org/10.1080/01431161.2018.1430912.]
Pasquarella, V.J., Elkinton, J.S., and Bradley, B.A., 2018, Extensive gypsy moth defoliation in Southern New England characterized using Landsat satellite observations: Biological Invasions, v. 20, no. 11, p. 3047–3053. [Also available at https://doi.org/10.1007/s10530-018-1778-0.]
Straub, C.L., Koontz, S.R., and Loomis, J.B., 2019, Economic valuation of Landsat imagery: U.S. Geological Survey Open-File Report 2019–1112, 13 p., accessed April 8, 2022, at https://doi.org/10.3133/ofr20191112.
Yang, X., Zhu, Z., Qiu, S., Kroeger, K.D., Zhu, Z., and Covington, S., 2022, Detection and characterization of coastal tidal wetland change in the northeastern US using Landsat time series: Remote Sensing of Environment, v. 276, art. 113047, 19 p., accessed July 19, 2022, at https://doi.org/10.1016/j.rse.2022.113047.
For additional information on Landsat, please contact:
Program Coordinator
USGS National Land Imaging Program
12201 Sunrise Valley Drive
Reston, VA 20192
703–648–4567
The Landsat series is a joint effort of USGS and NASA. NASA develops and launches the spacecraft; USGS manages satellite operations, ground reception, data archiving, product generation, and data distribution. Funding for the National Land Imaging Program’s Landsat operations and data management is provided through the USGS.
Disclaimers
Any use of trade, firm, or product names is for descriptive purposes only and does not imply endorsement by the U.S. Government.
Although this information product, for the most part, is in the public domain, it also may contain copyrighted materials as noted in the text. Permission to reproduce copyrighted items must be secured from the copyright owner.
Suggested Citation
U.S. Geological Survey, 2022, Rhode Island and Landsat: U.S. Geological Survey Fact Sheet 2022–3065, 2 p., https://doi.org/10.3133/fs20223065.
ISSN: 2327-6932 (online)
ISSN: 2327-6916 (print)
Study Area
| Publication type | Report |
|---|---|
| Publication Subtype | USGS Numbered Series |
| Title | Rhode Island and Landsat |
| Series title | Fact Sheet |
| Series number | 2022-3065 |
| DOI | 10.3133/fs20223065 |
| Publication Date | July 20, 2022 |
| Year Published | 2022 |
| Language | English |
| Publisher | U.S. Geological Survey |
| Publisher location | Reston, VA |
| Contributing office(s) | Earth Resources Observation and Science (EROS) Center |
| Description | 2 p. |
| Country | United States |
| State | Rhode Island |
| Online Only (Y/N) | N |