

Streamflow—Water Year 2021
Links
- Document: Report (2.93 MB pdf) , HTML , XML
- NGMDB Index Page: National Geologic Map Database Index Page (html)
- Download citation as: RIS | Dublin Core
Introduction
The maps and graphs in this summary describe national streamflow conditions for water year 2021 in the context of streamflow ranks relative to the 92-year period of water years 1930–2021, unless otherwise noted. A water year is the period from October 1 to September 30 and is designated by the year in which it ends; for example, water year 2021 was from October 1, 2020, to September 30, 2021. The figures are based on observed data (U.S. Geological Survey, 2022c) from the U.S. Geological Survey (USGS) National Streamgage Network (U.S. Geological Survey, 2022a). The period of water years 1930–2021 was evaluated because the number of streamgages in the network before 1930 was too limited to provide statistically significant data to compute meaningful statistics in most regions of the country.
In this summary, reference is made to the term “runoff,” which is defined as the amount of water flowing through a stream divided by the drainage area of the stream. Runoff represents an equivalent depth of water over the basin. Normalizing the flow by dividing by drainage area results in quantities that can be compared from one area to another. In this summary, runoff for a specified period and geographic area is computed from all streamgages with complete streamflow records in the geographic area. In the figures, a rank of 1 indicates the maximum annual flow of all years analyzed, and a rank of 92 indicates the minimum annual flow of all years analyzed. Rankings of streamflow are grouped into categories of much below normal, below normal, normal, above normal, and much above normal based on percentiles of flow (less than 10 percent, 10–24 percent, 25–75 percent, 76–90 percent, and greater than 90 percent, respectively; U.S. Geological Survey, 2022b). Streamflow conditions for States or water-resources regions are presented in the text in order of ranking from maximum to minimum flow; a maximum or minimum flow rank is not shown when there are ties in the rankings. Some of the data used to produce the maps and graphs are provisional and subject to change.
National Overview
The annual runoff in the Nation’s rivers and streams during water year 2021 (9.43 inches) was almost the same as the long-term (1930–2021) mean annual runoff of 9.42 inches for the contiguous United States (fig. 1). Nationwide, the 2021 annual average streamflow ranked the 46th highest out of the 92 years.
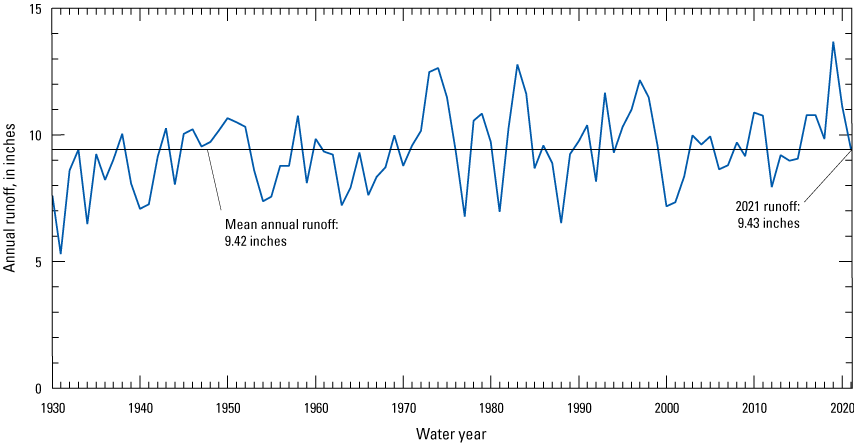
Annual runoff in the contiguous United States, water years 1930–2021.
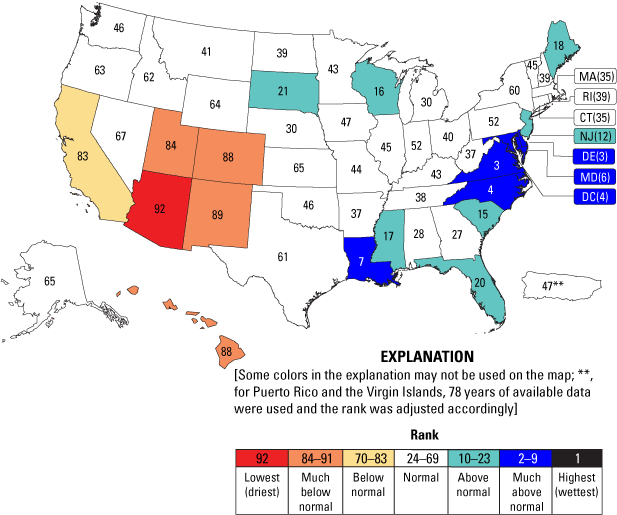
Annual mean streamflow also was ranked by State, which in this summary includes the District of Columbia, and Puerto Rico combined with the Virgin Islands. Streamflow was much below normal in California, Colorado, Idaho, Nevada, New Mexico, North Dakota, Utah, and Wyoming (fig. 2). Streamflow was below normal in Alaska, Arizona, Hawaii, Maine, Minnesota, Oregon, and Vermont. Streamflow was above normal in Alabama, Arkansas, Connecticut, the District of Columbia, Florida, Kentucky, Maryland, Mississippi, New Jersey, and Tennessee. Streamflow was much normal in Delaware, Louisiana, North Carolina, and Virginia.
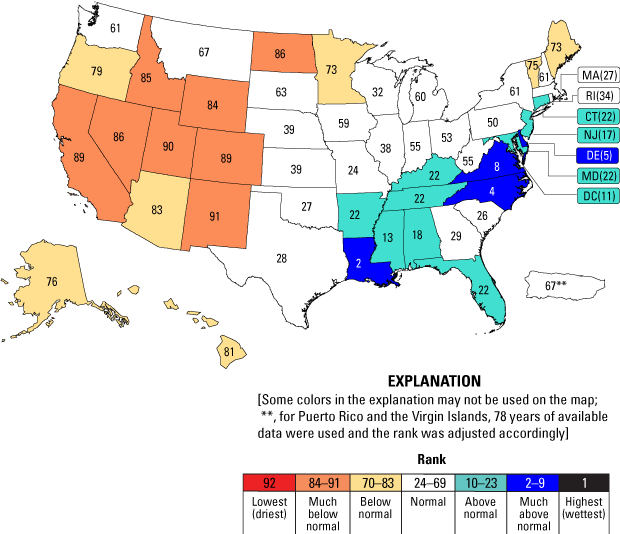
Statewide streamflow ranks in the United States for water year 2021 compared to mean annual streamflows for water years 1930–2021.
Regional Patterns
The United States, the District of Columbia, and Puerto Rico combined with the Virgin Islands lie in 21 large drainages, or water-resources regions (fig. 3). These water-resources regions are based on surface topography and contain the drainage area of a major river; the combined drainage areas of a series of rivers, such as the Texas-Gulf region, which includes several rivers draining into the Gulf of Mexico; or the area of an island or island group. Water-resources regions provide a coherent, drainage basin based framework for depicting streamflow variations.
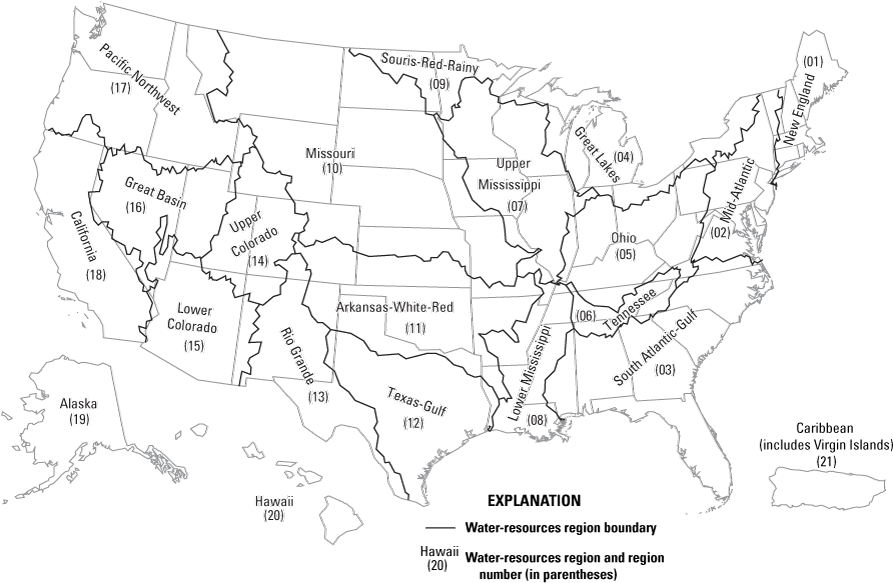
Water-resources regions of the United States.
Annual mean streamflow was ranked lowest in the Rio Grande region (fig. 4). Annual mean streamflow was ranked much below normal in the California, Great Basin, and Upper Colorado regions. Annual mean streamflow was ranked below normal in the Alaska, Hawaii, Lower Colorado, Pacific Northwest, and Souris-Red-Rainy regions. Annual mean streamflow was ranked above normal in the Arkansas-White-Red, Lower Mississippi, South Atlantic-Gulf, Tennessee, and Texas-Gulf regions.
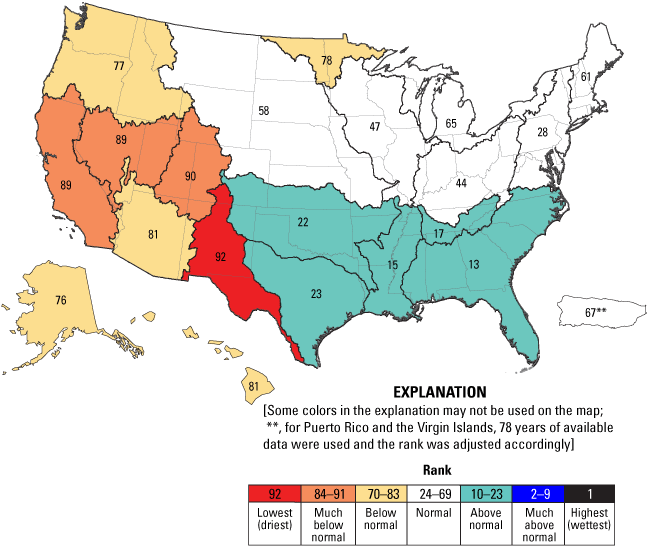
Regional streamflow ranks in the United States for water year 2021 compared to mean annual streamflows for water years 1930–2021.
Seasonal Characteristics
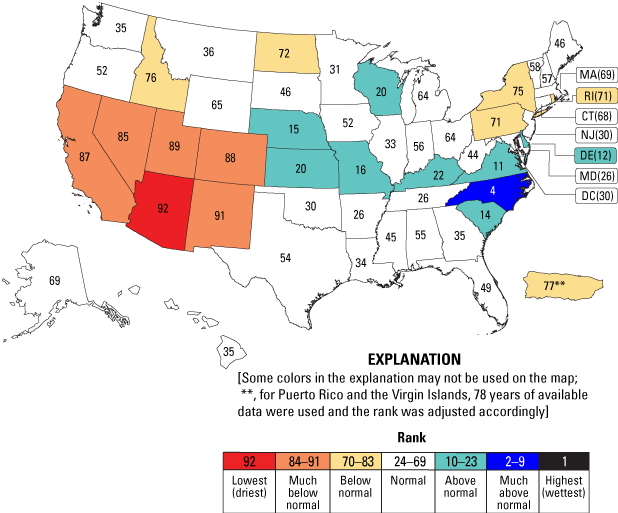
Autumn (October–December 2020) streamflow was ranked lowest in Arizona (fig. 5). Streamflow was ranked much below normal in Colorado, Hawaii, New Mexico, and Utah. Streamflow was ranked below normal in California. Streamflow was ranked above normal in Florida, Maine, Mississippi, New Jersey, South Carolina, South Dakota, and Wisconsin. Streamflow was ranked much above normal in Delaware, the District of Columbia, Louisiana, Maryland, North Carolina, and Virginia. Nationwide, autumn-season streamflow ranked the 33d highest out of 92 years.
Autumn (October–December 2020) statewide streamflow ranks in the United States compared to mean quarterly streamflows for water years 1930–2021.
Winter (January–March 2021) streamflow was lowest in Arizona (fig. 6). Streamflow was ranked much below normal in California, Colorado, Nevada, New Mexico, and Utah. Streamflow was ranked below normal in Idaho, New York, North Dakota, Pennsylvania, Puerto Rico and the Virgin Islands, and Rhode Island. Streamflow was ranked above normal in Delaware, Kansas, Kentucky, Missouri, Nebraska, South Carolina, Wisconsin, and Virginia. Streamflow was ranked much above normal in North Carolina. Nationwide, winter-season streamflow ranked the 47th highest out of 92 years.
Winter (January–March 2021) statewide streamflow ranks in the United States compared to mean quarterly streamflows for water years 1930–2021.
Spring (April–June 2021) streamflow was ranked much below normal in Arizona, California, Colorado, Hawaii, Maine, Nevada, New Hampshire, New York, North Dakota, Oregon, Utah, Vermont, and Wyoming (fig. 7). Streamflow was ranked below normal in Connecticut, Idaho, Iowa, Massachusetts, Michigan, Minnesota, Montana, New Mexico, Pennsylvania, Puerto Rico and the Virgin Islands, Rhode Island, South Dakota, Washington, West Virginia, and Wisconsin. Streamflow was ranked above normal in Alabama, Arkansas, and Oklahoma. Streamflow was ranked much above normal in Louisiana, Mississippi, and Texas. Nationwide, spring-season streamflow ranked the 71st highest out of 92 years.
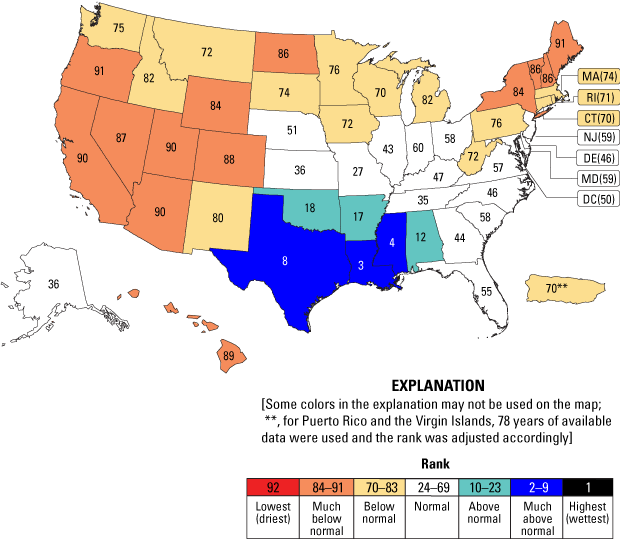
Spring (April–June 2021) statewide streamflow ranks in the United States compared to mean quarterly streamflows for water years 1930–2021.
Summer (July–September 2021) streamflow was ranked much below normal in California, Idaho, Minnesota, North Dakota, Oregon, and Wyoming (fig. 8). Streamflow was ranked below normal in Colorado, Hawaii, Maine, Montana, Nevada, Puerto Rico and the Virgin Islands, South Dakota, Utah, and Washington. Streamflow was ranked above normal in Arkansas, the District of Columbia, Florida, Indiana, Kentucky, Michigan, Missouri, Ohio, Oklahoma, Texas, Vermont, and Wisconsin. Streamflow was ranked much above normal in Connecticut, Georgia, Illinois, Louisiana, Massachusetts, New Hampshire, New Jersey, New York, Pennsylvania, Rhode Island, and Tennessee. The highest streamflow was measured in Alabama and Mississippi. Nationwide, summer-season streamflow ranked the eighth highest out of 92 years.
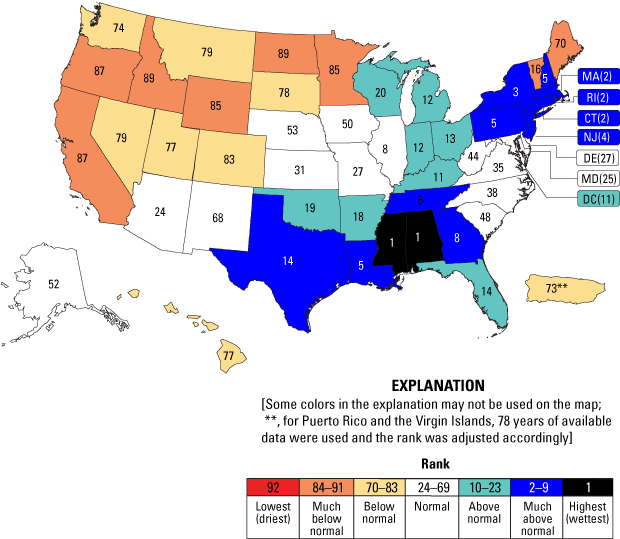
Summer (July–September 2021) statewide streamflow ranks in the United States compared to mean quarterly streamflows for water years 1930–2021.
High and Low Streamflows
Assuming individual streamgage data are independent of other streamgage data and are normally distributed, the monthly streamflow is expected to be high (greater than the 95th percentile) at 5 percent of the streamgages and is expected to be low (less than the 5th percentile) at 5 percent of the streamgages during any given month. The percentages of streamgages reporting high streamflow in four months of water year 2021 (November 2020 and July, August, and September 2021) were greater than expected (5, 10, 6, and 8 percent, respectively; fig. 9). In contrast, there were eight months (October 2020 and March, April, May, June, July, August, and September 2021) with a greater-than-expected percentage of streamgages reporting low streamflow (5, 5, 9, 8, 7, 8, 5, and 5 percent, respectively).
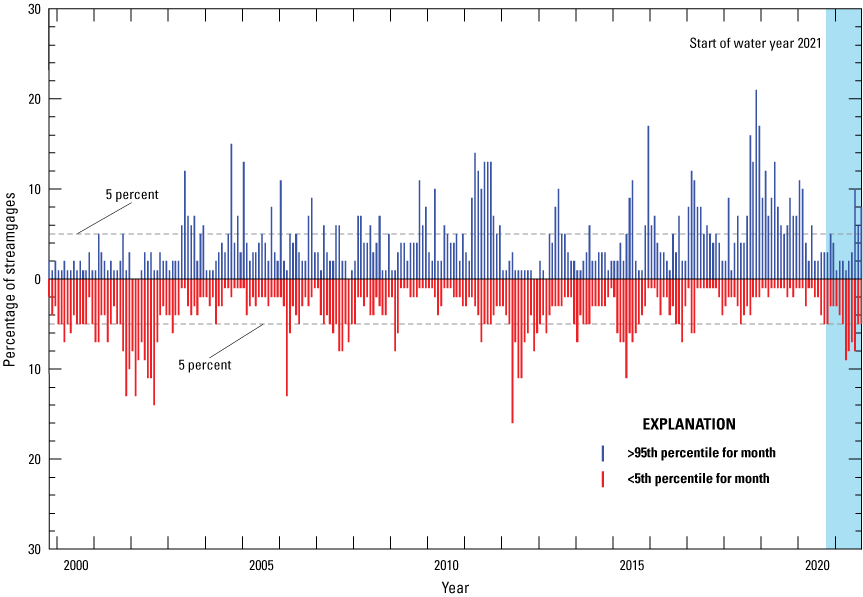
Percentage of streamgages with high and low monthly streamflow, October 1999–September 2021.
Additional Information
The USGS operated a nationwide network of more than 8,400 year-round, real-time streamgages in water year 2021. The real-time data from these streamgages are available at https://waterwatch.usgs.gov. The streamflow information used to prepare this summary also is used for water management, flood and drought monitoring, bridge design, and recreational activities. To obtain real-time and archived streamflow data and information, visit the USGS National Water Information System database at https://doi.org/10.5066/F7P55KJN (U.S. Geological Survey, 2022c). The National Streamflow Network, which is part of the Groundwater and Streamflow Information Program, is operated primarily by the USGS; however, funding to operate the network is provided by the USGS and about 1,885 Federal, State, Tribal, regional, and local partners. Additional streamflow information can be accessed at https://www.usgs.gov/water-resources/groundwater-and-streamflow-information/streamflow-monitoring?qt-science_support_page_related_con=0#qt-science_sup port_page_related_con.
References Cited
U.S. Geological Survey, 2022a, Groundwater and Streamflow Information Program: U.S. Geological Survey web page, accessed April 2022 at https://www.usgs.gov/water-resources/groundwater-and-streamflow-information.
U.S. Geological Survey, 2022b, Map of real-time streamflow compared to historical streamflow for the day of the year (United States): U.S. Geological Survey web page, accessed April 2022 at https://waterwatch.usgs.gov/?id=ww_current.
U.S. Geological Survey, 2022c, USGS water data for the Nation: U.S. Geological Survey National Water Information System database, accessed April 2022 at https://doi.org/10.5066/F7P55KJN.
For additional information, contact:
U.S. Geological Survey
415 National Center
Reston, Virginia 20192
https://www.usgs.gov/mission-areas/water-resources
Publishing support provided by the
Rolla Publishing Service Center
Disclaimers
Any use of trade, firm, or product names is for descriptive purposes only and does not imply endorsement by the U.S. Government.
Although this information product, for the most part, is in the public domain, it also may contain copyrighted materials as noted in the text. Permission to reproduce copyrighted items must be secured from the copyright owner.
Suggested Citation
Jian, X., Wolock, D.M., Lins, H.F., Henderson, R.J., and Brady, S.J., 2022, Streamflow—Water year 2021: U.S. Geological Survey Fact Sheet 2022–3072, 6 p., https://doi.org/10.3133/fs20223072.
ISSN: 2327-6932 (online)
Study Area
| Publication type | Report |
|---|---|
| Publication Subtype | USGS Numbered Series |
| Title | Streamflow—Water year 2021 |
| Series title | Fact Sheet |
| Series number | 2022-3072 |
| DOI | 10.3133/fs20223072 |
| Publication Date | August 19, 2022 |
| Year Published | 2022 |
| Language | English |
| Publisher | U.S. Geological Survey |
| Publisher location | Reston, VA |
| Contributing office(s) | Kansas Water Science Center |
| Description | 6 p. |
| Country | United States |
| Online Only (Y/N) | Y |