

A Multiscale Approach for Monitoring Groundwater Discharge to Headwater Streams by the U.S. Geological Survey Next Generation Water Observing System Program—An Example From the Neversink Reservoir Watershed, New York
Links
- Document: Report (10.8 MB pdf) , HTML , XML
- Data Release: USGS data release - Stream Temperature, Dissolved Radon, and Stable Water Isotope Data Collected along Headwater Streams in the Upper Neversink River Watershed, NY, USA (ver. 2.0, April 2023)
- NGMDB Index Page: National Geologic Map Database Index Page (html)
- Download citation as: RIS | Dublin Core
What Is Groundwater Discharge and Why Measure It Along Mountain Headwater Streams?
Groundwater that drains to surface water through seeps and springs is generally referred to as “discharge.” Groundwater discharge is a primary component of stream base flow, or streamflow that occurs between storms, periods of snowmelt runoff, and periods of quick soil drainage. Streams that gain groundwater as they flow are common across glaciated regions such as the northern Delaware River Basin, and the hydrogeologic mechanisms that control exchanges of surface and groundwater are complex (fig. 1). Because of this complexity, groundwater discharge rates are rarely evenly distributed throughout stream networks, which may instead be dominated by locations of preferential discharge along riparian wetlands, streambanks, and the streambed (Briggs and Hare, 2018). Streams may also lose flow to groundwater across parts of the network, causing patches of disconnection among stream channels at low flow. Stream and river ecosystems depend on preferential groundwater discharge to support summer low flows, control water temperature, and maintain water quality (Miller and others, 2016). Furthermore, groundwater discharge promotes stream channel flow connectivity during dry times, allowing fish and other organisms to move freely in search of food, shelter from predation, and thermal refuge.
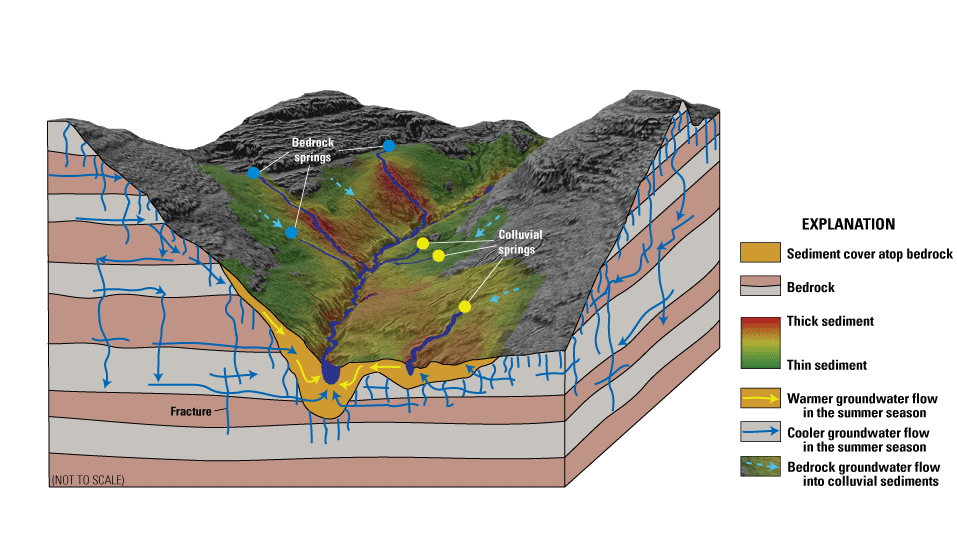
This conceptual diagram of the system of surface and groundwater flow in the Neversink Reservoir watershed shows warmer shallow groundwater flow paths contributing to streams through surficial sediments in summer, while discharge of cooler, deeper bedrock groundwater reaches streams directly from bedrock discharges and indirectly from hillslope flow paths.
Groundwater discharge is a crucial component in many model-based forecasts of future water quality and habitat viability along headwater streams. However, U.S. Geological Survey (USGS) streamgage density is generally low in mountain headwater stream networks, and traditional streamflow measurements may not sufficiently capture groundwater discharge characteristics that are needed to improve predictions (Barclay and others, 2022). By collecting new and varied types of data related to groundwater discharge at scales from streambank to watershed, the Next Generation Water Observing System (NGWOS) program (https://www.usgs.gov/mission-areas/water-resources/science/next-generation-water-observing-system-ngwos) supports model calibration, water resource-related predictions, and management decisions.
Multiscale Groundwater Monitoring in the Neversink Reservoir Watershed
The USGS is incorporating new and diverse types of groundwater discharge-related data into the development, calibration, and validation of predictive models. These data include tracers of groundwater age and relative depths of groundwater flow paths that contribute to streamflow. Groundwater age, or transit time, reflects the varied flow paths that determine the water quality and persistence of stream base flow. In the Neversink Reservoir watershed, a subbasin in the headwaters of the Delaware River Basin in the Catskill Mountains of New York State, groundwater discharge with a range of transit times includes both shallow and deep groundwater sources (Murdoch and others, 2021). Those varied-depth flowpath sources may shift in dominance over the seasons and from wet to drought times (Burns and others, 1998). Shallow groundwater is sensitive to land use and climatic changes, including urban development, whereas deeper groundwater is typically more resilient, providing a buffer against stressors to sensitive stream ecosystems (Hare and others, 2021). Shallow groundwater also warms over summer months, and that heat is transferred to headwater streams through discharge (fig. 1), with detrimental potential effects on cold water habitat and thermal refuge for fish.
Starting in 2019, the USGS, through its NGWOS program, developed a multiscale methods and technology testbed approach to monitoring groundwater discharge processes in the Neversink Reservoir watershed. As groundwater discharge dynamics are complex because of geographic differences in groundwater recharge (precipitation minus runoff, quickflow, and evapotranspiration), topography, and geology, the monitoring of discharge processes necessitates an innovative approach that includes emerging water tracing methods and enhanced local geologic mapping.
Approach
Chemical patterns and thermal regimes in headwaters, unlike many higher order streams, can show substantial spatial variability. Groundwater gains and losses exert a spatially discontinuous influence on streams that reflects, in part, the preferential nature of groundwater discharge as controlled by recharge, topography, and geology. Such variability in discharge patterns presents a challenge for USGS monitoring and interpretation. New thermal infrared field surveying techniques combined with localized point measurements allow discrete discharge locations such as streambank springs to be assessed in detail, but extrapolation of such measurements to the larger catchment can be difficult. Conversely, streamflow-based methods of physically or chemically distinguishing base flow from rapid runoff in high-order streams can be applied to broad catchment areas, but spatial detail is lost.
The wide range of current methods that can be used to evaluate groundwater discharge to streams across scales can be explored with the USGS Groundwater/Surface-Water Method Selection Tool (Hammett and others, 2022).When applied to the known characteristics of the Neversink Reservoir watershed, this software tool indicated that several chemical hydrograph separation and geophysical methods were unlikely to be effective in identifying discharge sources because of the widespread similarity in groundwater and surface-water electrical conductivity, with values generally less than 50 microsiemens per centimeter at 25 degrees Celsius. However, several heat tracing methods were deemed applicable, in part because of strong contrasts between surface and groundwater temperature during summer and winter. Ambient tracer methods based on stable water isotopes and dissolved radon gas measured in streamwater were also expected to be useful because of the local bedrock geology, elevation gradients, and snowmelt processes in the Catskill Mountains.
As a first step in 2019, NGWOS updated and (or) activated streamgage sites at six locations in the headwater subbasin with sensors for water temperature and electrical conductivity, in addition to establishing two sites for intensive monitoring of groundwater discharge at existing streamgages along the West Branch Neversink River and mainstem Neversink River. These two sites were complemented at the watershed scale by establishing 51 multiyear water and air temperature monitoring stations across headwater streams with a range of sizes and elevations. Geophysical and drone data were also collected at the stream monitoring sites and paired with emerging analytical methods to refine the mapping of near-surface geology across the subbasin. This multiscale and multiparameter approach represents a transferable example of groundwater discharge monitoring to support the improvement of water quality, temperature, flow permanence, and habitat forecasts in headwater stream systems.
Streambank-Scale Monitoring of Deep and Shallow Groundwater Discharge
The USGS has monitored lateral groundwater-to-stream hydraulic gradients at some Super Gage sites (for example, Eddy-Miller and others, 2012). NGWOS built upon these earlier efforts by identifying varied locations of groundwater discharge using heat as a tracer at the West Branch Neversink River (USGS site 01434498) and mainstem Neversink River (USGS site 01435000) streamgage sites and instrumenting nearby seeps and springs directly. By targeting areas of discharge, the approach focused on sensor deployment to active surface-water and groundwater hydrologic connections, rather than relying on connectivity inferred from well water levels. A critical component of streambank-scale instrumentation at each site was initial site characterization, primarily using thermal infrared cameras and fiber-optic distributed temperature sensing to quickly identify discharge locations, and passive seismic geophysical methods for measuring local bedrock depth (fig. 2).
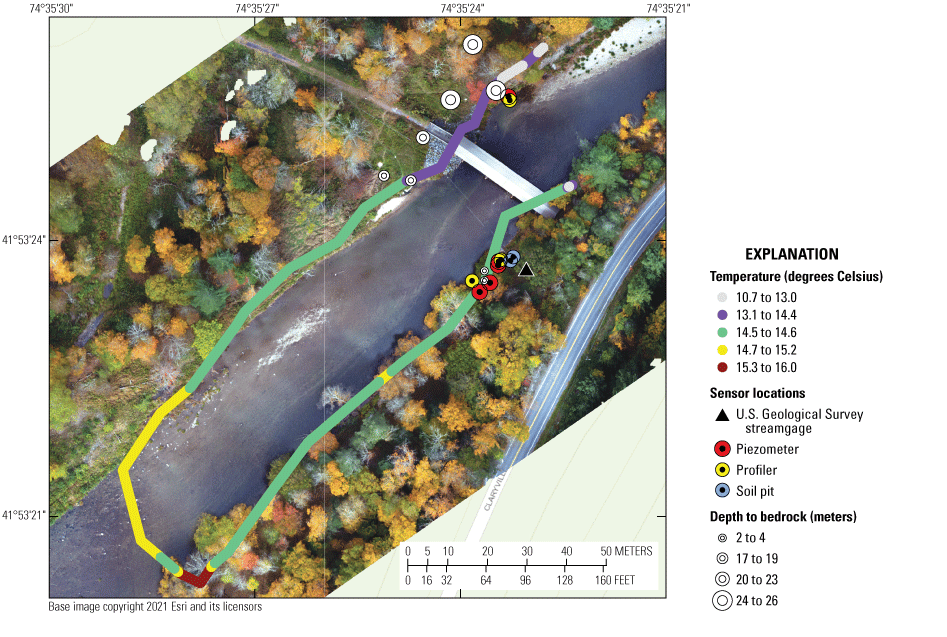
Fiber-optic distributed temperature data and depth to bedrock data plotted over the drone-based orthomosiac (from Briggs and others, 2020) of the mainstem Neversink River site along with locations of the streamgage, piezometers, streambed temperature profilers, and soil moisture pits.
Small uncrewed aviation systems (drones) were deployed to map the terrain and collect additional thermal infrared data (Briggs and others, 2020). A subset of discharges were selected at the two streamgage sites to represent primary discharge types throughout the watershed, such as deep groundwater seeping from thick alluvial sediments and shallow groundwater emerging in riparian springs along the toe of both wooded and exposed hillslopes. Shallow piezometers and vertical temperature profilers were installed directly into discharge locations, soil moisture profilers were placed in nondischarge bank sediments, and local meteorological variables were monitored (fig. 2). Each general data type is described briefly below.
Fixed-Mount Thermal Infrared Imaging
To enhance the spatial context of thermal variations in surface waters resulting from groundwater discharge, continuous, fixed-mount, thermal infrared (TIR) imagery sensors were installed at the mainstem Neversink River streamgage site (USGS site 01435000). River water and streambank surface temperature images as interpreted from TIR data help comprehensively visualize where along the riverbank discharge is occurring, expanding on point measurements from temperature probes (fig. 3). The TIR data are currently collected hourly at this site, paired with visible light imagery, and displayed as still frames or time lapses on the USGS National Water Information System page (https://waterdata.usgs.gov/monitoring-location/01435000), where the data are also available for download (U.S Geological Survey, 2022).
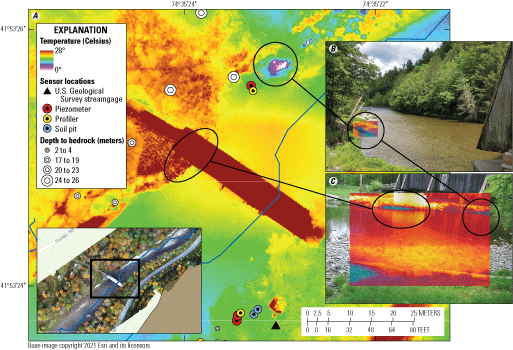
Imagery from the Neversink River near Claryville, New York, streamgage site (USGS site 01435000) showing use of three types of thermal infrared sensors for reconnaissance, monitoring, and mapping of bankside groundwater discharge: A, drone-collected thermal orthomosaic with location shown on the visible-light orthomosiac inset; B, handheld visible and thermal infrared (inset) reconnaissance images taken to identify active groundwater seeps; and C, thermal infrared image overlaid on a visible light image from the continuous, fixed-mount system, where cool colors may indicate discharge in summer.
Direct Monitoring of Discharge Locations
Streambank monitoring of groundwater discharge is carried out with sensors installed in the bank and streambed sediments:
-
• Groundwater electrical conductivity: Total dissolved solids in the emerging groundwater are tracked via electrical conductivity and can indicate influence from road salt, contaminants, and changes in source waters over time.
-
• Groundwater pressure: Water pressure gradients between a discharge zone and adjacent stream surface are used to infer relative changes in discharge rate over time as influenced by seasonal processes (such as snowmelt) and discrete events (storms).
-
• Vertical temperature profiles: Saturated sediment temperatures recorded over time at multiple shallow depths within a discharge zone are used to parse shallow and deeper groundwater sources, to assess the influence of groundwater source on stream temperature, and to model rates of groundwater discharge flux over time.
Supporting Data for Direct Monitoring of Groundwater Discharge
-
• Meteorological variables: Incoming solar radiation, wind speed, relative humidity, precipitation, barometric pressure, and air temperature are useful data for tracking precipitation events and seasonal changes and can be used in stream heat-budget calculations.
-
• Soil moisture profiles: Soil moisture measurements in sediments adjacent to discharge locations are used to infer local groundwater recharge events and dry times when hillslope evapotranspiration and shallow groundwater may be low.
Headwater Network-Scale Monitoring of Groundwater Discharge Influence on Streamwater
Paired streambank air and streamwater temperature data were collected at 51 temporary monitoring stations installed in fall 2020. Stream water samples were also collected in spring and fall seasons and analyzed for stable water isotopes and dissolved radon gas.
Paired Local Air and Streamwater Temperatures
In the absence of groundwater influence, stream temperature patterns are generally expected to track local air temperature changes at weekly to annual timescales. However, accumulated groundwater discharge can disrupt that coupling. Therefore, time series analysis of paired, local air and streamwater temperatures is used to indicate relative groundwater influence along small and large streams at the watershed scale. Metrics related to the timing and magnitude of annual stream temperature signals compared to local air signals can also be used to infer groundwater influence and potentially indicate stream sections dominated by shallow groundwater discharge (fig. 4). Paired air and water temperature data can be analyzed by using locally measured data or the free web application PASTA (https://cuahsi.shinyapps.io/pasta/), which provides estimated air temperature data from a large-scale database.
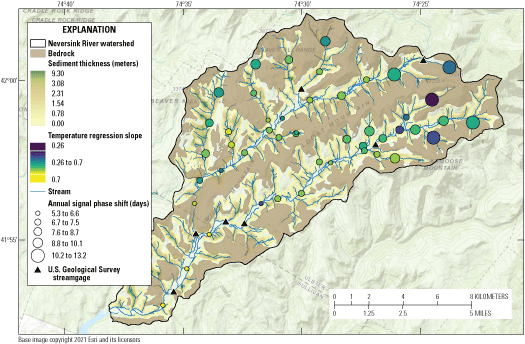
The relations between annual air and water temperature signals are used to infer where groundwater discharges to stream networks and if that groundwater originates from shallow or deeper flowpaths. The air-water signal timing or “phase shift” is plotted here across the Neversink Reservoir watershed; longer phase shifts (larger dots) can indicate more shallow groundwater influence. The slope of a linear fit to the air and water temperature data at each site is shown by dot color, where lower values are indicative of reduced stream thermal sensitivity that may be driven by deep or shallow groundwater influence (Terry and others, 2022). The newly estimated minimum surficial sediment thickness and exposed bedrock zones across the Neversink Reservoir watershed are used to understand how the geology influences the observed groundwater discharge dynamics (Odom and Doctor, 2022).
Stream Stable Water Isotopes and Dissolved Radon Gas
Precipitation distributed across elevation gradients and seasons contains characteristic stable water isotopic signatures that are translated to groundwater through recharge. Evaluating the isotopic composition of streamwater can indicate stream sections that are influenced by different types of groundwater flow paths (for example, those that originate in hillslope wetlands, shallow sediments, or deep bedrock) and how those groundwater sources to streams may shift over the year. Similarly, flow-path sources can also be indicated by measuring dissolved radon gas in streamwater, as radon is naturally produced in saturated sediments and bedrock.
Stream Channel Imagery
Low-cost, automated cameras can be used to assess streamflow permanence (drying), overbank flow events, and ice cover. If stream geometry is measured and additional analysis performed, camera images can also be used to estimate streamflow velocity and total channel discharge rate for headwater streams where USGS streamgage coverage is sparse.
Geophysical Mapping of Bedrock Depth
The thickness of surface soils influences the routing of groundwater flow paths to streams, which in turn affects groundwater discharge temperature and water quality. From 2019 to 2022, the USGS collected passive seismic geophysical data at over 80 stream corridor and hillslope locations that were interpreted to determine depth to bedrock (Glas and others, 2021), which varied between the East Branch Neversink River and West Branch Neversink River, and data were used to improve near-surface geologic maps.
Enhanced Geologic Mapping
Mapping surficial sediments and bedrock exposures across the Neversink Reservoir watershed at high spatial resolution (1:24,000 scale or smaller) has provided an improved geospatial dataset in support of groundwater modeling efforts. A deep-learning, image segmentation approach was developed to aid in the mapping of exposed and covered bedrock surfaces using a light detection and ranging (lidar)-derived digital elevation model at 1-meter spatial resolution (Odom and Doctor, 2022). In addition, a map of estimated minimum sediment thickness was derived by using an inverse-distance weighting interpolation between measurable heights of the banks of streams that cut through surficial sediments and the nearest bedrock exposures as well as local geophysical measurements of sediment thickness.
Expanding Application of Multiscale Monitoring
Through the multiscale monitoring strategy developed for the Neversink Reservoir watershed, the NGWOS is providing critical data to increase model certainty and improve understanding of the physical processes that govern groundwater discharge dynamics throughout similar headwater stream networks. Attributes of this strategy are currently being replicated by the NGWOS at several additional watersheds in the Delaware River Basin of varied hydrogeological terrain, and in the upper Colorado River Basin. These publicly available data from groundwater discharge monitoring can help the USGS address stakeholder goals in the management of headwater streams and concerns in a changing climate.
References Cited
Barclay, J.R., Briggs, M.A., Moore, E.M., Starn, J.J., Hanson, A.E.H., and Helton, A.M., 2022, Where groundwater seeps—Evaluating modeled groundwater discharge patterns with thermal infrared surveys at the river-network scale: Advances in Water Resources, v. 160, article 104108, 14 p., accessed May 2022 at https://doi.org/10.1016/j.advwatres.2021.104108.
Briggs, M.A., Dawson, C.B., White, E.A., Gazoorian, C.L., Hare, D.K., and Lane, J.W., 2020, Thermal infrared and photogrammetric data collected by drone for hydrogeologic characterization around two U.S. Geological Survey Next Generation Water Observing Systems stream gage locations near Claryville, NY, USA: U.S. Geological Survey data release, accessed April 2022 at https://doi.org/10.5066/P9FIZTPU.
Briggs, M.A., and Hare, D.K., 2018, Explicit consideration of preferential groundwater discharges as surface water ecosystem control points: Hydrological Processes, v. 32, no. 15, p. 2435–2440, accessed April 2022 at https://doi.org/10.1002/hyp.13178.
Burns, D.A., Murdoch, P.S., Lawrence, G.B., and Michel, R.L., 1998, Effect of groundwater springs on NO3− concentrations during summer in Catskill Mountain streams: Water Resources Research, v. 34, no. 8, p. 1987–1996. [Also available at https://doi.org/10.1029/98WR01282.]
Eddy-Miller, C.A., Constantz, J., Wheeler, J.D., Caldwell, R.R., and Barlow, J.R.B., 2012, Demonstrating usefulness of real-time monitoring at streambank wells coupled with active streamgages—Pilot studies in Wyoming, Montana, and Mississippi: U.S. Geological Survey Fact Sheet 2012–3054, 6 p. [Also available at https://doi.org/10.3133/fs20123054.]
Glas, R.L., Briggs, M.A., Terry, N.C., Gazoorian, C.L., and Doctor, D.H., 2021, Depth to bedrock determined from passive seismic measurements, Neversink River watershed, NY (USA): U.S. Geological Survey data release, accessed April 2022 at https://doi.org/10.5066/P9CKDMNY.
Hammett, S., Day‐Lewis, F.D., Trottier, B., Barlow, P.M., Briggs, M.A., Delin, G., Harvey, J.W., Johnson, C.D., Lane, J.W., Jr., Rosenberry, D.O., and Werkema, D.D., 2022, GW/SW–MST—A groundwater/surface‐water method selection tool: Groundwater, early view article, 8 p., accessed June 2022 at https://doi.org/10.1111/gwat.13194.
Hare, D.K., Helton, A.M., Johnson, Z.C., Lane, J.W., and Briggs, M.A., 2021, Continental-scale analysis of shallow and deep groundwater contributions to streams: Nature Communications, v. 12, article 1450, 10 p., accessed April 2022 at https://doi.org/10.1038/s41467-021-21651-0.
Miller, M.P., Buto, S.G., Susong, D.D., and Rumsey, C.A., 2016, The importance of base flow in sustaining surface water flowing the Upper Colorado River Basin: Water Resources Research, v. 52, no. 5, p. 3547–3562, accessed April 2022 at https://doi.org/10.1002/2015WR017963.
Murdoch, P.S., Burns, D.A., McHale, M.R., Siemion, J., Baldigo, B.P., Lawrence, G.B., George, S.D., Antidormi, M.R., and Bonville, D.B., 2021, The Biscuit Brook and Neversink Reservoir watersheds—Long‐term investigations of stream chemistry, soil chemistry and aquatic ecology in the Catskill Mountains, New York, USA , 1983–2020: Hydrological Processes, v. 35, no. 10, article e14394, accessed May 1, 2022, at https://doi.org/10.1002/hyp.14394.
Odom, W.E., and Doctor, D.H., 2022, Deep-learning-derived alluvium, shallow-to-exposed bedrock, and surficial sediment thickness map for the upper Neversink River watershed, New York: U.S. Geological Survey data release, accessed June 2022 at https://doi.org/10.5066/P9PDO2NG.
Terry, N., Briggs, M.A., Kushner, D., Dickerson, H., Baldwin, A., Trottier, B., Haynes, A., Besteder, C., Glas, R., Doctor, D., and Gazoorian, C., 2022, Stream temperature, dissolved radon, and stable water isotope data collected along headwater streams in the upper Neversink River watershed, NY, USA: U.S. Geological Survey data release, accessed April 2022 at https://doi.org/10.5066/P9R3TYOZ.
U.S. Geological Survey, 2022, USGS water data for the Nation: U.S. Geological Survey National Water Information System database, accessed August 15, 2022, at https://doi.org/10.5066/F7P55KJN.
For more information, contact:
The Water Mission Area Next Generation Observing System Program
Disclaimers
Any use of trade, firm, or product names is for descriptive purposes only and does not imply endorsement by the U.S. Government.
Although this information product, for the most part, is in the public domain, it also may contain copyrighted materials as noted in the text. Permission to reproduce copyrighted items must be secured from the copyright owner.
Suggested Citation
Briggs, M.A., Gazoorian, C.L., Doctor, D.H., and Burns, D.A., 2022, A multiscale approach for monitoring groundwater discharge to headwater streams by the U.S. Geological Survey Next Generation Water Observing System Program—An example from the Neversink Reservoir watershed, New York: U.S. Geological Survey Fact Sheet 2022–3077, 6 p., https://doi.org/10.3133/fs20223077.
ISSN: 2327-6932 (online)
ISSN: 2327-6916 (print)
Study Area
| Publication type | Report |
|---|---|
| Publication Subtype | USGS Numbered Series |
| Title | A multiscale approach for monitoring groundwater discharge to headwater streams by the U.S. Geological Survey Next Generation Water Observing System Program—An example from the Neversink Reservoir watershed, New York |
| Series title | Fact Sheet |
| Series number | 2022-3077 |
| DOI | 10.3133/fs20223077 |
| Publication Date | October 25, 2022 |
| Year Published | 2022 |
| Language | English |
| Publisher | U.S. Geological Survey |
| Publisher location | Reston, VA |
| Contributing office(s) | New York Water Science Center, WMA - Observing Systems Division, Florence Bascom Geoscience Center |
| Description | 6 p. |
| Country | United States |
| State | New York |
| Other Geospatial | Neversink Reservoir Watershed |
| Online Only (Y/N) | N |
| Additional Online Files (Y/N) | N |