

Application of Geophysical Methods to Enhance Aquifer Characterization and Groundwater-Flow Model Development, Des Moines River Alluvial Aquifer, Des Moines, Iowa, 2022
Links
- Document: Report (2.95 MB pdf) , HTML , XML
- Dataset: USGS dataset —National Hydrography Dataset— USGS National Hydrography Dataset Best Resolution for Hydrologic Unit 4 – 2001
- Data Releases:
- USGS data release - Geophysical data collected in the Des Moines River, Beaver Creek, and the Des Moines River floodplain, Des Moines, Iowa, 2018
- USGS data release - MODFLOW-NWT model used to simulate groundwater levels in the Des Moines River alluvial aquifer near Des Moines, Iowa
- NGMDB Index Page: National Geologic Map Database Index Page (html)
- Download citation as: RIS | Dublin Core
Introduction
Des Moines Water Works (DMWW) is one of the largest water providers in Iowa and as population growth continues, demand for drinking water is increasing. DMWW uses groundwater and surface water as raw water sources to supply the City of Des Moines and surrounding communities. In response to current and future demands, DMWW is in need of a thorough understanding of local groundwater resources, specifically the Des Moines River alluvial aquifer. The Des Moines River alluvial aquifer (fig. 1) is hydraulically connected to the Des Moines River and consists of alluvial deposits and glacial outwash sands and gravels (Thompson, 1984; Bettis and Hoyer, 1986; Quade and others, 2002; Quade and others, 2003). To ensure a sustainable groundwater supply, additional information to better understand and manage groundwater availability within the Des Moines River alluvial aquifer would be beneficial. Beginning in 2018, DMWW partnered with the U.S. Geological Survey (USGS) to construct a groundwater-flow model to increase understanding of the hydrologic system in the Des Moines area. The model hydrogeologic framework will be enhanced by using multiple geophysical methods of data collection in the Des Moines River, Beaver Creek, and the Des Moines River alluvial aquifer that could provide a better understanding of the geology in the model area.
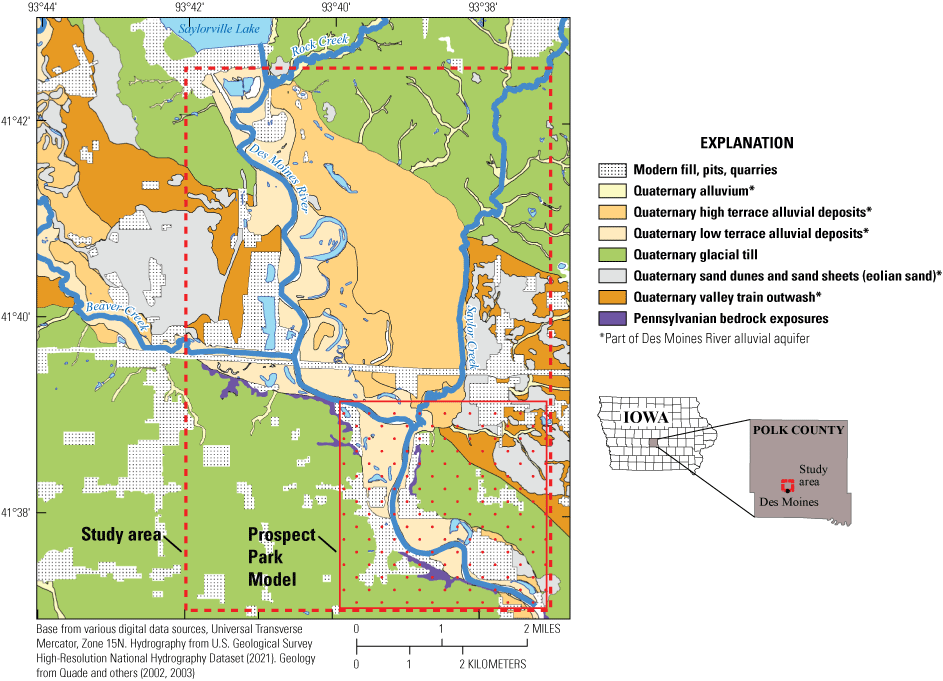
The study area and surficial geology near Des Moines, Iowa.
Study Objectives
The objectives of this study include development of a hydrogeologic framework for the Des Moines River alluvial aquifer near Des Moines, Iowa, and construction of a groundwater-flow model. Results from this study can provide information on groundwater supplies and the effects that changes in future groundwater pumping, using the existing and potential additional wells, have on nearby existing production wells and water levels in the Des Moines River. More specifically, the primary benefits of the study include the following:
-
• development of a groundwater-flow model that could be used for water-supply planning,
-
• information on the potential effects of hypothetical wells on existing production wells,
-
• an inventory of groundwater resources in the Des Moines River alluvial aquifer, and
-
• estimates of hydrogeologic properties to inform and enhance construction of the groundwater-flow model and general understanding of the Des Moines River alluvial aquifer.
Groundwater-Flow Model Background
Groundwater-flow models are used to help us understand water availability and movement of water beneath the land surface. They can also help predict trends in groundwater levels, explore instances of drought, and better understand the effects of increased or decreased well pumping and variability of pumping in supply wells within the model area. The data from a groundwater-flow model can then be used to make decisions regarding the vulnerability and sustainability of a groundwater supply. A steady-state groundwater-flow model of the Des Moines River alluvial aquifer near Prospect Park in Des Moines, Iowa, is available (Ha, 2021; FitzGerald and others, 2022), but a groundwater-flow model that encompasses a larger geographic portion of the Des Moines River alluvial aquifer would be beneficial (fig. 1).
Construction of a groundwater-flow model begins by conceptually characterizing the aquifer extent, lithology, and aquifer properties. The Des Moines River alluvial aquifer consists of alluvial deposits including current channel, high and low terrace deposits, and glacial outwash sands and gravels (Thompson, 1984; Bettis and Hoyer, 1986; Quade and others, 2002, 200311) underlain by Pennsylvanian-age bedrock, which consist of shales, fossiliferous limestone, and very fine-to-medium grained sandstone (Pope and others, 2002). The Quaternary-age deposits of the Des Moines River alluvial aquifer are a mixture of alluvial and glacial deposits that represent a complex depositional history. Glacial till and outwash were deposited as glaciers historically advanced and retreated over the landscape. Glacial deposits are then altered as the Des Moines River erodes and deposits sediments within its alluvial channel. Quaternary-age deposits range in thickness from 10 to 225 feet in Polk County (Quade and others, 2002). Understanding of the complex depositional pattern within the Des Moines River alluvial aquifer can be greatly enhanced using various geophysical methods to provide information beyond what can be understood from a surficial geology map. Data collected using geophysical methods can be combined with geologic maps and data from test holes and observation wells to better characterize the Des Moines River alluvial aquifer.
Geophysical Methods Approach
A suite of geophysical methods was used along the Des Moines River, Beaver Creek, and in the Des Moines River floodplain in Des Moines, Iowa, to support the hydrogeologic characterization of the Des Moines River alluvial aquifer (Gruhn and others, 2021). Data were collected in 2018 through a coordinated effort by DMWW and the USGS. Methods included marine continuous resistivity profiling (CRP) and continuous seismic profiling (CSP), used concurrently; electrical resistivity tomography (ERT) profiles; and single-point horizontal-to-vertical spectral ratio (HVSR) passive seismic measurements. The CRP, CSP, ERT, and HVSR can all be used to estimate depth to bedrock and corroborate these estimates across methods. Collectively, the suite of geophysical methods can help characterize the subsurface and map the extent of the Des Moines River alluvial aquifer and bedrock topography.
Each method provides a specific set of information that, in combination, were used to help characterize the Des Moines River alluvial aquifer. The CRP and CSP methods are used concurrently and measure the same parameters using two different methods. CRP measures electrical properties, whereas CSP uses acoustics to characterize geologic materials and define depths of surfaces (Day-Lewis and others, 2006; Johnson and White, 2007). About 13 miles of CRP/CSP marine surveys were collected on the Des Moines River and Beaver Creek in Des Moines, Iowa (Gruhn and others, 2021). A total of three CRP/CSP line profiles were collected where CRP/CSP line 1 was 8.2 miles, CRP/CSP line 2 was 4.6 miles, and CRP/CSP line 3 was 0.60 mile (fig. 2, Gruhn and others, 2021). For the CRP data collection, a streamer consisting of 11 electrodes spaced 10 meters apart was towed behind a manned boat and data were collected using the dipole-dipole array type. In general, voltage measurements were made with larger electrode spacings that extend deeper into the subsurface (Day-Lewis and others, 2006). The approximate depth and the resistivity of the underlying geologic materials are determined through a process of inversion. CSP uses an acoustic sound source that travels through the water column, reflects off the bottom and subbottom layers, and is received at the transducer. CSP methods provide the depth to water bottom, and when sufficient signal penetration is achieved, can be used to delineate the depth of subbottom layers and topography of the bedrock surface (Day-Lewis and others, 2006).
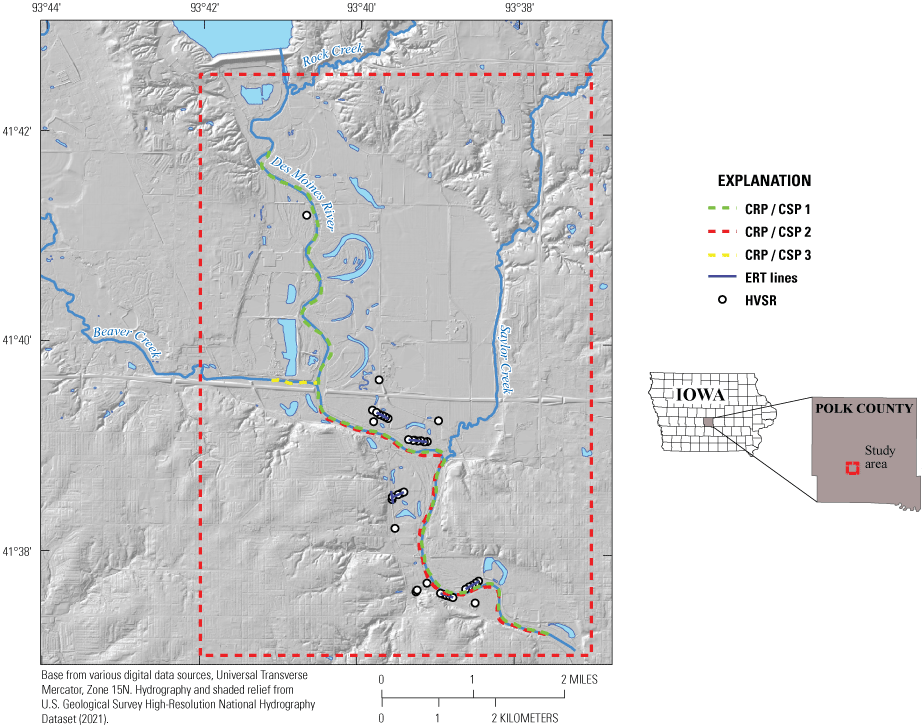
Map showing continuous resistivity profiling (CRP)/continuous seismic profiling (CSP) lines, electrical resistivity tomography (ERT) lines, and horizontal-to-vertical spectral ratio (HVSR) data collection locations in the Des Moines River alluvial aquifer, Des Moines, Iowa (data from Gruhn and others, 2021).
In addition to the continuous marine surveys, land-based ERT and HVSR methods were used to survey areas throughout the study area (fig. 3). Each ERT survey line consisted of 56 electrodes spaced 16 feet apart. During ERT measurements, current is injected and voltage is measured sequentially across multiple pairs of electrodes and used to determine the apparent resistivity of the subsurface (Loke, 2000). ERT measurements can be inverted to obtain resistivity profiles that can be interpreted as subsurface layers. Additionally, about 40 single-point HVSR passive seismic measurements were collected. Typically, HVSR was measured along ERT survey lines to help corroborate data between methods. The HVSR measures vertical and horizontal components of ambient seismic noise (Johnson and Lane, 2016). A resonance frequency (f0) is induced in the unconsolidated deposits when contrast is substantial (greater than 2:1) in shear-wave acoustic impedance between the overburden and the bedrock. The f0 is determined from the analysis of the spectral ratio of the horizontal and vertical components of the seismic data. In general, lower f0 relates to thicker sediments, and higher f0 relates to relatively thinner overburden. Together these geophysical datasets were used to characterize the distribution and thickness of unconsolidated materials within the Des Moines River alluvial aquifer and contribute to construction of the hydrogeologic framework. Using the hydrogeologic framework, a groundwater-flow model for the Des Moines River alluvial aquifer can be constructed for the study area and provide a tool that DMWW could use to evaluate aquifer development scenarios and better manage local groundwater resources.
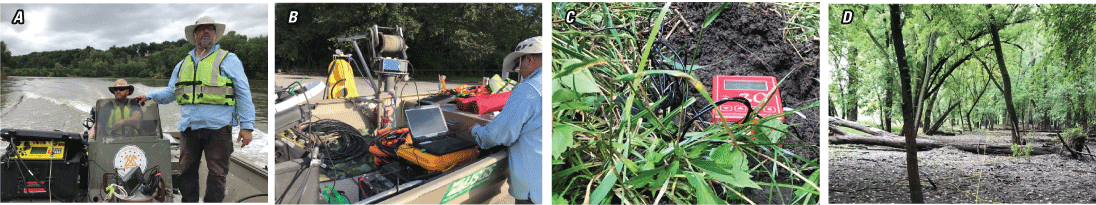
Photographs of geophysical data collection methods (photographs by Emilia L. Bristow, U.S. Geological Survey). A, Data collection on the Des Moines River. B, Scientists preparing for continuous resistivity profiling/continuous seismic profiling survey. C, Horizontal-to-vertical spectral ratio sensor that has been deployed. D, Electrical cables laid out for electrical resistivity tomography survey.
References Cited
Day-Lewis, F.D., White, E.A., Johnson, C.D., Lane, J.W., Jr., and Belaval, M., 2006, Continuous resistivity profiling to delineate submarine groundwater discharge—Examples and limitations: The Leading Edge, v. 25, no. 6, p. 724–728. [Also available at https://doi.org/10.1190/1.2210056.]
FitzGerald, K.M., Ha, W.S., Haj, A.E., Gruhn, L.R., Bristow, E.L., and Weber, J.R., 2022, A steady-state groundwater flow model for the Des Moines River alluvial aquifer near Prospect Park, Des Moines, Iowa: U.S. Geological Survey Open-File Report 2021–1110, 20 p. [Also available at https://doi.org/10.3133/ofr20211110.]
Gruhn, L.R., Bristow, E.L., and White, E.A., 2021, Geophysical data collected in the Des Moines River, Beaver Creek, and the Des Moines River floodplain, Des Moines, Iowa, 2018: U.S. Geological Survey data release, accessed August 2022 at https://doi.org/10.5066/P9B9AVKJ.
Ha, W.S., 2021, MODFLOW-NWT model used to simulate groundwater levels in the Des Moines River alluvial aquifer near Des Moines, Iowa: U.S. Geological Survey data release, accessed August 2022 at https://doi.org/10.5066/P9F3CKLC.
Johnson, C.D., and White, E.A., 2007, Marine geophysical investigation of selected sites in Bridgeport Harbor, Connecticut, 2006: U.S. Geological Survey Scientific Investigations Report 2007–5119, 32 p., online only, accessed August 2022 at https://doi.org/10.3133/sir20075119.
Johnson, C.D., and Lane, J.W., Jr., 2016, Statistical comparison of methods for estimating sediment thickness from horizontal-to-vertical spectral ratio (HVSR) seismic methods—An example from Tylerville, Connecticut, USA, in Symposium on the Application of Geophysics to Engineering and Environmental Problems, March 20–24, 2016, Denver, Colo., Proceedings: Denver, Colorado, Environmental and Engineering Geophysical Society, p. 317–323. [Also available at https://doi.org/10.4133/SAGEEP.29-057.]
Loke, M.H., 2000, Electrical imaging surveys for environmental and engineering studies—A practical guide to 2D and 3D surveys, short course training notes: Penang, Malaysia, University Sains Malaysia, 67 p. [Also available at https://www.academia.edu/11991713/Electrical_imaging_surveys_for_environmental_and_engineering_studies_A_practical_guide_to_2_D_and_3_D_surveys.]
Pope, J.P., Witzke, B.J., Anderson, R.R., Ludvigson, G.A., Bunker, B.J., and Greeney, S., 2002, Bedrock geology of south-central Iowa: Iowa Department of Natural Resources, Open File Map 02-1, scale 1:250,000. [Also available at https://www.iihr.uiowa.edu/igs/publications/uploads/ofm-2002-1.pdf.]
Quade, D.J., Giglierano, J.P., Bettis, E.A., III, and Artz, J.A., 2003, Surficial geologic materials of Polk County, Iowa: Iowa Department of Natural Resources, Geological Survey Bureau Open File Map Series 2003-3, accessed May 28, 2020, at https://publications.iowa.gov/26206/.
Quade, D.J., Giglierano, J.D., Bettis, E.A., III, and Wisner, R.J., 2002, Surficial geologic map of the Des Moines Lobe of Iowa, phase 4: Dallas County, scale 1:100,000, supported by Cooperative Agreement 010-HQAG-0091, accessed September 20, 2022, at http://s-iihr34.iihr.uiowa.edu/publications/uploads/ofm-2002-2_txt.pdf.
Thompson, C.A., 1984, Hydrogeology and water quality of the Upper Des Moines River alluvial aquifer: Iowa Geological Survey, Open File Report 84-5, 170 p. [Also available at https://publications.iowa.gov/26427/1/OFR-1984-5.pdf.]
U.S. Geological Survey, 2021, National Hydrography Dataset—USGS National Hydrography Dataset Best Resolution for Hydrologic Unit 4 – 2001: U.S. Geological Survey website, accessed November 4, 2021, at https://www.usgs.gov/national-hydrography/access-national-hydrography-products.
For more information about this publication, contact:
Director, USGS Central Midwest Water Science Center
405 North Goodwin
Urbana, IL 61801
217–328–8747
For additional information, visit: https://www.usgs.gov/centers/cm-water
Publishing support provided by the Rolla Publishing Service Center
Disclaimers
Any use of trade, firm, or product names is for descriptive purposes only and does not imply endorsement by the U.S. Government.
Although this information product, for the most part, is in the public domain, it also may contain copyrighted materials as noted in the text. Permission to reproduce copyrighted items must be secured from the copyright owner.
Suggested Citation
Thomas, J.C., Spring, M.A., Gruhn, L.R., and Bristow, E.L., 2023, Application of geophysical methods to enhance aquifer characterization and groundwater-flow model development, Des Moines River alluvial aquifer, Des Moines, Iowa, 2022: U.S. Geological Survey Fact Sheet 2023–3006, 4 p., https://doi.org/10.3133/fs20233006.
ISSN: 2327-6932 (online)
Study Area
| Publication type | Report |
|---|---|
| Publication Subtype | USGS Numbered Series |
| Title | Application of geophysical methods to enhance aquifer characterization and groundwater-flow model development, Des Moines River alluvial aquifer, Des Moines, Iowa, 2022 |
| Series title | Fact Sheet |
| Series number | 2023-3006 |
| DOI | 10.3133/fs20233006 |
| Publication Date | March 14, 2023 |
| Year Published | 2023 |
| Language | English |
| Publisher | U.S. Geological Survey |
| Publisher location | Reston, VA |
| Contributing office(s) | Central Midwest Water Science Center |
| Description | Report: 4 p.; 2 Data Releases; Dataset |
| Country | United States |
| State | Iowa |
| City | Des Moines |
| Other Geospatial | Des Moines River |
| Online Only (Y/N) | Y |