Potential Drivers of Change in Fluxes of Nutrients and Total Suspended Solids in the Upper White River Basin, Indiana, Water Years 1997–2019
Links
- Document: Report (2.99 MB pdf) , HTML , XML
- Related Work: Scientific Investigations Report 2023–5025 - Trends in Environmental, Anthropogenic, and Water-Quality Characteristics in the Upper White River Basin, Indiana
- NGMDB Index Page: National Geologic Map Database Index Page (html)
- Download citation as: RIS | Dublin Core
Introduction
The upper White River Basin (hydrologic unit 05120201) drains approximately 2,718 square miles in central and east-central Indiana (fig. 1). The basin encompasses all or part of 16 counties, which contain some of the most populated cities in Indiana (such as, Indianapolis, Fishers, Muncie, and Anderson) (STATS Indiana, 2022), more than 2,180 miles of streams (Tedesco and others, 2011), and four water-supply reservoirs. The area including the upper White River Basin is a major source of nitrogen and phosphorus, on a unit area basis (Robertson and Saad, 2013). Consequently, that area is of interest to water resource managers and conservation agencies concerned about nutrient-related effects on water quality.
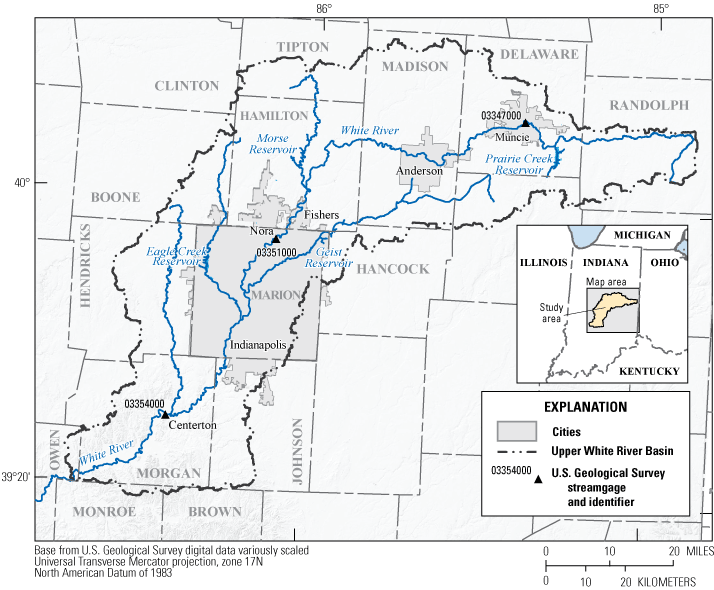
Map of the study area showing locations of study gages in the upper White River Basin, central and east-central Indiana.
As of 2019, agriculture was the dominant land cover in the upper White River Basin (constituting approximately 55.6 percent of the basin), followed by developed (29.5 percent) and forested (13.3 percent) land covers (Koltun, 2023). In general, agricultural land cover in the upper White River Basin decreased as a percentage of the drainage area from the headwaters to downstream locations on the main stem. That decrease was mostly offset by a complementary increase in developed land cover (Koltun, 2023).
The U.S. Geological Survey and The Nature Conservancy previously collaborated (Koltun, 2019) to evaluate changes and trends in the concentrations and flux (mass transported per unit time) of nutrients (total phosphorus, as phosphorus; nitrate plus nitrite, as nitrogen; and total Kjeldahl nitrogen, as nitrogen) and total suspended solids (TSS) at three study gages on the upper White River (table 1). The study gages, located on the White River at Muncie, near Nora, and near Centerton, Indiana, are hereafter referred to as the Muncie, Nora, and Centerton gages, respectively. Koltun (2023) extended and updated the 2019 study using 3 additional years of data and newer estimation methods. This new study also provided information about several anthropogenic factors that could influence the concentrations and fluxes of nutrients and TSS in the upper White River Basin.
Table 1.
Study gages whose data were used in the analyses by Koltun (2023).[mi2, square miles; NAD 83, North American Datum of 1983; USGS, U.S. Geological Survey]
Assessing Temporal Changes in Concentrations and Fluxes
Weighted Regressions on Time Discharge and Season (WRTDS) bootstrap tests (Hirsch and others, 2015) were used in Koltun (2023) to assess the magnitude, direction, and likelihood of change in “flow-normalized” concentrations and fluxes of nutrients and TSS from water years 1997 to 2019. Annual fluxes of nitrate plus nitrite estimated by Koltun (2023), using WRTDS and annual mean streamflows at the Centerton gage (fig. 2), show considerable interannual variation (“noise”) and a positive correlation (Pearson’s r = 0.725) between flux and streamflow. The WRTDS flow-normalization process attempts to filter out that “noise” so that temporal trends in concentration or flux, that are caused by factors other than interannual variation in streamflow (such as, changes in land use or land management), are more apparent (Hirsch and DeCicco, 2015).
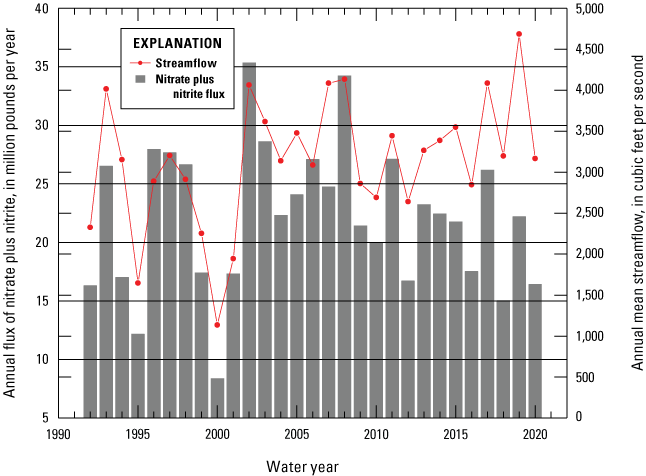
Plot of annual fluxes of nitrate plus nitrite estimated by Koltun (2023) and annual mean streamflows at the White River near Centerton, Indiana (U.S. Geological Survey streamgage 03354000; U.S. Geological Survey, 2022).
Even though the standard WRTDS flow-normalization process attempts to compensate for the effects of interannual variation in streamflow, it doesn’t explicitly compensate for changes in the statistical properties of streamflow over time. For example, annual mean streamflows at the Nora gage have been increasing since about the mid-1970s, as shown by a Locally Weighted Scatterplot Smooth (LOWESS) line fit to the annual mean streamflow values (fig. 3). The increases in mean streamflows at the Nora gage were not because of regulation or diversion but are likely the result of increases in precipitation over the same period, as indicated by the similar pattern of change in annual precipitation totals at the nearby Indianapolis International Airport (fig. 3).
A process (like streamflow) whose statistics change with time is said to be non-stationary. Non-stationary streamflow was not explicitly compensated for in the analyses of concentration and flux changes in Koltun (2019); however, Koltun (2023) used generalized flow normalization (Choquette and others, 2019), which compensates for some of the non-stationarity (table 2). The reliability of the change result for TSS at Centerton in the 2023 study is uncertain because of a large gap in the TSS record for that gage.
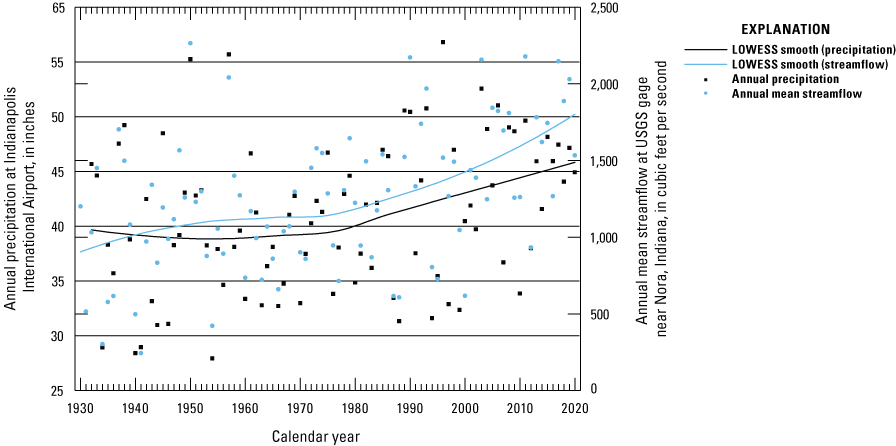
Plot of annual mean streamflows at the White River near Nora, Indiana (U.S. Geological Survey streamgage 03351000; U.S. Geological Survey, 2022), and annual precipitation totals at the Indianapolis International Airport with LOWESS smooth lines (data from Koltun, 2023).
Table 2.
Directions of change in generalized flow-normalized concentrations and fluxes of nutrients and total suspended solids from water years 1997 to 2019 (data from Koltun, 2023; U.S. Geological Survey, 2022).[TSS, total suspended solids; TP, total phosphorus as phosphorus, NOx, nitrate plus nitrite as nitrogen; TKN, total Kjeldahl nitrogen as nitrogen; L, likely; VL, very likely; HL, highly likely; FNG, generalized flow normalization; USGS, U.S. Geological Survey; ALAN, as likely as not]
Determining What is Driving Change
Even after compensating for interannual variability and non-stationarity in the streamflow record, determining causation for the temporal changes in concentrations and fluxes of constituents is confounded by temporal changes in other interrelated factors. For example, the percentages of cultivated crops and pasture/hay in the intervening drainage between the Nora and Centerton gages declined by 3.49 and 1.18 percent, respectively, between 2001 and 2019 when the percentages of low, medium, high intensity developed landcovers increased by 1.18, 2.67, and 1.15 percent, respectively (fig. 4). The conversion from agricultural to developed landcovers was correlated with increases in population. Census data for the three most populated city/metro areas in the upper White River Basin (STATS Indiana, 2022) show that between 2000 and 2020, the population of the Indianapolis metro area increased rapidly while populations in City of Anderson (also part of the Indianapolis metro area) and the Muncie metro area declined slightly (fig. 5). Overall, the population in the three city/metro areas increased by more than 445,000 between 2000 and 2020.
Changes to landcover composition and population can affect the delivery of nutrients to streams. For example, in 12 of the 16 counties constituting the upper White River Basin (the upper White River Basin comprised very small portions of the four omitted counties), the mass of nitrogen and phosphorus fertilizer applied as manure decreased between 1987 and 2017, but the much smaller mass of nitrogen from commercial fertilizers applied in non-farm settings increased (fig. 6). These temporal trends might be related to the conversion of agricultural to developed landcovers that frequently accompanies population growth. Even if population growth were to cause a net reduction in fertilizer usage, it can result in increased nutrient loads to streams from increased treated wastewater discharges. Those loads can change over time as wastewater delivery and treatment processes change.
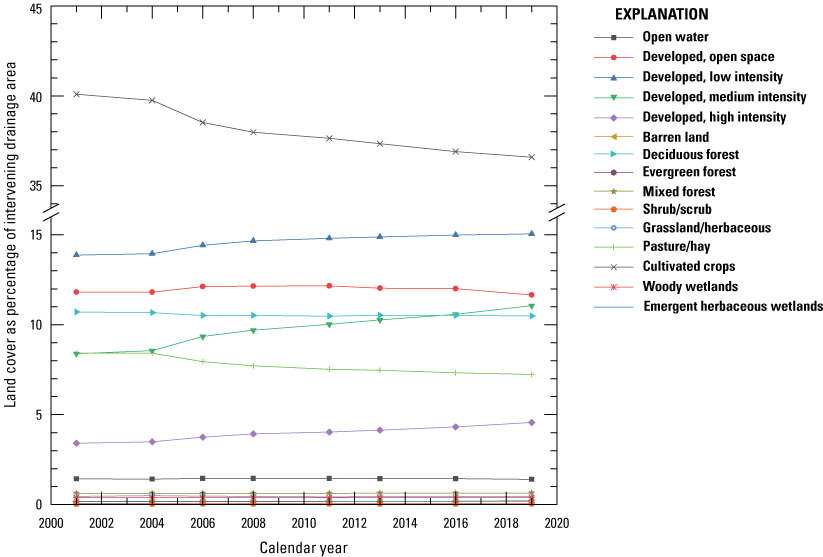
Plot of land cover as a percentage of intervening drainage area for the White River near Centerton, Indiana, 2001–19 (data from U.S. Department of Agriculture, 2021).
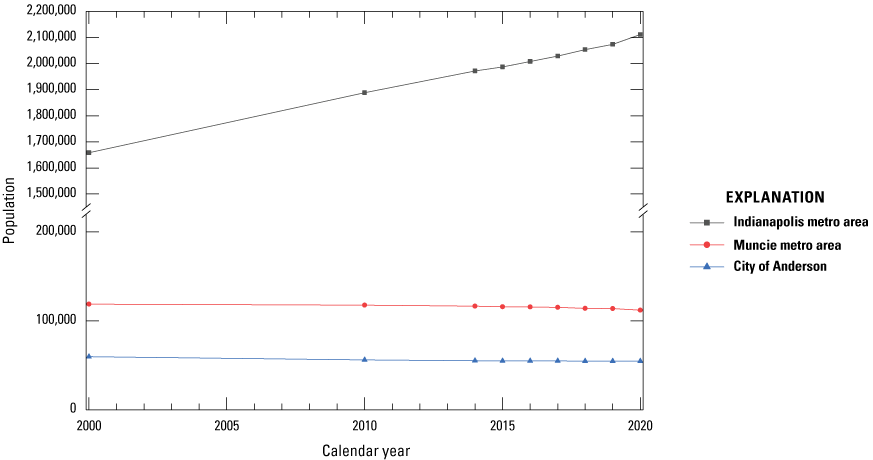
Plot of population as a function of year for the City of Anderson and the Muncie and Indianapolis, Indiana, metro areas, 2000–20 (data from Koltun, 2023).
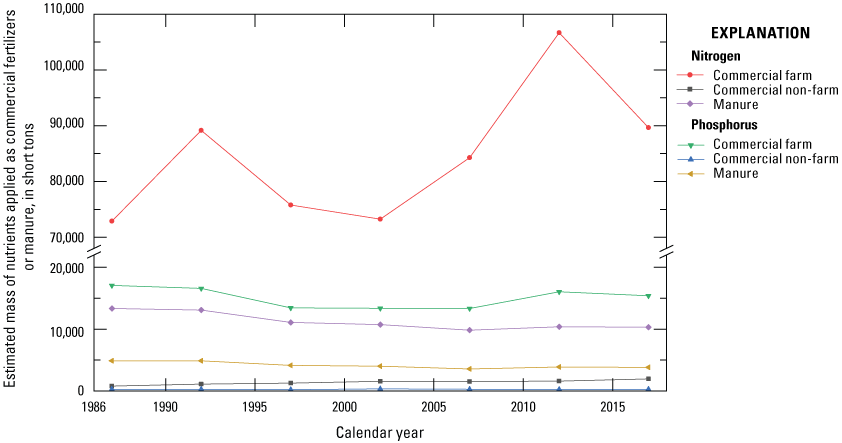
Plot of estimated total mass of nutrients applied as commercial fertilizers or manure as a function of time during the period 1987–2017 summed for Boone, Delaware, Hamilton, Hancock, Hendricks, Henry, Johnson, Madison, Marion, Morgan, Randolph, and Tipton Counties, Indiana (modified from Koltun, 2023).
Summary
The foregoing discussions illustrate the complexities surrounding identifying temporal changes in nutrient and total suspended solids (TSS) concentrations and fluxes caused by factors other than interannual variation in streamflow, and in determining what drives those changes. Analytical techniques have evolved, enhancing our ability to compensate for interannual variation and long-term trends in streamflow; however, determining the drivers of change in concentration or flux remains challenging, particularly if there are multiple potentially interrelated factors. Additional water-quality and streamflow monitoring (both in time and space) as well as more frequent, accurate, and spatially resolved data on factors that can influence nutrient and TSS transport are needed to better understand drivers of temporal changes in water quality in the upper White River Basin.
Acknowledgments
This fact sheet was prepared in cooperation with The Nature Conservancy with generous support from the Nina Mason Pulliam Charitable Trust.
References Cited
Choquette, A.F., Hirsch, R.M., Murphy, J.C., Johnson, L.T., and Confesor, R.B., Jr., 2019, Tracking changes in nutrient delivery to western Lake Erie—Approaches to compensate for variability and trends in streamflow: Journal of Great Lakes Research, v. 45, no. 1, p. 21–39, accessed April 8, 2021, at https://doi.org/10.1016/j.jglr.2018.11.012.
Hirsch, R.M., and DeCicco, L.A., 2015, User guide to Exploration and Graphics for RivEr Trends (EGRET) and dataRetrieval—R packages for hydrologic data (ver. 2.0, February 2015): U.S. Geological Survey Techniques and Methods, book 4, chap. A10, 93 p., accessed April 8, 2021, at https://doi.org/10.3133/tm4A10.
Hirsch, R.M., Archfield, S.A., and De Cicco, L.A., 2015, A bootstrap method for estimating uncertainty of water quality trends: Environmental Modelling & Software, v. 73, p. 148–166, accessed April 8, 2021, at https://doi.org/10.1016/j.envsoft.2015.07.017.
Koltun, G.F., 2019, Trends in streamflow and concentrations and flux of nutrients and total suspended solids in the upper White River at Muncie, near Nora, and near Centerton, Indiana: U.S. Geological Survey Scientific Investigations Report2019–5119, 34 p. [Also available at https://doi.org/10.3133/sir20195119.]
Koltun, G.F., 2023, Trends in environmental, anthropogenic, and water-quality characteristics in the upper White River Basin, Indiana: U.S. Geological Survey Scientific Investigations Report 2023–5025, 46 p., https://doi.org/10.3133/sir20235025.
Robertson, D.M., and Saad, D.A., 2013, SPARROW models used to understand nutrient sources in the Mississippi/Atchafalaya River Basin: Journal of Environmental Quality, v. 42, no. 5, p. 1422–1440, accessed September 28, 2021, at https://doi.org/10.2134/jeq2013.02.0066.
STATS Indiana, 2022, Population estimates for Indiana's incorporated places, 2010–2020: State of Indiana database, accessed February 10, 2022, at https://www.stats.indiana.edu/topic/population.asp.
Tedesco, L.P., Hoffman, J., Bihl, L., Hall, B.E., Barr, R.C., and Stouder, M., 2011, Upper White River watershed regional watershed assessment and planning report: Indianapolis, Upper White River Watershed Alliance Report, 350 p., accessed December 4, 2018, at https://thewhiteriveralliance.org/wp-content/uploads/2018/08/upper-White-River-Watershed-Regional-Plan.pdf. [Also available at https://thewhiteriveralliance.org/about-the-river/watershed-studies/.]
U.S. Department of Agriculture, 2021, National Agricultural Statistics Service cropland data layers—2007–2020: U.S. Department of Agriculture, National Agricultural Statistics Service database, accessed September 15, 2021, at https://www.nass.usda.gov/Research_and_Science/Cropland/Release/.
U.S. Geological Survey, 2022, USGS water data for the Nation: U.S. Geological Survey National Water Information System database, accessed October 2021, at https://nwis.waterdata.usgs.gov/nwis. [Also available at https://doi.org/10.5066/F7P55KJN.]
For more information about this report, contact:
Director, Ohio-Kentucky-Indiana Water Science Center
U.S. Geological Survey
5957 Lakeside Blvd.
Indianapolis, IN 46278-1996
or visit our website at
Disclaimers
Any use of trade, firm, or product names is for descriptive purposes only and does not imply endorsement by the U.S. Government.
Although this information product, for the most part, is in the public domain, it also may contain copyrighted materials as noted in the text. Permission to reproduce copyrighted items must be secured from the copyright owner.
Suggested Citation
Koltun, G.F. and Hauswald, C., 2023, Potential drivers of change in fluxes of nutrients and total suspended solids in the upper White River Basin, Indiana, Water Years 1997–2019: U.S. Geological Survey Fact Sheet 2023–3009, https://doi.org/10.3133/fs20233009.
ISSN: 2327-6932 (online)
Study Area
| Publication type | Report |
|---|---|
| Publication Subtype | USGS Numbered Series |
| Title | Potential drivers of change in fluxes of nutrients and total suspended solids in the upper White River Basin, Indiana, Water Years 1997–2019 |
| Series title | Fact Sheet |
| Series number | 2023-3009 |
| DOI | 10.3133/fs20233009 |
| Publication Date | April 14, 2023 |
| Year Published | 2023 |
| Language | English |
| Publisher | U.S. Geological Survey |
| Publisher location | Reston, VA |
| Contributing office(s) | Ohio-Kentucky-Indiana Water Science Center |
| Description | 6 p. |
| Country | United States |
| State | Indiana |
| Other Geospatial | Upper White River Basin |
| Online Only (Y/N) | Y |
| Additional Online Files (Y/N) | N |


