

River Water Quality in the Delaware River Basin—Concentrations and Trends Through 2018
Links
- Document: Report (5.94 MB pdf) , HTML , XML
- Related Work: USGS SIR 2022–5097
- Data Releases:
- USGS—Water-quality trends for rivers and streams in the Delaware River Basin using Weighted Regressions on Time, Discharge, and Season (WRTDS) models, Seasonal Kendall Trend (SKT) tests, and multisource data, water year 1978–2018
- USGS—Multisource surface-water-quality data and U.S. Geological Survey streamgage match for the Delaware River Basin
- NGMDB Index Page: National Geologic Map Database Index Page (html)
- Download citation as: RIS | Dublin Core
Introduction
The Delaware River Basin (fig. 1) provides drinking water to 13.3 million people and supports endangered species, provides recreational opportunities, and is an essential resource to regional industries (Delaware River Basin Commission [DRBC], 2019). The efforts of Federal and State governments have substantially improved overall water quality in the basin, which had been severely degraded prior to the mid-20th century (Kummer, 2020). Recent trend analyses of water-quality data reveal negative and positive changes: increasing rates of salinization and improvements in nutrient conditions.
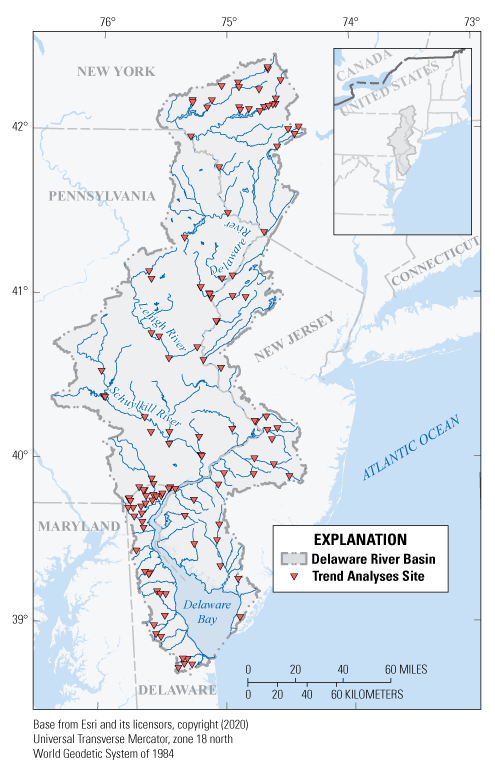
Map of sites with trends for at least one parameter.
Trend Analysis and Multisource Data
Trends (long-term changes) in water-quality parameters (salinity, major ions, nutrients, and suspended solids) were estimated at 124 river sites in the Delaware River Basin using data from eight monitoring organizations (table 1). This multisource dataset expanded the number of sites available for trend analysis and produced a richer set of water-quality records for each site (Shoda and others, 2019). Trends were determined for the longest possible period of record at each site, which varied among sites and parameters, with start years between 1968 and 2009 and end years of 2017 or 2018. Trends with p-values less than or equal to 0.1 were considered significant.
Table 1.
The collecting organizations that contributed data to the trends results discussed in this report, and the number of water-quality records that each organization supported.Changes in annual mean concentrations were assessed using Seasonal Kendall Trend (SKT) tests and, where possible, with the Weighted Regressions on Time, Discharge, and Season (WRTDS) model (Murphy and others, 2020). SKT and WRTDS results were in strong agreement, so the results presented here combine SKT trends and WRTDS trends for the same parameters (Shoda and Murphy, 2022).
At each site and for each parameter, the magnitude of the change in annual mean concentrations over the period of record and the rate of change between 5-year subperiods were computed and summarized. Additionally, across all sites, the changes in annual mean concentrations were compared to watershed land uses and changes in land cover. Where possible, the annual mean concentrations for the first and last years of the trends were also compared to an appropriate threshold above which concentrations may be hazardous to human or aquatic life.
Salinity and Major Ions
Water availability for human health and aquatic life is threatened by increasing salinization. High salinity can affect the taste and health of drinking water and corrode water distribution systems (DRBC, 2019). The term “salinity” refers to the dissolved salt content in water. It can be measured in terms of specific conductance (SC), total dissolved solids (TDS), or the concentrations of major ions that contribute to salinity: calcium, chloride, magnesium, potassium, sodium, and sulfate. This study found widespread increases in SC, TDS, chloride, and sodium, and found that increases in salinity have been occurring more quickly in recent years.
Many sites across the Delaware River Basin had increases in salinity over their period of record. These increases are particularly evident in the concentration trends of TDS, SC, sodium, and chloride, where median percent changes across the period of record for these sites range from 27.5 to 76.4 percent (fig. 2A). For TDS and SC, trends were upward at most sites (50 and 73 percent, respectively); only 7 and 8 percent, respectively, of sites had downward trends, with the remaining sites having nonsignificant (43 and 19 percent, respectively) trends. Upward trends in sodium and chloride concentrations were even more common across sites, with 1 and 6 sites having downward trends, respectively (fig. 2A).
The increases in salinity observed at many sites in the basin also appear to have accelerated over time. This pattern is demonstrated by subdividing the SC period of record at each site into 5-year periods and computing the change in annual mean SC between the start and end of these subperiods. Plotting these 5-year changes over time and summarizing into median 5-year changes across the sites shows the rate of change rose from 8 microsiemens per centimeter at 25 degrees Celsius (μS/cm) during the earliest 5-year period (1993–98) to 14 μS/cm in the latest 5-year period (2013–18) (fig. 3A). A similar pattern was apparent for TDS, sodium, and chloride.
Management approaches that aim to mitigate the continued salinization of rivers and streams in the basin depend on investigations into the drivers of salinization. Positive relationships, albeit with increased variability, between water-quality change and the total amount of watershed land surface change were observed for salinity parameters (such as SC [fig. 4A]) and major ions (with the exception of sulfate) and serve as a starting point for the investigation of drivers. Additionally, TDS may be more of a concern than chloride given that, at current rates of change, projections estimate that chloride concentrations at most of the sites will not exceed the secondary drinking water standard within 100 years (U.S. Environmental Protection Agency [EPA], 2021a). However, TDS concentrations already exceed the secondary drinking water standard at four sites, and concentrations at an additional 43 percent of sites are increasing towards this standard.
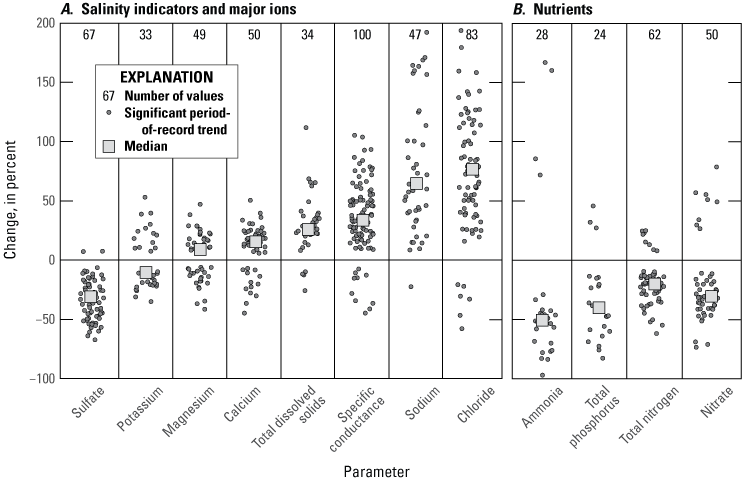
Percent change in annual mean concentration between the start and end of the period of record of A, salinity indicators and major ions and B, nutrients for sites that had significant (p ≤ 0.1) trends over the period of record. Each point represents one period-of-record trend for one site and the Median is the median percent change across the period-of-record trends at individual sites for each parameter. Changes greater than 200 percent are not shown.
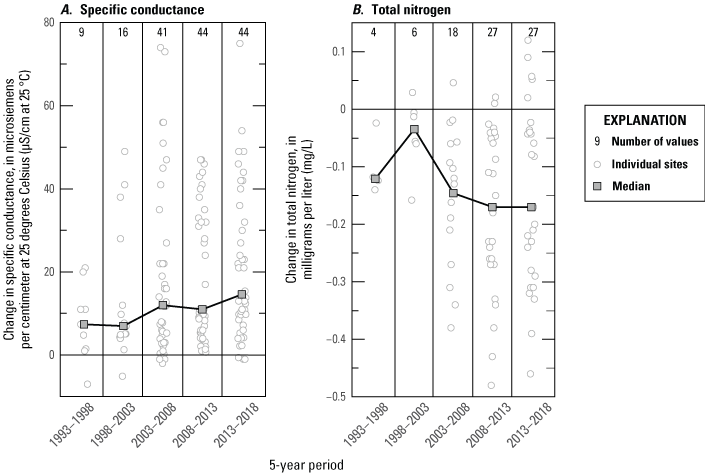
Changes in A, specific conductance and B, concentrations of total nitrogen between the start and end of 5-year periods for sites with significant (p ≤ 0.1) period-of-record trends from the Weighted Regressions on Time, Discharge, and Season model. Median is the median change across the individual sites for each 5-year period. Changes greater than 80 µS/cm for specific conductance and less than −0.5 mg/L for total nitrogen are not shown.
Nutrients and Suspended Solids
In contrast to salinity, annual mean nutrient concentrations primarily decreased over the period of record at most sites, with median percent changes across the sites ranging from −20 to −52 percent (fig. 2B). Comparing 5-year changes over time shows overall decreases in total nitrogen concentrations accelerated between 2003 and 2008, then stabilized (fig. 3B). Thus, between 1998 and 2003, many sites saw small decreases in total nitrogen, but by 2008–13, larger (more negative) decreases were occurring and persisted for the next 5 years. However, despite these decreases, most sites with significant total nitrogen and total phosphorus trends had concentrations above the EPA ecoregional nutrient criteria (EPA, 2021b). Relationships between nutrient trends and land surface changes were not indicated (fig. 4B).
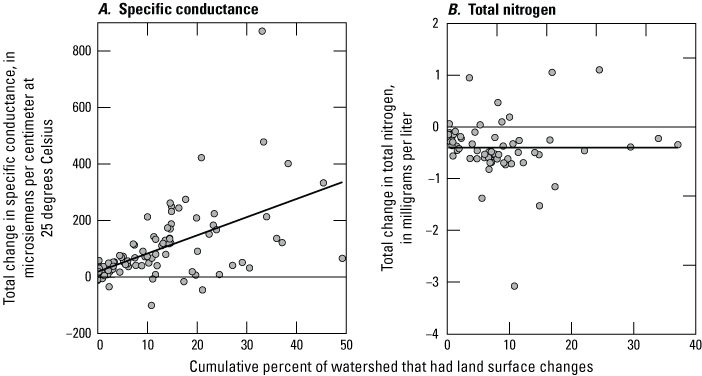
Changes in A, specific conductance and B, total nitrogen concentrations between the start and end of the period of record for sites with significant (p ≤ 0.1) trends and the cumulative change in land surface cover during the same period. Lines on the plots are fit using simple linear regression. The narrow lines at zero are a visual aid and do not represent data.
Excess nutrients promote the overgrowth of aquatic algae, which can lead to low oxygen concentrations that threaten aquatic life (DRBC, 2019). Overall decreases in nutrient concentrations suggest the success of management initiatives, although the persistence of concentrations that exceed EPA criteria warrant continued nutrient monitoring and management in the basin.
Total suspended solids (TSS) are particles in water that can be trapped by a filter. TSS had the largest percentage of nonsignificant trends (68 percent) out of all parameters assessed. When significant, TSS trends were decreasing, indicating potential progress in reducing sediment erosion in the basin.
References Cited
Delaware River Basin Commission [DRBC], 2019, State of the basin, 2019, accessed January 28, 2022, at https://www.state.nj.us/drbc/library/documents/SOTBreport_july2019.pdf.
Kummer, F., 2020, Delaware River named River of the Year by national environmental organization: The Philadelphia Inquirer, April 15, 2020, accessed October 27, 2020, at https://www.inquirer.com/news/delaware-river-american-rivers-environment-20200415.html.
Murphy, J.C., Shoda, M.E., and Follette, D.D., 2020, Water-quality trends for rivers and streams in the Delaware River Basin using Weighted Regressions on Time, Discharge, and Season (WRTDS) models, Seasonal Kendall Trend (SKT) tests, and multisource data, water year 1978–2018: U.S. Geological Survey data release, https://doi.org/10.5066/P9KMWNJ5.
Shoda, M.E., and Murphy, J.C., 2022, Water-quality trends in the Delaware River Basin calculated using multisource data and two methods for trend periods ending in 2018: U.S. Geological Survey Scientific Investigations Report 2022–5097, 60 p., accessed December 2022 at https://doi.org/10.3133/sir20225097.
Shoda, M.E., Murphy, J.C., Falcone, J.A., and Duris, J.W., 2019, Multisource surface-water-quality data and U.S. Geological Survey streamgage match for the Delaware River Basin: U.S. Geological Survey data release, https://doi.org/10.5066/P9PX8LZO.
U.S. Environmental Protection Agency [EPA], 2021a, Secondary drinking water standards—Guidance for nuisance chemicals, accessed January 28, 2022, at https://www.epa.gov/sdwa/secondary-drinking-water-standards-guidance-nuisance-chemicals.
U.S. Environmental Protection Agency [EPA], 2021b, Ecoregional nutrient criteria for rivers and streams, accessed January 28, 2022, at https://www.epa.gov/nutrient-policy-data/ecoregional-nutrient-criteria-rivers-and-streams.
For more information about this publication, contact
Program Coordinator
U.S. Geological Survey
Water Availability and Use Science Program
National Water Quality Program
Email: wausp-info@usgs.gov
For additional information, visit
https://www.usgs.gov/programs/national-water-quality-program
Publishing support provided by the
Lafayette Publishing Service Center
Disclaimers
Any use of trade, firm, or product names is for descriptive purposes only and does not imply endorsement by the U.S. Government.
Although this information product, for the most part, is in the public domain, it also may contain copyrighted materials as noted in the text. Permission to reproduce copyrighted items must be secured from the copyright owner.
Suggested Citation
Shoda, M., Gain, E.G., and Murphy, J.C., 2023, River water quality in the Delaware River Basin—Concentrations and trends through 2018: U.S. Geological Survey Fact Sheet 2023–3014, 4 p., https://doi.org/10.3133/fs20233014.
ISSN: 2327-6932 (online)
Study Area
| Publication type | Report |
|---|---|
| Publication Subtype | USGS Numbered Series |
| Title | River water quality in the Delaware River Basin—Concentrations and trends through 2018 |
| Series title | Fact Sheet |
| Series number | 2023-3014 |
| DOI | 10.3133/fs20233014 |
| Publication Date | June 06, 2023 |
| Year Published | 2023 |
| Language | English |
| Publisher | U.S. Geological Survey |
| Publisher location | Reston, VA |
| Contributing office(s) | Lower Mississippi-Gulf Water Science Center, Ohio-Kentucky-Indiana Water Science Center, Central Midwest Water Science Center |
| Description | Report: 4 p., 2 Data Releases |
| Country | United States |
| State | Delaware, New Jersey, New York, Pennsylvania |
| Other Geospatial | Delaware River Basin |
| Online Only (Y/N) | Y |