

A Century of Hydrologic Data Collection Prepares Western Long Island for Current and Future Water-Resources Challenges
Links
- Document: Report (4.33 MB pdf) , HTML , XML
- Version History: Version History (2.88 KB txt)
- NGMDB Index Page: National Geologic Map Database Index Page (html)
- Download citation as: RIS | Dublin Core
Abstract
Freshwater is a vital natural resource. New York is a water-rich State; however, even here, the economical use of water resources is needed to ensure there is enough water of adequate quality for human and ecological needs—now and into the future. Nowhere in New York is this more evident than on Long Island where public-water supply is obtained from the sole-source aquifers directly beneath the 3 million people that live there. The U.S. Geological Survey works in partnership with the Nassau County Department of Public Works and Department of Health to monitor streamflow, groundwater, water quality, and water use.
Hydrologic Data for Long Island
Freshwater is a vital natural resource. New York is a water-rich State; however, even here, the economical use of water resources is needed to ensure there is enough water of adequate quality for human and ecological needs—now and into the future. Nowhere in New York is this more evident than on Long Island where public-water supply is obtained from the sole-source aquifers directly beneath the 3 million people that live there. Today [2023] in western Long Island’s Nassau County, groundwater is pumped from these aquifers by about 46 water suppliers and hundreds of private wells to meet the needs of about 1.4 million people (Masterson and Breault, 2019).
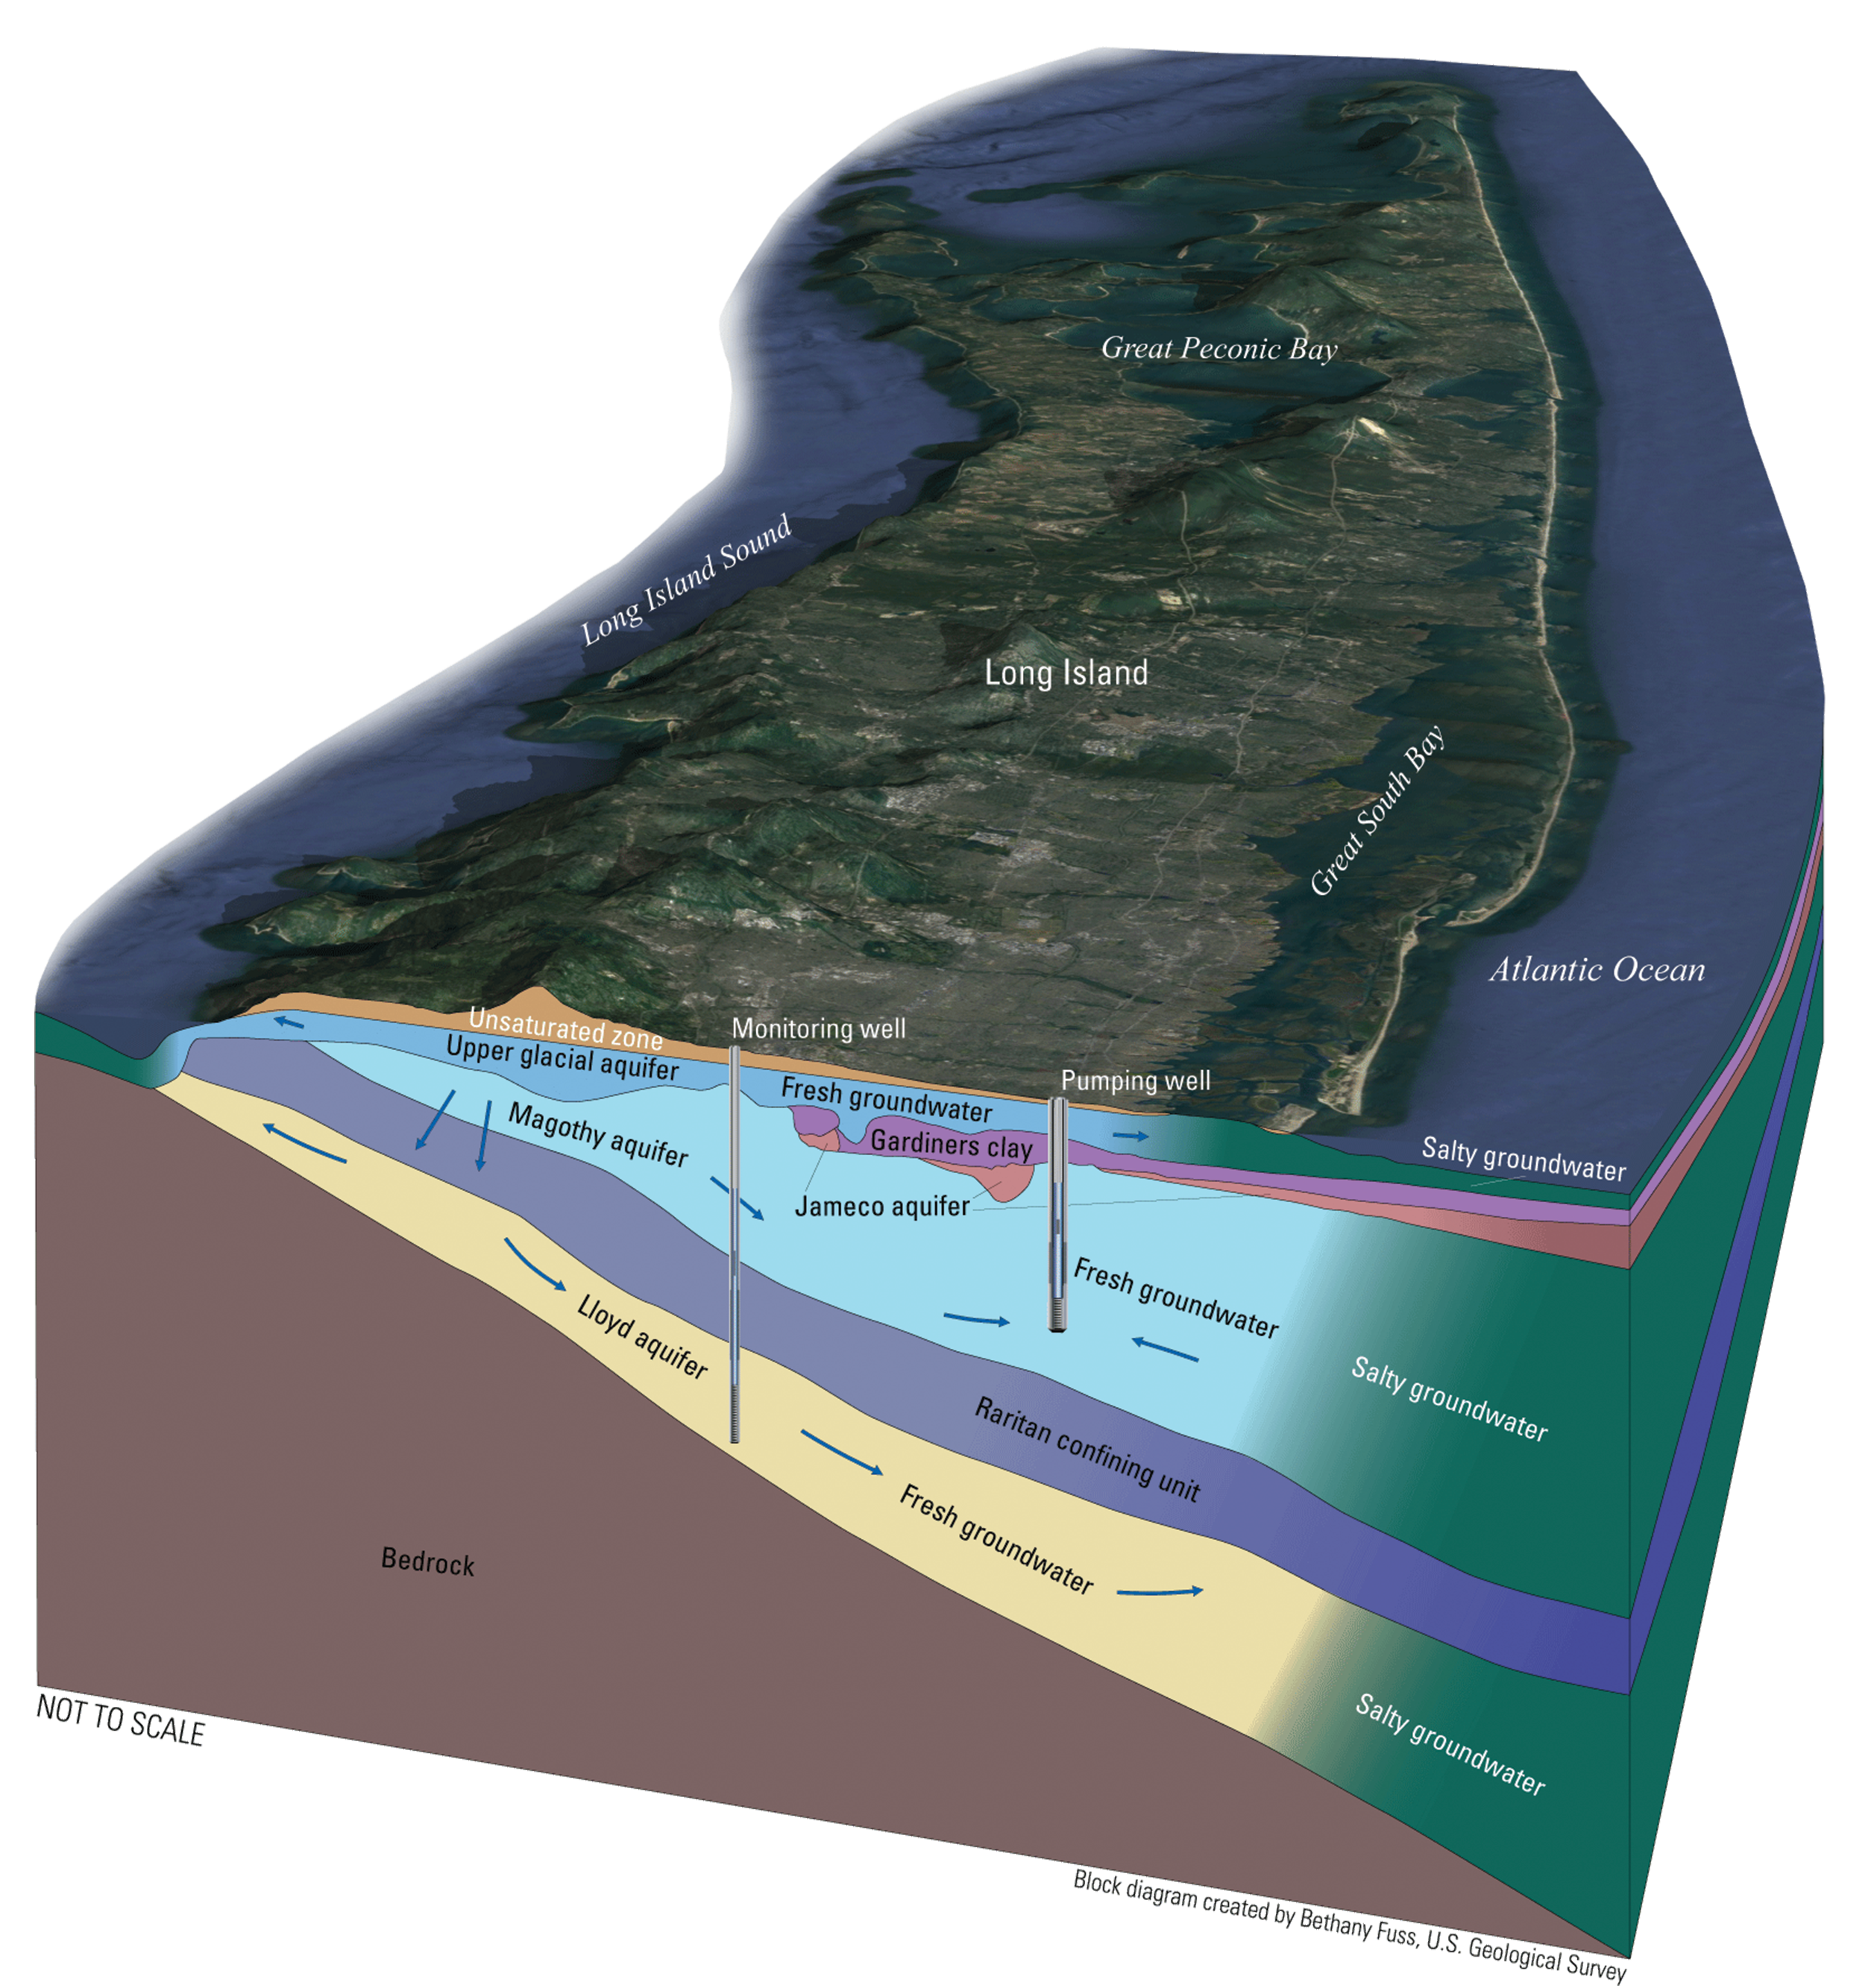
Groundwater on Long Island is the water that is present beneath land surface in pore spaces between grains of clay, silt, sand, and gravel and supplies freshwater to streams and rivers at points where the surface of the land intersects the water table. Areas where groundwater can be extracted in sufficient quantities are referred to as aquifers. On Long Island, groundwater is primarily stored in three such water-bearing units: the upper glacial, Magothy, and Lloyd aquifers. Collectively, these three aquifers—and other small, localized water-bearing units, along with intervening layers of poorly permeable sediments (referred to as confining units)—are known as the Long Island aquifer system (fig. 1).
Groundwater from Long Island’s aquifer system provides all the drinking water for the nearly 1.4 million residents of Nassau County, New York, and supports the ecology of groundwater-fed ponds, streams, wetlands, and coastal waters. All life on Long Island is dependent on this single vital resource.
Long-term monitoring is needed to understand how to best manage Nassau County’s groundwater resources. Fortunately, for more than 100 years, government entities, including the Nassau County Department of Public Works (DPW), New York State, and several towns and local water districts, have supported the collection of groundwater information. It cannot be overstated how important these long-term data are to guiding the sustainable management of the county’s water resources and to forecasting and preparing for the potential effects of climate change.
The U.S. Geological Survey (USGS), the Nation’s premier Earth science organization, works with partners to monitor, assess, research, and deliver information on a wide range of water-resources issues and conditions. In Nassau County, the USGS partners directly with the DPW and others to monitor streamflow, groundwater, water quality, and water use. These partnerships currently [2023] support 6 streamgages, 1 lake-level station, and 168 groundwater-monitoring wells that characterize conditions in the upper glacial, Magothy, and Lloyd aquifers (fig. 2; U.S. Geological Survey, 2022). Frequent-interval (once every 15 minutes) measurements of streamflow (6 sites), lake level (1 site), and groundwater elevation (18 sites) at 25 of the sites are electronically transmitted directly to the USGS National Water Information System (NWIS) database (U.S. Geological Survey, 2023) in near-real time. At the remaining groundwater sites, water levels are measured by USGS hydrographers, either monthly or annually, and entered into NWIS manually. Data in NWIS are stored and made available in perpetuity.
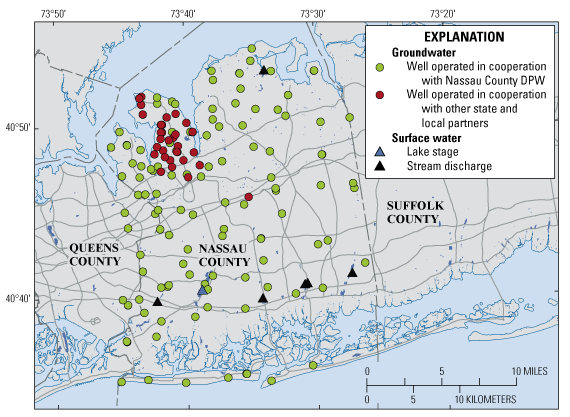
Map showing surface water and groundwater monitoring stations in the U.S. Geological Survey hydrologic monitoring network in Nassau County, New York, in 2023; see also U.S. Geological Survey (2022). DPW, Department of Public Works.
Groundwater level measurements go as far back as the early 1900s, becoming more frequent starting in the 1930s (fig. 3). Although the number of monitoring stations and the frequency of data collection has varied during the past 100 years, the continuous collection of water-resource information using scientifically rigorous and nationally consistent methods by trained USGS hydrographers has remained the same. Data collection, however, is only part of the equation; the maintenance of long-term data collection networks requires tremendous effort to ensure data are accurate, comparable, and representative.
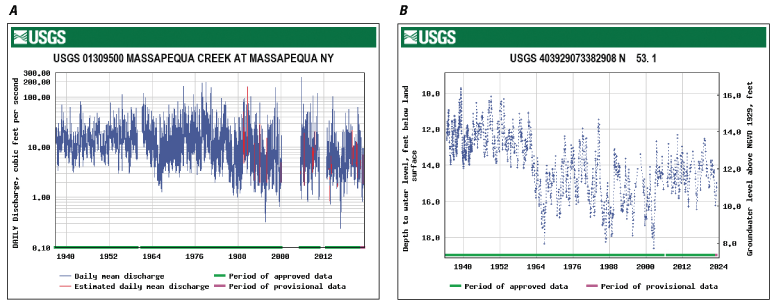
Hydrographs from data for Nassau County, New York, from the U.S. Geological Survey National Water Information System (U.S. Geological Survey, 2023). A, Stream discharge for the period of record (1936 to 2022) at Massapequa Creek at Massapequa, N.Y. (station 01309500). B, Groundwater levels in the upper glacial aquifer for the period of record (1934 to 2022) at well N 53.1 in Rockville Centre, N.Y. (station 403929073382908). The drop in water levels shown at well N 53.1 have been attributed to the severe drought in the 1960s followed by the installation of large-scale sanitary sewer systems, which lowered water levels throughout most of Nassau County.
The long-term maintenance of USGS data networks is required to ensure that data are collected to the highest standards and involves multiple tasks that taken together result in a high level of confidence in data collected by the USGS. These tasks involve calibrating electronic and mechanical equipment by using manual measurements to ensure collected data are accurate; surveying the elevation of reference marks to ensure long-term data are comparable with data collected in the past; and reviewing and updating, if necessary, long-term data records to account for any environmental changes that may have affected data collection.
The data collected by highly trained USGS staff using proven methods provide essential information needed to evaluate changes in the resource over time, to develop groundwater-flow models and forecast trends, and to design, implement, and monitor the effectiveness of groundwater management and protection programs (Taylor and Alley, 2001). An excellent contemporary [2023] example of the value of long-term groundwater-level data—that could not have been anticipated decades ago when the hydrologic data collection program started—is the use of the data in the development of a state-of-the-science island-wide groundwater-flow model. This model can reproduce (or simulate) past and current hydrologic conditions (groundwater levels and streamflows) and can be used to predict the most likely outcomes from changes in pumping and sewering and other potential changes in the environment, such as sea-level rise and prolonged droughts (Masterson and Breault, 2019). Other possible uses of long-term surface-water and groundwater data, include:
-
• estimating long-term changes in groundwater recharge and storage;
-
• assessing the effects of climatic variability;
-
• estimating the regional effects of groundwater development;
-
• generating statistical analyses of water-level trends;
-
• measuring changes in groundwater-flow directions;
-
• characterizing groundwater and surface-water interactions; and
-
• mapping the depth to groundwater below land surface.
Mapping the depth to groundwater below land surface has been an important part of the ongoing USGS–Nassau County partnership. Each spring, the USGS conducts a synoptic round of water level measurements across Long Island to define the geometry of the water table and potentiometric surfaces within the three main water-bearing units in the Long Island aquifer system. These data are used to construct depth-to-water maps (fig. 4; U.S. Geological Survey, 2019) that in turn are used in hydrogeologic investigations throughout the island and are used by water-resources managers and public-water suppliers for aquifer management and planning purposes (Como and others, 2018).
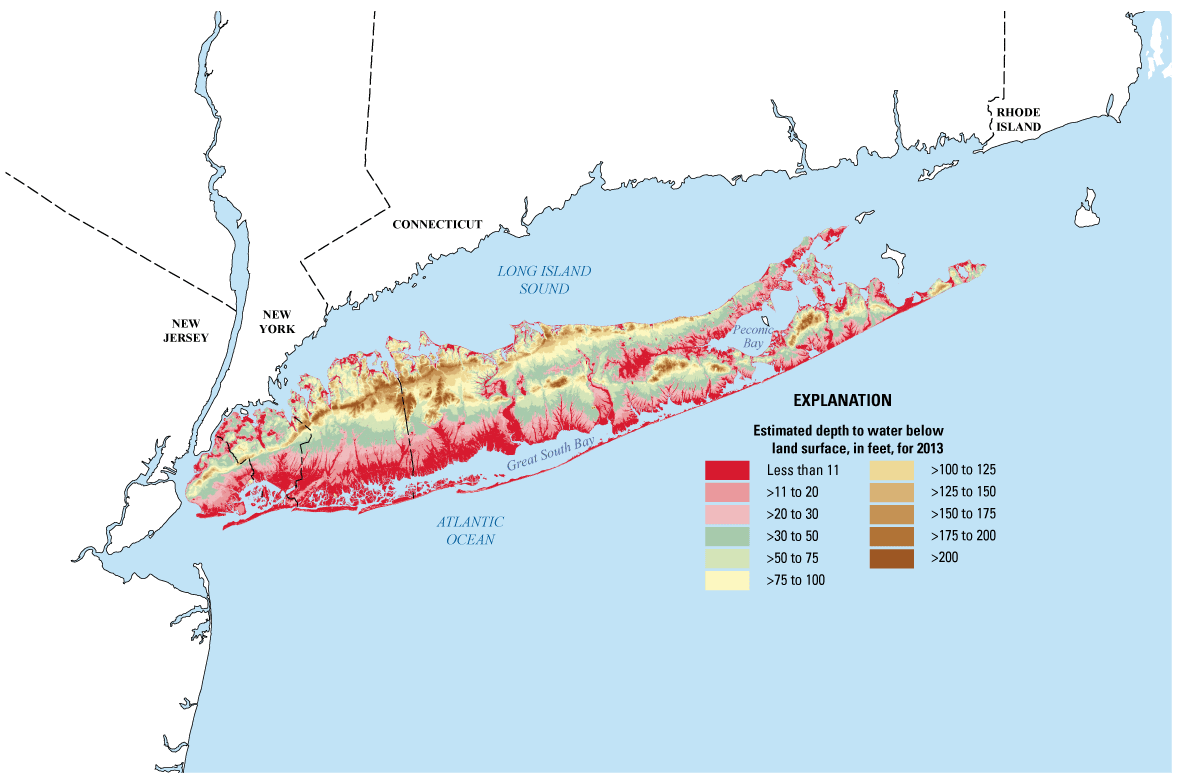
Map showing depth to the water on Long Island, New York, in April 2013; from U.S. Geological Survey (2019). <, less than; >, greater than.
In addition to streamflow and groundwater levels, the USGS, in partnership with Nassau County, has been monitoring long-term trends in water-quality (fig. 5). This is particularly important in places like Nassau County with many legacy sources of contamination and sandy soils that allow contaminants to move readily into the aquifer system. Many new classes of contaminants, if present, are found at low levels that require specialized labs and sampling methods to detect. The USGS has a long history of monitoring and documenting the presence of contaminants in groundwater on Long Island using cutting-edge analytical research methods. Contaminants introduced at the land surface have to be documented in the groundwater system so that water resource managers can plan for or respond to water-quality hazards to drinking water supplies.
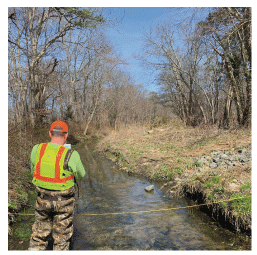
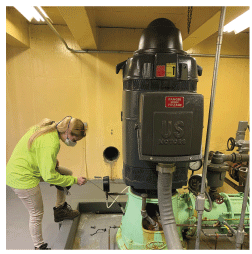
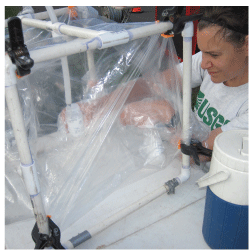
U.S. Geological Survey scientists collecting A, streamflow, B, groundwater-level, and C, water quality data.
Unbiased, high-quality hydrologic data collection is the trademark of the USGS. This is of particular importance when there are competing needs for the same resource. On Long Island, the quantity and quality of water is affected by human activities, not only in Nassau County, but also in neighboring Suffolk County and New York City. The USGS is a neutral, independent party that provides data that are robust and defensible.
References Cited
Como, M.D., Finkelstein, J.S., Rivera, S.L., Monti, J., Jr., and Busciolano, R., 2018, Water-table and potentiometric-surface altitudes in the upper glacial, Magothy, and Lloyd aquifers of Long Island, New York, April-May 2016: U.S. Geological Survey Scientific Investigations Map 3398, 4 sheets, scale 1:125,000, 5 p., accessed May 3, 2023, at https://doi.org/10.3133/sim3398.
Masterson, J.P., and Breault, R., 2019, Water for Long Island—Now and for the future: U.S. Geological Survey Fact Sheet 2019–3052, 2 p., accessed May 3, 2023, at https://doi.org/10.3133/fs20193052.
Taylor, C.J., and Alley, W.M., 2001, Ground-water-level monitoring and the importance of long-term water-level data: U.S. Geological Survey Circular 1217, 68 p., accessed May 2, 2023, at https://doi.org/10.3133/cir1217.
U.S. Geological Survey, 2019, Long Island depth to water viewer: U.S. Geological Survey web page, accessed May 16, 2023, at https://ny.water.usgs.gov/maps/li-dtw/.
U.S. Geological Survey, 2022, U.S. Geological Survey hydrologic monitoring on Long Island, New York: U.S. Geological Survey web page, accessed May 16, 2023, at https://www.usgs.gov/centers/new-york-water-science-center/science/us-geological-survey-hydrologic-monitoring-long.
U.S. Geological Survey, 2023, USGS water data for the nation: U.S. Geological Survey database, https://doi.org/10.5066/F7P55KJN.
For more information, contact
Director, New York Water Science Center
U.S. Geological Survey
425 Jordan Road
Troy, NY 12180–8349
dc_ny@usgs.gov
(518) 285–5602
or visit our website at
https://www.usgs.gov/centers/ny-water
Publishing support provided by the Pembroke Publishing Service Center
Disclaimers
Any use of trade, firm, or product names is for descriptive purposes only and does not imply endorsement by the U.S. Government.
Although this information product, for the most part, is in the public domain, it also may contain copyrighted materials as noted in the text. Permission to reproduce copyrighted items must be secured from the copyright owner.
Suggested Citation
Breault, R.F., Masterson, J.P., Busciolano, R., and Fisher, I., 2023, A century of hydrologic data collection prepares western Long Island for current and future water-resources challenges (ver. 1.1, July 2023): U.S. Geological Survey Fact Sheet 2023–3024, 4 p., https://doi.org/10.3133/fs20233024.
ISSN: 2327-6932 (online)
ISSN: 2327-6916 (print)
Study Area
| Publication type | Report |
|---|---|
| Publication Subtype | USGS Numbered Series |
| Title | A century of hydrologic data collection prepares western Long Island for current and future water-resources challenges |
| Series title | Fact Sheet |
| Series number | 2023-3024 |
| DOI | 10.3133/fs20233024 |
| Edition | Version 1.0: June 2023; Version 1.1: July 2023 |
| Publication Date | June 15, 2023 |
| Year Published | 2023 |
| Language | English |
| Publisher | U.S. Geological Survey |
| Publisher location | Reston, VA |
| Contributing office(s) | New York Water Science Center |
| Description | 4 p. |
| Country | United States |
| State | New York |
| Other Geospatial | western Long Island |
| Online Only (Y/N) | N |
| Additional Online Files (Y/N) | N |