

Flood Damage Costs Beyond Buildings—A Lake Champlain Case Study
Links
- Document: Report (1.65 MB pdf) , HTML , XML
- Data Release: USGS data release - U.S.-Side Principal Economic Indicators For the International Joint Commission Lake Champlain Richelieu River Study Project (2022)
- NGMDB Index Page: National Geologic Map Database Index Page (html)
- Download citation as: RIS | Dublin Core
Floods account for more than 75 percent of Federal disaster declarations and lead other natural disasters in economic costs. Early-warning systems have lowered flood-related fatalities, but costs continue to rise as flood-prone areas continue to be urbanized (U.S. Geological Survey, 2006). A Lake Champlain case study shows that at moderate flood heights, the economic costs of non-structural damages or losses—such as temporary lodging, residential debris removal, commercial revenue losses, and road repair—can be greater than economic damages to buildings. For unprecedented flood heights, non-structural damages can still total more than 10 percent of structural damage costs.
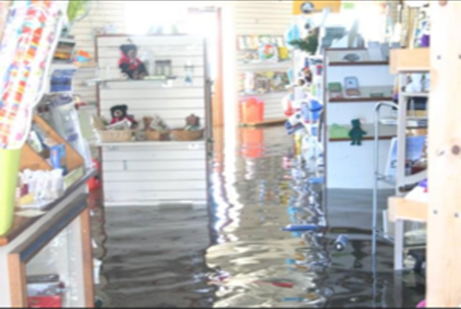
A Lake Champlain marina store flooded in 2011. Photograph used with permission.
Lake Champlain Case Study Context and Approach
Lake Champlain is a 436 square-mile lake bordered by New York on the western side and Vermont on the eastern side (fig. 1). The lake’s uppermost region spans the U.S.-Canadian border and sits within the 9,277 square-mile Lake Champlain Basin. Lake Champlain’s only drainage outlet is the Richelieu River, which flows north into the Canadian province of Quebec. Increasingly over the past 50 years, housing and other construction on both sides of the international border have converted wetlands, increased impervious surface area, and straightened tributaries, increasing flows of rain-water run-off. Occasionally, flooding causes significant economic damages in New York, Vermont, and Quebec, with the highest floods on record in the early 1990s and in 2011. Flooding on Lake Champlain begins at 99.57 feet (ft) above sea level, and major flooding at 101.07 ft above sea level. Herein, flood “depth,” “height,” and “elevation” all refer to water levels between 99 to 106 ft above sea level.
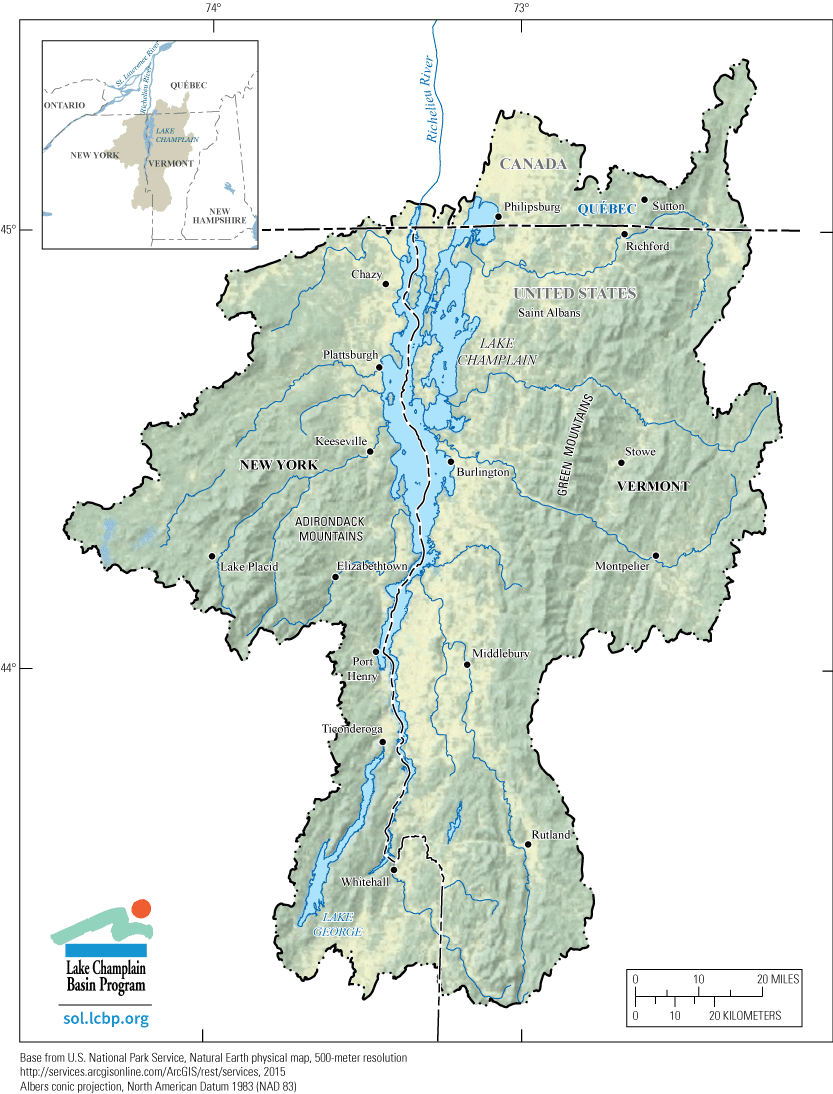
Outline of Lake Champlain Watershed in New York, Vermont, and Quebec. Modified from Flynn and Hayes (2016).
Following the third deepest seasonal snowfall in over 100 years, almost no seasonal snowmelt, then heavy rains, the spring of 2011 delivered record flooding to 102.77 ft. This was more than 1 foot over the 1993 record and expanded the lake’s area by 66 square miles, or about 5.8 percent (Lake Champlain Basin Program, 2013; International Lake Champlain-Richelieu River Study Board, 2019). (The record flood height, 102.77 ft, is often reported as 103.07 ft or 103.27 ft in Burlington, Vermont, owing to different origin measurements for digital elevation models, and some wave action, and differs in the Lake Champlain Basin Program [2013] and International Lake Champlain-Richelieu River Study Board [2019] reports.) With a single drainage point for the extra water volume and multiple rain events, it took approximately 6 weeks for the flood to peak and then return to a lake level below flood stage. Wind-to-wave-driven erosion occurred up to 5 ft above static lake elevation in some areas.
The International Joint Commission (IJC) between the United States and Canada handles boundary water issues between the two countries. The IJC Lake Champlain Richelieu River (LCRR) Study Board project is a bi-national, multiagency effort to assess flood risk, and to project costs and benefits (including savings) from specific structural or societal interventions that may mitigate Lake Champlain flooding or flood effects.
The U.S.-side flood-based economic damages and losses summarized in this fact sheet served as inputs to new modeling tools developed for the LCRR Study Board project that calculate benefit-to-cost ratios associated with structural interventions. For example, adding a submerged weir in the Richelieu River yielded a greater-than-one benefit-to-cost ratio in late-stage modeling (International Lake Champlain-Richelieu River Study Board, 2022), whereas a dam on either side, or an entirely new canal on the Canadian side, were never entertained as cost feasible or even appropriate (International Lake Champlain-Richelieu River Study Board, 2021).
The scope of the U.S.-side economic analysis done by U.S. Geological Survey (USGS) economists pertained only to so-called lake-rise flooding that has little velocity but can have wave action. Flood damage or losses on tributaries to Lake Champlain were not included, because tributary rivers are managed by the United States only (in a bi-national project assessment). Uncommonly low lake levels compared to recent decades (95 ft and lower) were also considered as a stakeholder concern (adding a weir helps to raise minimum depths too).
Economic damages from flooding are often modeled using the Federal Emergency Management Agency’s (FEMA) Hazus-Multi-Hazard tool (https://www.fema.gov/flood-maps/products-tools/hazus). Hazus models economic costs of structural damages to buildings within the projected flood level of the census tract each building type is located in. The LCRR Study Board project used Hazus modeling to estimate structural cost damages at different flood depths, then defined Principal Indicators (PIs) to supplement, or alternatively estimate, results from applying Hazus—where gaps exist or where unmodified Hazus output values may be inaccurate in the LCRR context. The PI approach provides depth-damage estimates for a set of costs separate from estimates of building damages from lake-rise flooding. Seven PIs were estimated on the Canadian and U.S. sides of Lake Champlain, in addition to Hazus depth-damage estimates, after emergency response costs and ecosystem service losses were dropped as PIs for time and budget reasons. Depth-damage agricultural yield losses were estimated for the Canadian and U.S. sides by the Canadian economic team.
The U.S.-side economists produced cost estimates for six PIs: temporary lodging costs; residential debris clean-up and disposal; damage to roads and bridges (and railroads); damage to water treatment facilities; income loss from industrial or commercial properties; and separately and specifically recreation sector income loss. Residential damage estimates included the costs of securing emergency and longer-term lodging when residents are displaced from their homes by lake-rise flooding, and the costs of clean up and disposal of debris from residential property damage. In the public sector, costs of clean up and repair of damages to roads and bridges from lake-rise flooding were calculated, as were damages and potential revenue losses from flood mitigation measures and service reductions, where public or private water utilities are inundated by lake-rise flooding. In the commercial sector, revenue losses from business closures due to lake-rise flooding were calculated separately for businesses outside of the recreation sector, and for recreation-sector businesses: lakeside campgrounds; marinas; and ferry services (where ferries are also used for local commercial traffic). Table 1 provides a summary of low and high cost ranges for each PI, and one note for each on how the cost estimates were generated or how to interpret them.
In Rhodes (2022) depth-damage estimates are reported in increments of 1 foot or more, and indicate magnitudes of costs that comply with reasonable scenario assumptions for a small but consistent set of flood depths from 99.57 to 105.57 ft, where the highest water level is almost 3 ft above the historic maximum flood height of 102.77 ft. Developing different estimation techniques for each PI using expert consultation offers plausible, logical, reliable, and reproducible magnitudes for depth-damage cost estimates and provides a framework for each PI that can be easily modified if higher-quality information becomes available.
Table 1.
Summary of cost and loss estimates for both New York and Vermont, unless otherwise noted.[k, thousands; VT, Vermont; ft, feet]
Following for each of the 6 PIs is a short list of features that affect modeling or results, where each pertains to both New York and Vermont, unless otherwise noted:
Residential Temporary Lodging Costs
-
· (Modeling parameter) Lake-rise floodwater has very low velocity.
-
· (Feature) For Lake Champlain, loss of utility service due to flooding is unlikely to drive a need for temporary lodging.
-
· (Modeling parameter) No fixed-structure homes are actually or actuarially destroyed, because homes that would take 8 feet of lake water above the first floor were lost decades ago.
-
· (Modeling parameter) Because water wicks up the walls at 12 inches deep on the first floor, and spills into electrical sockets at 18 inches, these in-house water heights drive much longer periods away from home, for tear out and repairs to be completed.
-
· (Modeling parameter) If homeowners recognize that they will be away from their homes for at least 90 days, they will find a rental property rather than stay in a hotel, as it is a less expensive lodging option.
Residential Debris Clean-Up and Disposal
-
· (Modeling parameter) With very low floodwater velocity, Lake Champlain residential structures are never actuarially totaled (except for mobile homes with over 1 foot of water inside, which Hazus treats as totaled).
-
· (Modeling parameter) FEMA’s Hazus model offers technical guidance, with debris weights by structure type, per 1,000-square-foot of building area.
-
· (Feature) Few Lake Champlain lakeside homes have basements, as U.S. flood insurance laws prohibit coverage of basements in new residential structures.
-
· (Modeling parameter) The 8.72 percent of lakeside homes with basements in New York, and the 1.27 percent in Vermont (Bill Werick, IJC LCRR Study Board contract researcher, oral commun., 2022) have, by the Hazus guidance, more debris per structure at a given flood height than homes without basements.
Commercial Revenue Losses
-
· (Modeling process) The Hazus structural damage model, modified for different flood depths, nominated 113 and 109 sites as businesses that may suffer flood damage in New York and Vermont, respectively.
-
· (Modeling process) Removing sites that were misidentified as businesses, or that were accounted in other PIs (for example, recreation business sites, water treatment, or railroad buildings), reduced the final set of properties affected by a nearly 106 ft flood, to 5 sites for New York and 11 sites for Vermont.
-
· (Result) Businesses located on docks directly over the water were estimated to have the most consistent and highest losses.
Recreation Revenue Losses
-
· (Modeling process) Projected losses depended on site-specific factors, such as how fast the slope rises from the water, and where key structural features, such as boat lifts, are located.
-
· (Modeling process) Campgrounds and marinas were separately categorized by what percentage of their property would be underwater in a flood as high as the 2011 record flood.
-
· (Feature) During a five-month summer season, recreation industry revenue varies a lot by month, with little traffic before Victoria and Memorial Days, and often full-capacity (all sites full) weeks in July and August.
-
· (Modeling parameter) Revenue loss projections were set based on the month that flood heights recede low enough for specific types of camping, marina, or ferry sites to begin operating, within four categories of percentage of property underwater.
Roads and Bridges (Including Railroads)
-
· (Feature) From lake-rise flooding, with very low water velocity but with wave action, bridges are unlikely to be badly damaged, and there may be little scour of roads.
-
· (Modeling parameter) Van Ginkel and others (2021) analyze flooding in many countries, and suggest that for low velocity flooding, often only 1 to 3.5 percent of the (Hazus model) cost of total road replacement needs to be projected as repair costs.
-
· (Modeling parameter) Train tracks are unlikely to suffer damage in the LCRR context, but tracks may need to be spot checked for debris and cleaning at flood heights at least a foot higher than 2011’s 102.77 ft record.
Water Treatment Facilities
-
· (Feature) Only two facilities on the lake may have serious or high-cost problems above the 2011 flood height, when no water treatment facilities were shut down on the lake—but the one in Vermont serves 40,000 customers.
-
· (Modeling parameter) Feasible quick-response options by facilities managers, engineers, and work crews as flood waters rise slowly across the entire basin make it unlikely that water service will be interrupted, even with floods nearly 3 ft above the 2011 record height.
-
· (Modeling parameter) Lake Champlain is so large that any sewage spills from wastewater treatment facilities will not affect water intake quality, because water intakes are far enough out into the lake, and natural dilution keeps the water within treatable levels for any flood-based pollutants.
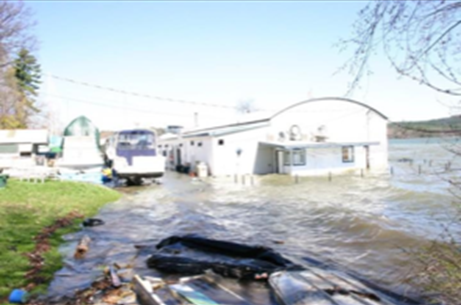
A Lake Champlain marina flooded in 2011. Photograph used with permission.
Estimated Principal Indicator Costs Compared to the Structural Damage Estimates for Buildings, at a Range of Flood Elevations
Table 2 presents and compares totals for non-structural and structural damage costs for the six PIs at three different flood heights for Lake Champlain: 101.07 ft is the moderate flood level (https://vem.vermont.gov/sites/demhs/files/documents/2018SHMP-HazardAssessmentInundationFloodingFluvialErosion.pdf); 103.07 ft is approximately the historic record flood height (spring 2011); and 105.57 ft is the highest flood level as projected by hydrologists on the LCRR Study Board project. The first row compares costs and revenue losses for five of the six PIs, with the largest-cost single PI, “Roads, bridges, and railroads,” as a separate total in the second row. These are followed by the full 6-PI total (non-structural damages) in the third row. Estimated building damage total costs (structural damages) appear for the same three flood elevations as for the PIs.
Below the first four rows are ratios of the 5-PI total costs to the building damage total costs at each of the flood elevations, followed by the same ratios for the 6-PI total (table 2). At a flood height of 101.07 ft, where vulnerable buildings have long since been cleared away and new construction is generally prohibited, the 5-PI ratio is more than 4 times (400 percent) the estimated building damages across New York and Vermont. Adding the roads, bridges, and railroads total to the numerator of the ratio raises the ratio to more than 18-to-1 (1,800 percent).
At 103.07 ft, the PI totals are substantial, at around 40 percent for the 5-PI ratio, and just below 90 percent of structural damage estimates for the 6-PI ratio. Whereas for a 105.57-ft flood, for example, many structures would be damaged that were believed to be outside of any flood zone. At this very improbable flood elevation, the 5-PI ratio drops to around 10 percent, and the 6-PI ratio drops to less than 20 percent.
Table 2.
Comparisons of total cost estimates for the six principal indicators at three different flood heights for Lake Champlain in New York and Vermont.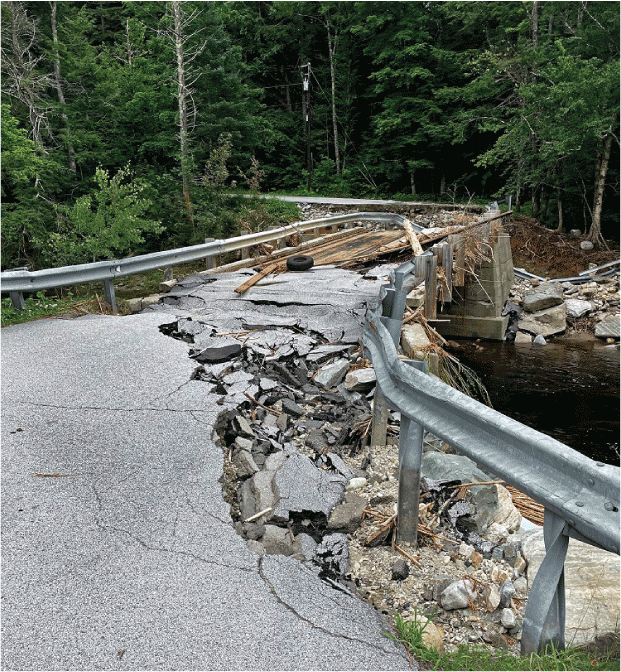
Flood damage to the Cobble Ridge Road Bridge after a heavy rainfall event in Londonderry, Vermont. Photograph by the U.S. Geological Survey.
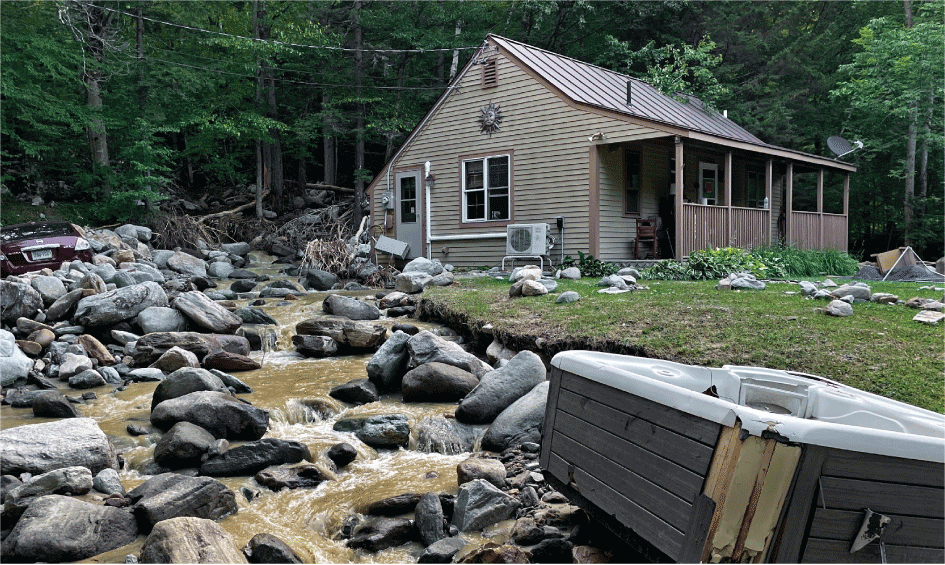
Heavy flooding in Plymouth, Vermont, caused by a two-day rainstorm in July 2023, transported boulders down a hillside to cover a resident’s car and move their hot tub. Photograph by the U.S. Geological Survey.
References Cited
Flynn, R.H., and Hayes, L., 2016, Flood-inundation maps for Lake Champlain in Vermont and in northern Clinton County, New York: U.S. Geological Survey Scientific Investigations Report 2016–5060, 11 p., accessed May 2023 at https://doi.org/10.3133/sir20165060.
International Lake Champlain-Richelieu River Study Board, 2019, The causes and impacts of past floods in the Lake Champlain-Richelieu River Basin—Historical information on flooding, A report to the International Joint Commission, 108 p., accessed October 2022 at https://www.ijc.org/sites/default/files/2020-03/9056-CMI%20Rapport%20public%20EN-FINAL-HR.pdf.
International Lake Champlain-Richelieu River Study Board, 2021, Potential structural solutions to mitigate flooding in the Lake Champlain-Richelieu River Basin, A report to the International Joint Commission, 85 p., accessed August 2023 at https://ijc.org/sites/default/files/LCRR%20Structural%20Solutions%20Report_EN_01142022_2.pdf.
International Lake Champlain-Richelieu River Study Board, 2022, Evaluation of potential structural solutions in the Richelieu River to Mitigate Extreme Flooding, A report to the International Joint Commission, 96 p., accessed August 2023 at https://ijc.org/sites/default/files/LCRR_Structural_Alternatives_Addendum_EN_102422.pdf.
Lake Champlain Basin Program, 2013, Flood resilience in the Lake Champlain Basin and Upper Richelieu River: International Lake Champlain-Richelieu River Study Board web page, 93 p., accessed October 2022 at https://www.lcbp.org/wp-content/uploads/2013/04/FloodReport2013_en.pdf.
Rhodes, C.R., 2022, U.S.-side principal economic indicators for the International Joint Commission Lake Champlain Richelieu River Study Project: U.S. Geological Survey data release, accessed August 2023 at https://doi.org/10.5066/P9XWERGY.
U.S. Geological Survey, 2006, Flood hazards – A national threat: U.S. Geological Survey Fact Sheet 2006–3026, 2 p., accessed August 2023 at https://doi.org/10.3133/fs20063026.
Van Ginkel, K.C.H., Dottori, F., Alfieri, L., Feyen, L., and Koks, E.E., 2021, Flood risk assessment of the European road network: Natural Hazards and Earth System Sciences, v. 21, no. 3, p. 1011–1027, accessed September 2022 at https://doi.org/10.5194/nhess-21-1011-2021.
For more information about this publication, contact:
Center Director, USGS Science and Decisions Center
U.S. Geological Survey
12201 Sunrise Valley Dr.
Mail Stop 310
Reston, VA 20192
703-648-573
Disclaimers
Any use of trade, firm, or product names is for descriptive purposes only and does not imply endorsement by the U.S. Government.
Although this information product, for the most part, is in the public domain, it also may contain copyrighted materials as noted in the text. Permission to reproduce copyrighted items must be secured from the copyright owner.
Suggested Citation
Rhodes, C., 2023, Flood damage costs beyond buildings—A Lake Champlain case study: U.S. Geological Survey Fact Sheet 2023–3034, 6p., https://doi.org/10.3133/fs20233034.
ISSN: 2327-6932 (online)
Study Area
| Publication type | Report |
|---|---|
| Publication Subtype | USGS Numbered Series |
| Title | Flood damage costs beyond buildings—A Lake Champlain case study |
| Series title | Fact Sheet |
| Series number | 2023-3034 |
| DOI | 10.3133/fs20233034 |
| Publication Date | October 05, 2023 |
| Year Published | 2023 |
| Language | English |
| Publisher | U.S. Geological Survey |
| Publisher location | Reston, VA |
| Contributing office(s) | Science and Decisions Center |
| Description | Report: 6 p.; Data Release |
| Country | Canada, United States |
| State | New York, Vermont |
| Other Geospatial | Lake Champlain |
| Online Only (Y/N) | Y |
| Additional Online Files (Y/N) | N |